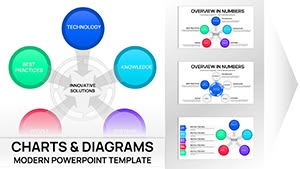
Innovative Solutions PowerPoint Charts Template | Fully Editable Slides - Instant Download
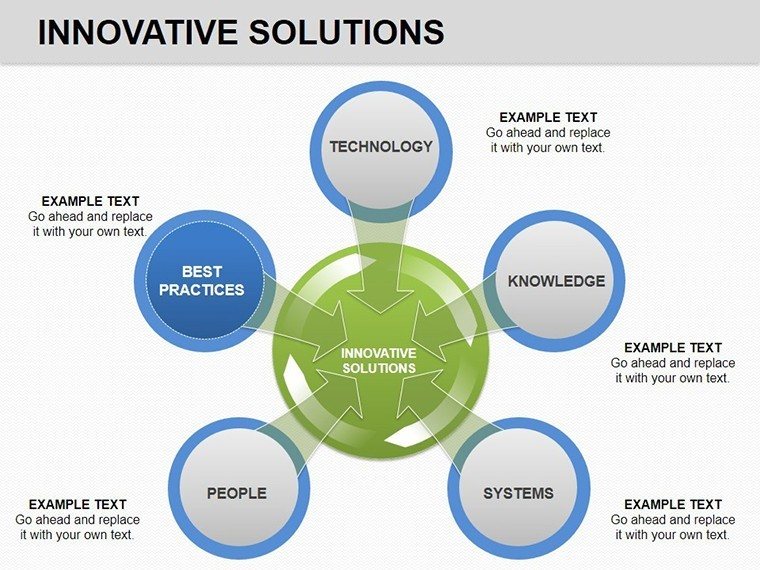

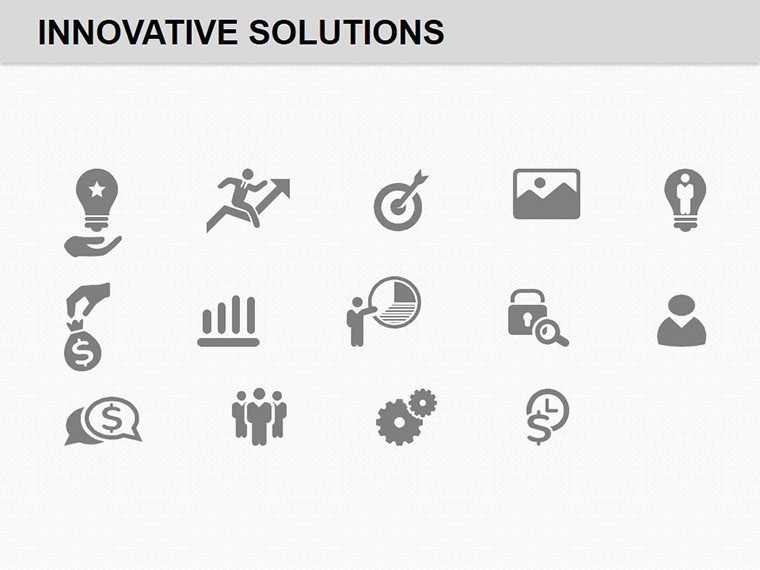


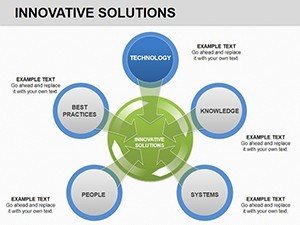

This Innovative Solutions PowerPoint Charts template is designed for professionals who need to explain business solutions, risks, and processes clearly in meetings and reports. Instead of building charts manually, you get a structured set of ready-to-use visual slides that help your audience understand complex data at a glance. The template works especially well for executive briefings, internal strategy reviews, and client-facing presentations where clarity and speed matter.
Feature & Slide Breakdown
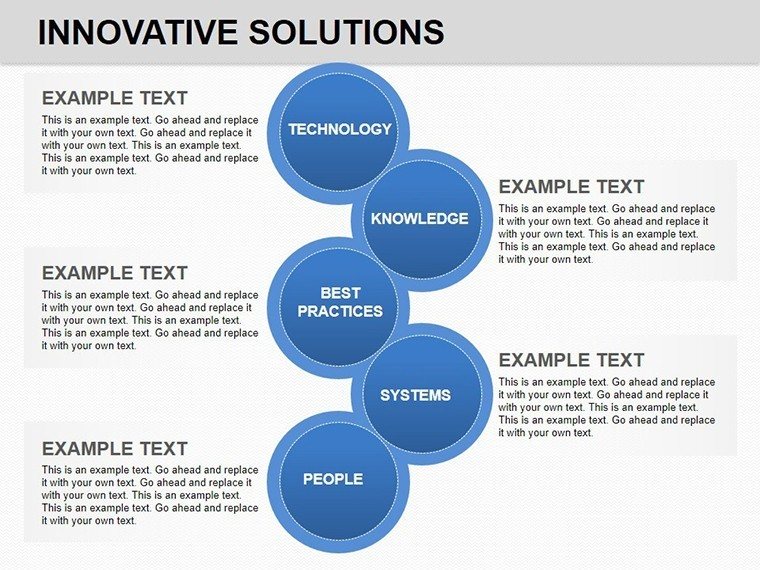
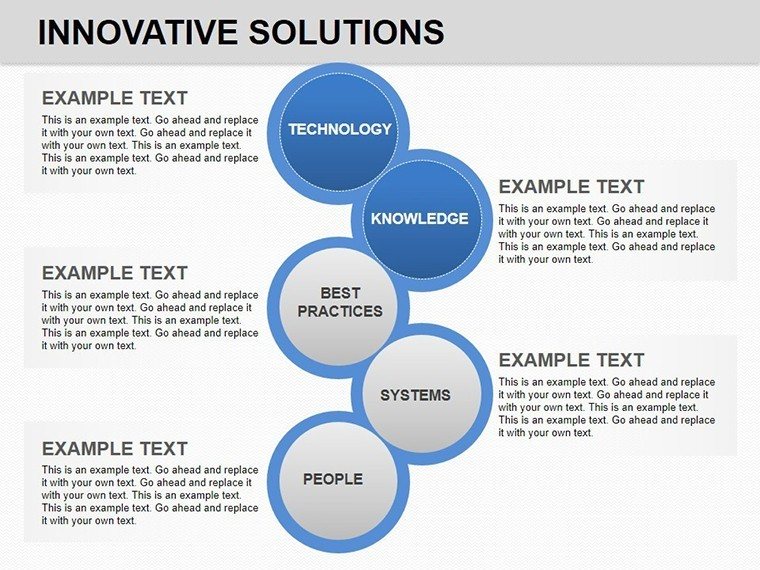
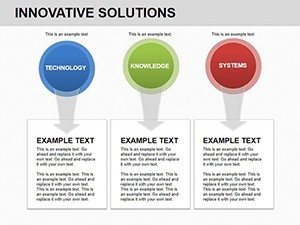
- 14 fully editable PowerPoint chart slides
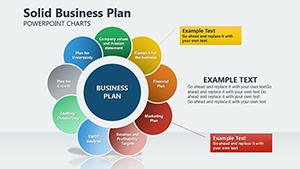
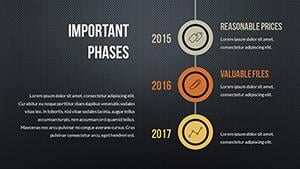
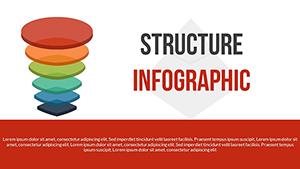
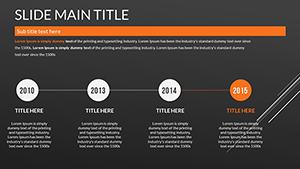
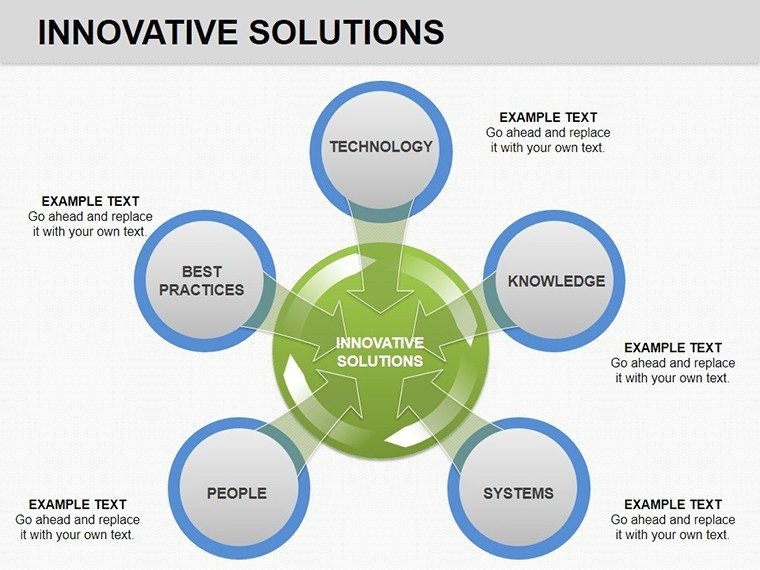
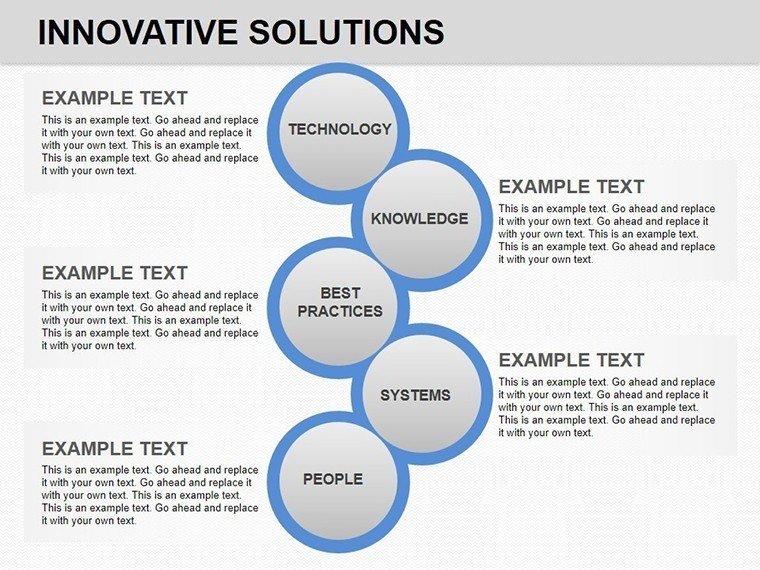
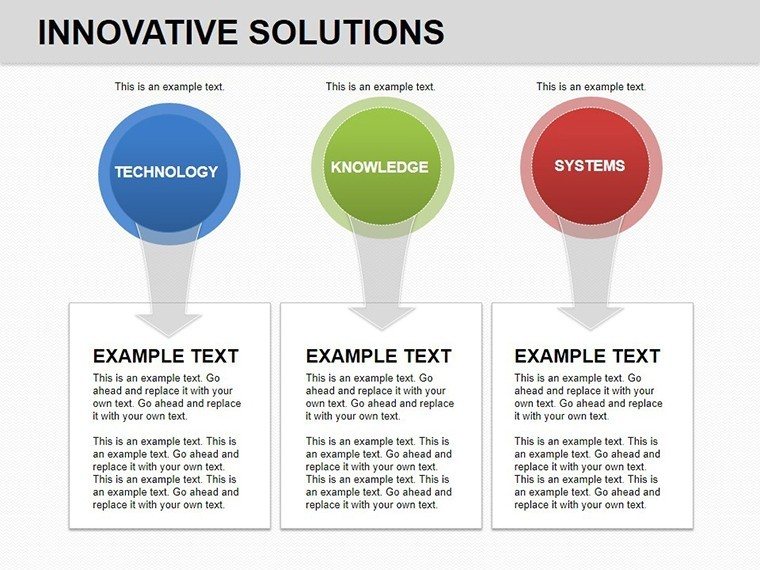
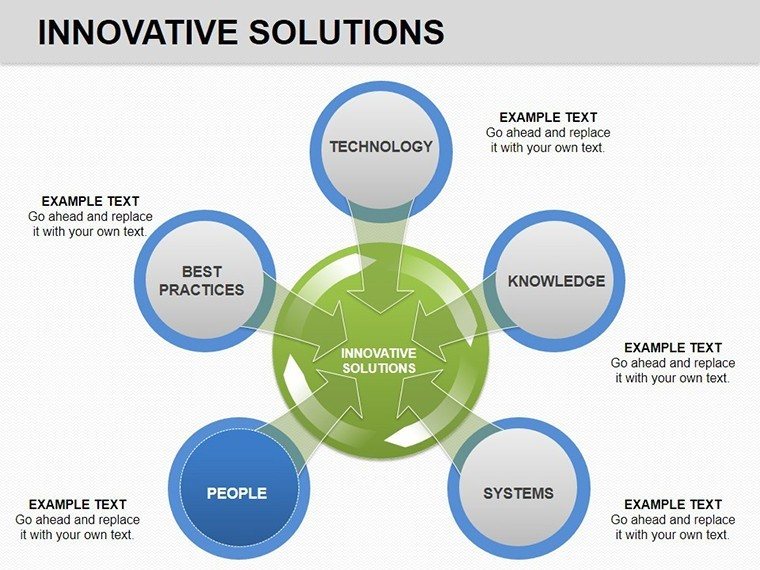
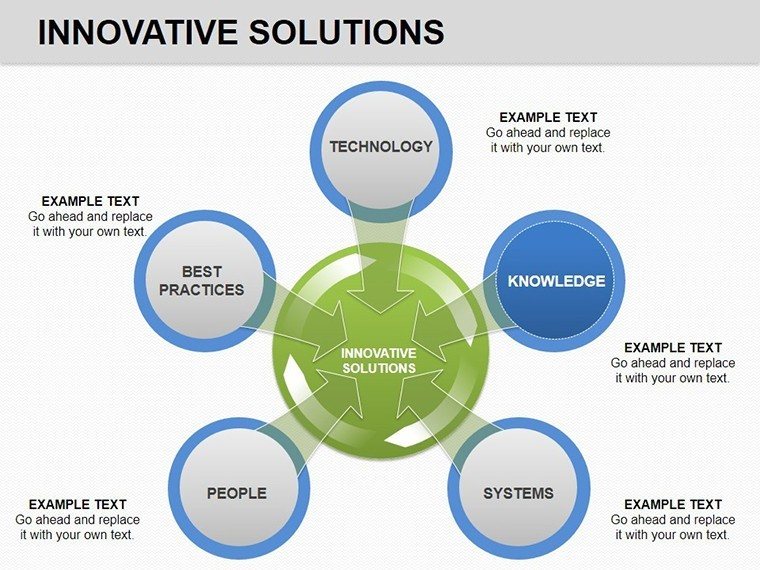
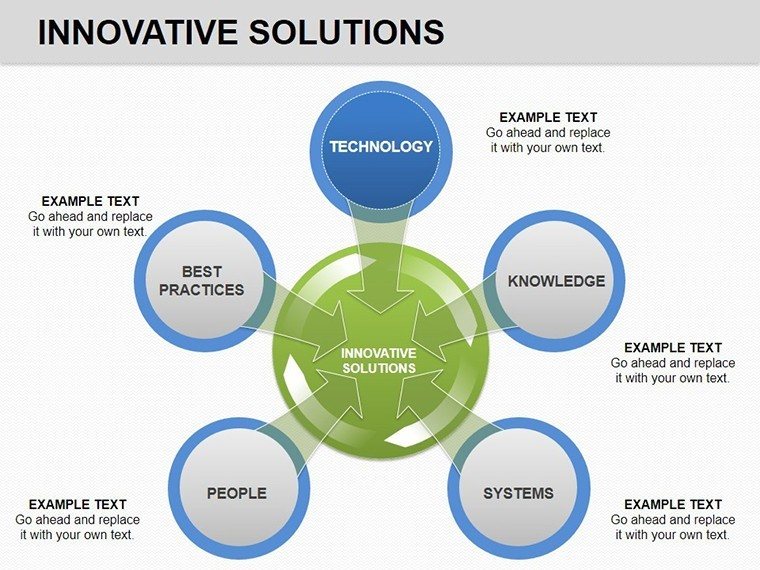
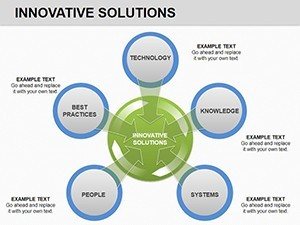
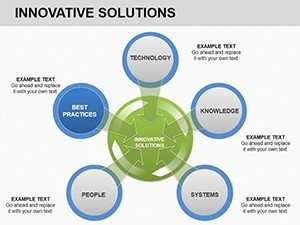
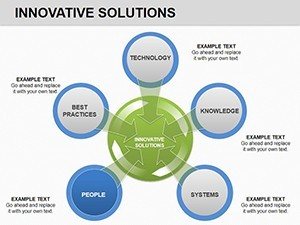
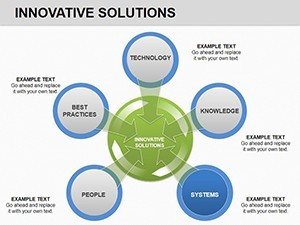
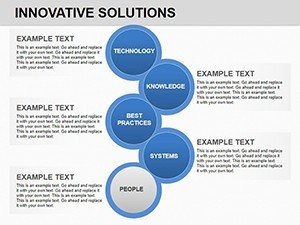
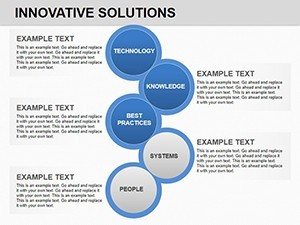
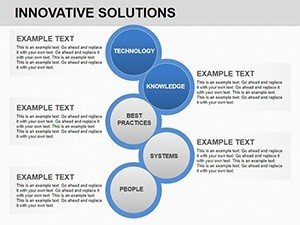
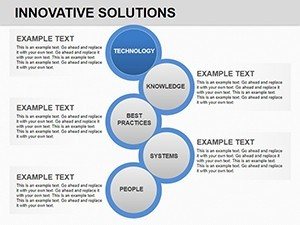
- Cycle, pie, numeric, and area-based visual layouts
- Optimized for business solutions and risk analysis discussions
- Easy color, text, and data customization
Professional Use Cases
Use this template when presenting business solutions, operational cycles, or risk assessments to stakeholders. It fits board meetings, management updates, startup pitch reviews, and consulting presentations where structured logic is required.
Workflow Integration
Insert your data directly into PowerPoint, adjust labels and colors to match your brand, and finalize slides in minutes. This template integrates smoothly into existing decks without forcing a redesign.
Real-World Scenarios
Consultants use these charts to explain solution frameworks. Managers rely on them to visualize risks and mitigation steps. Entrepreneurs use them to structure investor conversations logically.
Internal Comparison Table
| Slide Type | Audience | Outcome |
|---|---|---|
| Cycle Charts | Executives | Clear process understanding |
| Pie & Numeric Charts | Teams & Clients | Fast data interpretation |
Industry Applications
Business consulting, corporate strategy, education, startups, and professional services.
Frequently Asked Questions
When should I use this chart template?
Use it when you need to explain business solutions, cycles, or risks clearly during professional presentations.
When is this template not ideal?
It may not fit creative storytelling decks that require illustrations instead of structured charts.
How fast can I customize the slides?
Most users finalize slides within minutes by editing text, values, and colors directly in PowerPoint.