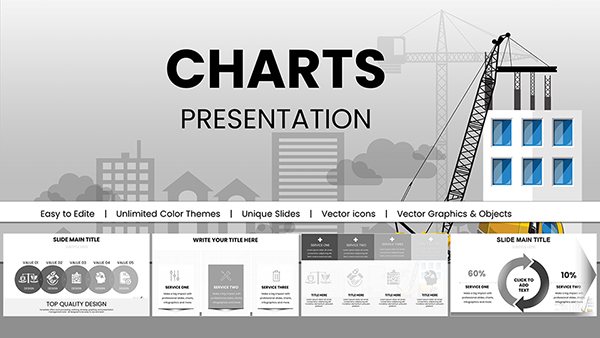
Constructor Solutions PowerPoint Charts Template: Build Visually Stunning Narratives


Think of your data as building blocks, ready to be assembled into a towering structure of insight. The Constructor Solutions PowerPoint Charts Template provides 11 editable slides with 3D cube-inspired designs, enabling marketers to construct campaign overviews or startups to erect investor decks with solid foundations. Inspired by construction metaphors in business strategy, as seen in Harvard Business Review pieces on modular thinking, this template fortifies your presentations against boredom.
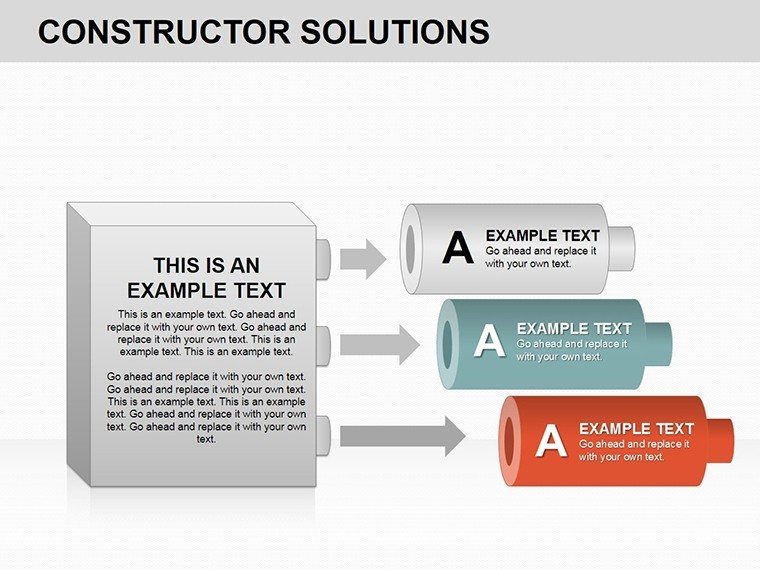
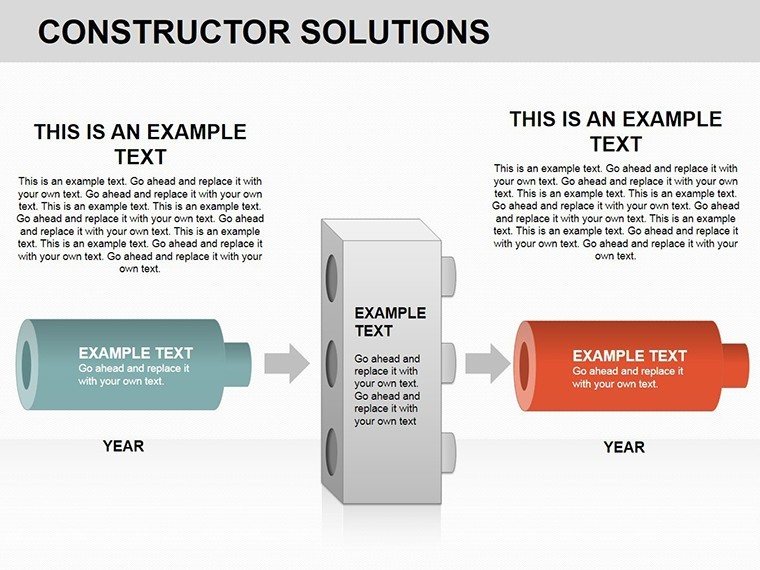
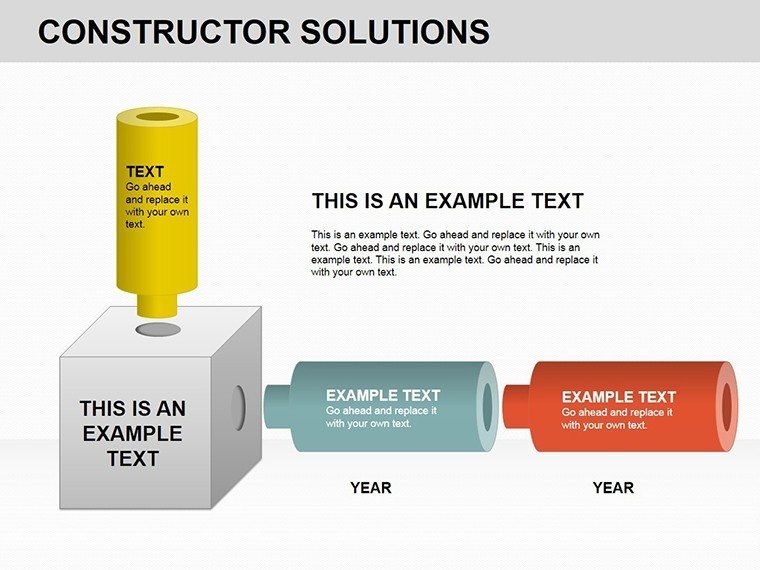
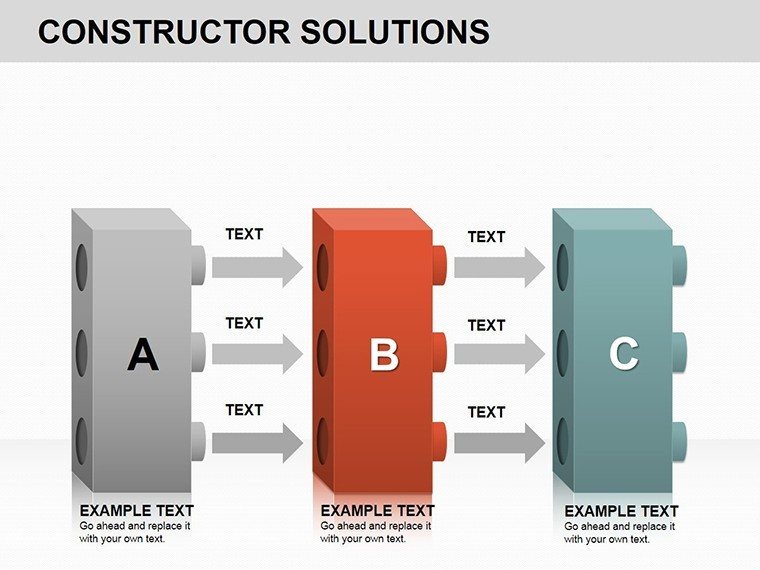
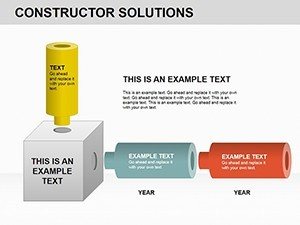
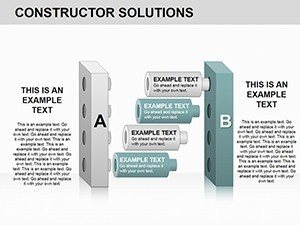
Central to its appeal are the constructor-style charts - cubes that stack and connect to represent data volumes, much like Lego for professionals. This solves the puzzle of flat visuals failing to convey scale, with users in construction firms using analogs to model project bids, per industry reports from Deloitte.
Core Features for Constructive Design
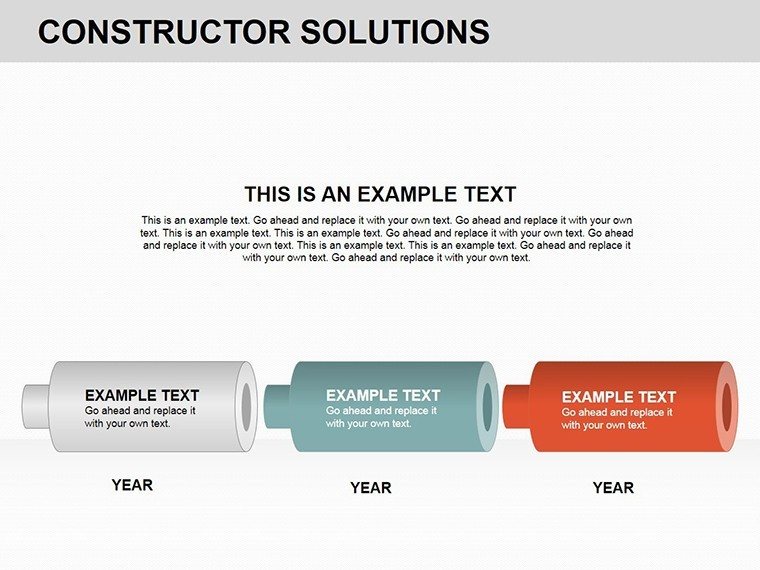
Key attractions include robust customization: Alter cube colors, add textures, and scale sizes to embody your data's weight. Compatible across PowerPoint and Google Slides, it supports team builds without collapse. Slides vary from single cubes to elaborate assemblies.
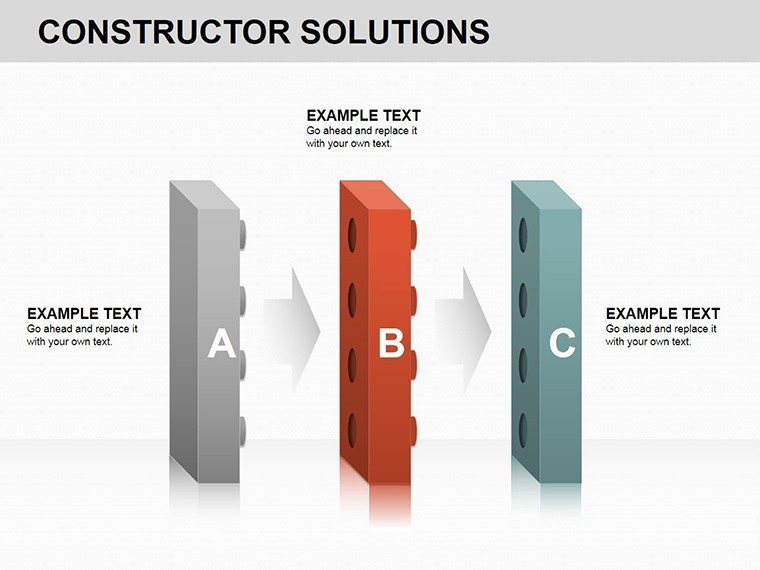
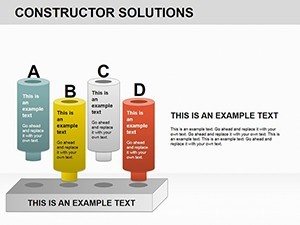
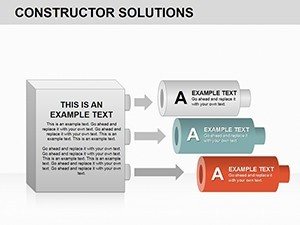
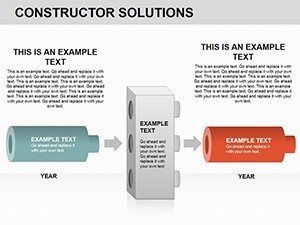
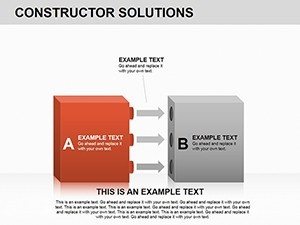
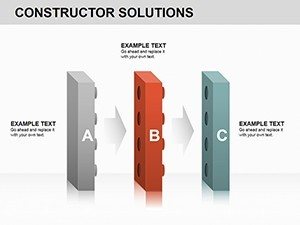
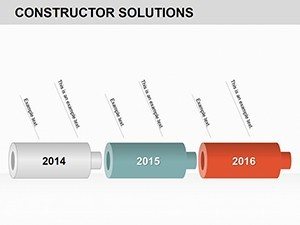
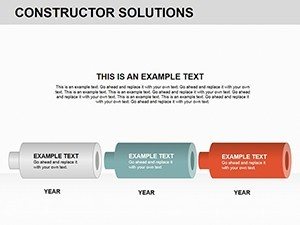
- Slides 1-3: Foundation Cubes - Base-level charts for simple metrics, like revenue blocks.
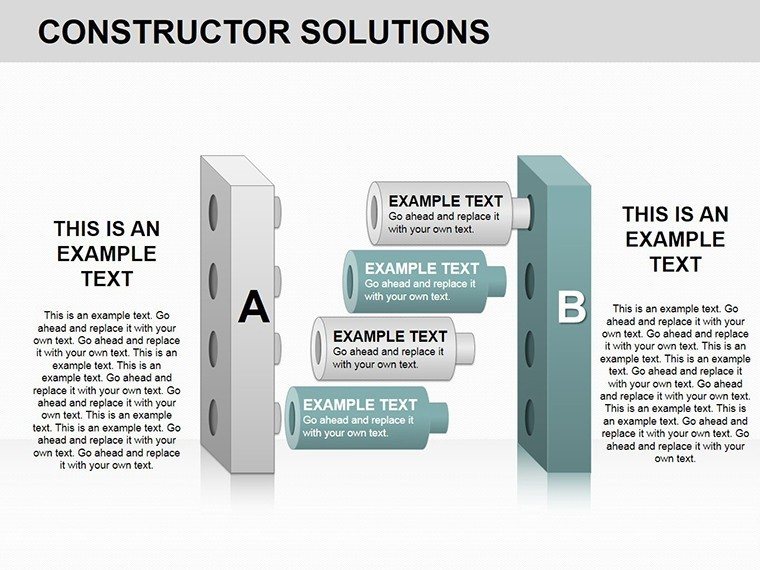
- Slides 4-7: Stacked Constructions - Multi-layer for comparisons, such as market share builds.
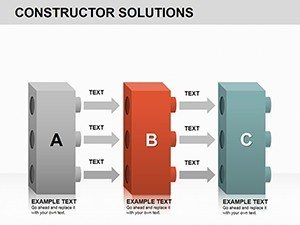
- Slides 8-11: Connected Frameworks - Interlinked cubes for relational data, like supply chains.
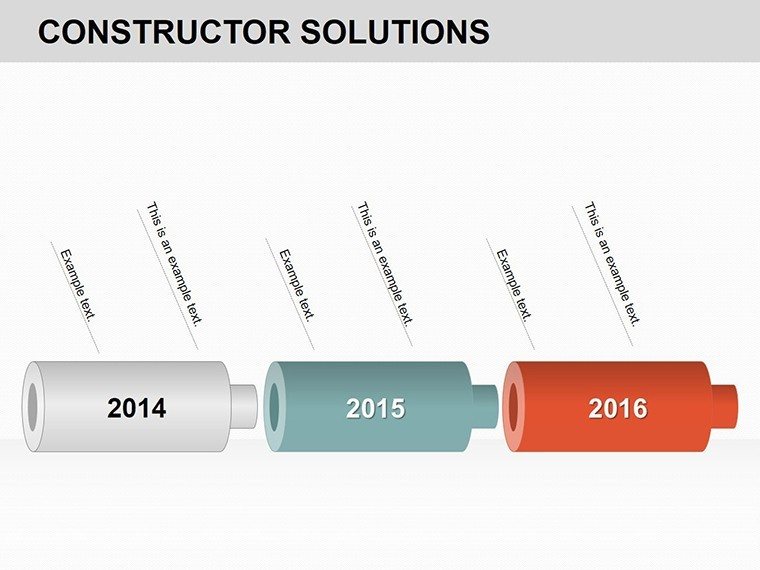
Embed data dynamically from spreadsheets, aligning with BIM (Building Information Modeling) principles for accuracy in visual reps.
Building Use Cases in Various Fields
Construct in context: Marketing teams erect strategy towers, visualizing ROI layers. Startups build pitch scaffolds, stacking traction metrics to secure funding, as in Y Combinator demo day successes.
Assembly guide: Select a blueprint slide, lay your data foundation, customize the structure, and top with compelling titles. Superior to basic charts, it adds dimensionality, per 3D viz studies from IEEE. Workflow: Design in CAD-inspired mindset, then present.
With a nod to fun, 'construct' your way out of dull slides - no hard hat required. Educators stack knowledge blocks for engaging lessons.
Tips for Solid Presentation Foundations
Strengthen with: Use shadows for realism, per graphic design norms from AIGA. Balance loads to avoid visual overload. Google Slides ensures cloud stability.
Build boldly - download the Constructor Solutions PowerPoint Charts Template and erect your masterpiece.
Frequently Asked Questions
- How customizable are the cubes?
- Fully - rotate, color, and connect as needed.
- Compatible with Google Slides?
- Yes, 3D effects preserve well.
- Can I animate builds?
- Yes, layer-by-layer reveals.
- Suitable for non-business?
- Absolutely, like educational models.
- File size concerns?
- Optimized for quick loads.