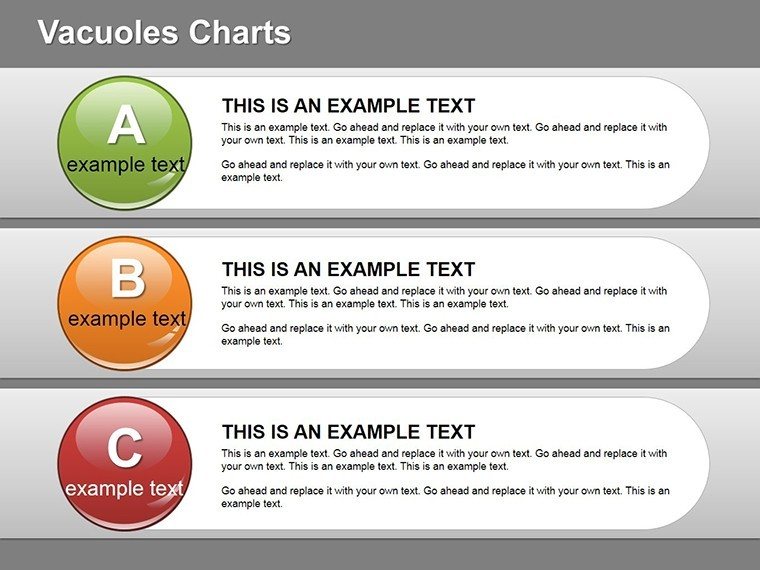
Dynamic Vacuoles Charts: Science Meets Visual Brilliance


Type: PowerPoint Charts template
Category: Spheres
Sources Available: .pptx
Product ID: PC00207
Template incl.: 23 editable slides
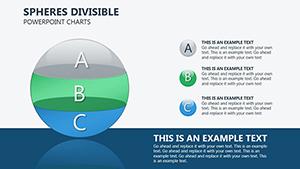
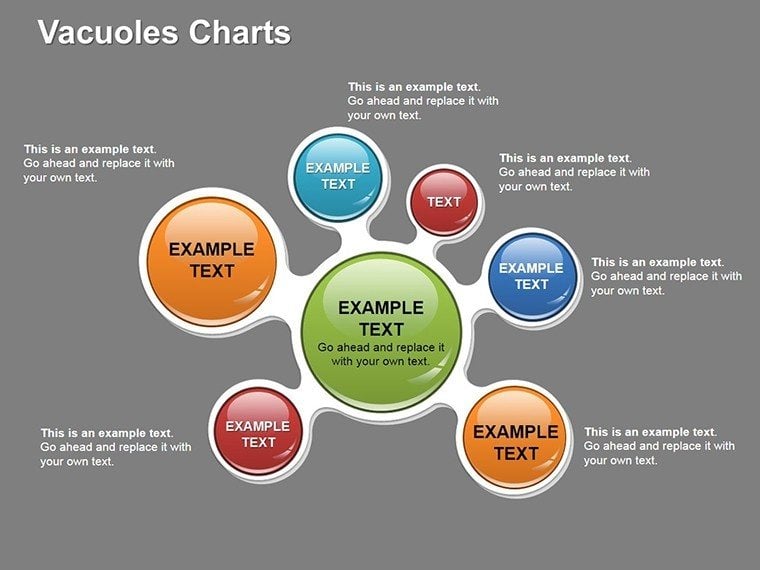
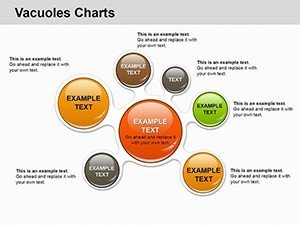
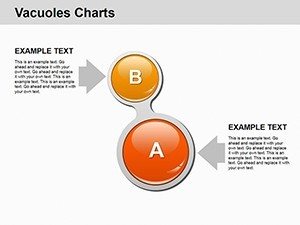
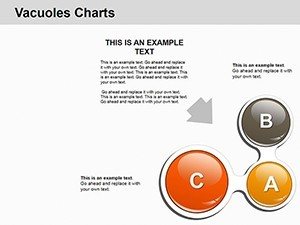
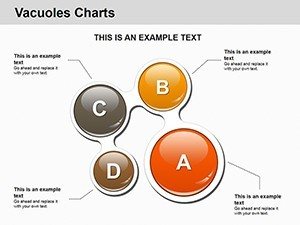
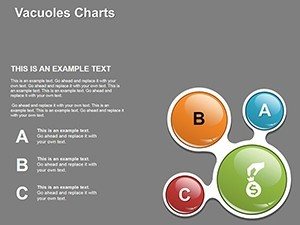
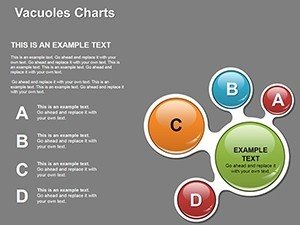
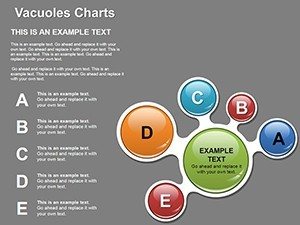
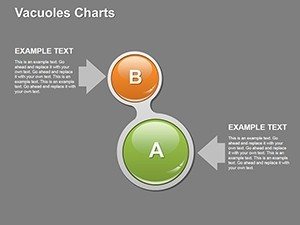
Delve into the microscopic world with macroscopic impact using our Vacuoles PowerPoint Charts Template, featuring 23 editable slides that bring biological concepts to vibrant life. Perfect for biologists charting cellular structures or architects drawing parallels to void spaces in designs, this template merges scientific accuracy with artistic flair. It addresses the challenge of making abstract science accessible, turning lectures or reports into immersive experiences that educate and enthuse.
With nods to standards like those from the American Society for Cell Biology, it's a tool for precise visualization. Advantages: Deeper understanding through visuals, time-efficient edits, and adaptability for interdisciplinary use, like architectural voids in sustainable buildings.
Key Features Fueling Scientific Discovery
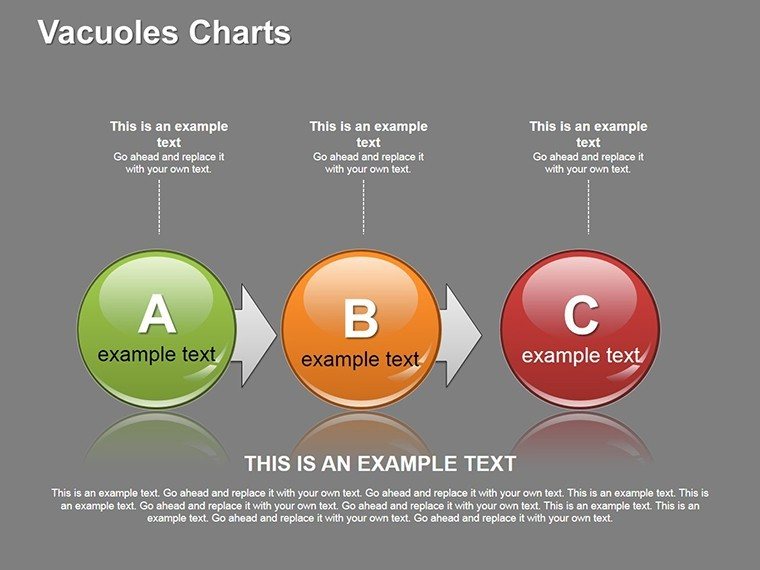
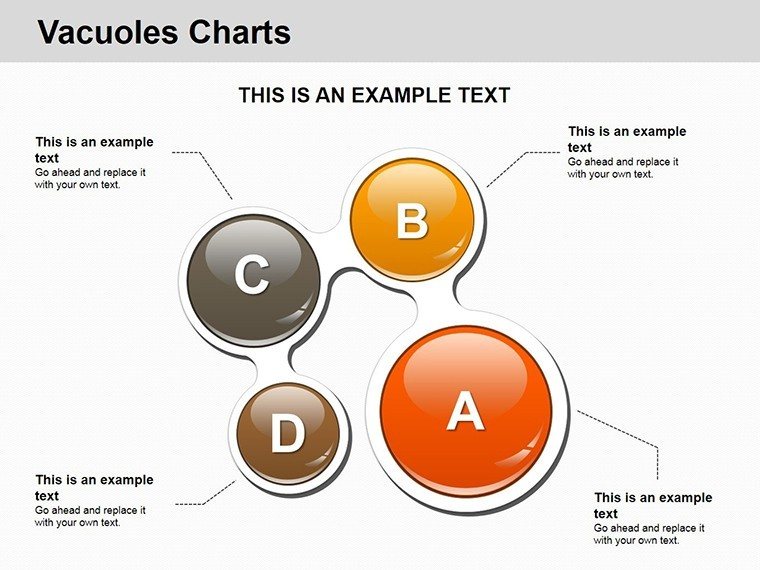
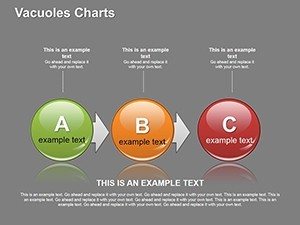
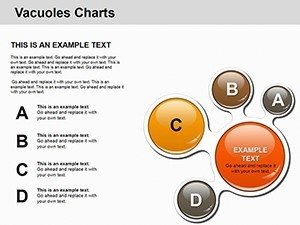
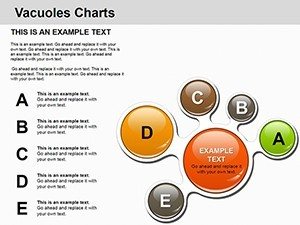
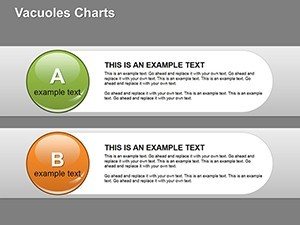
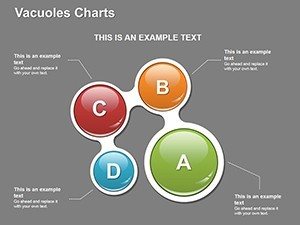
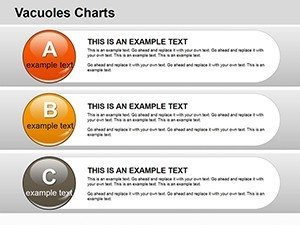
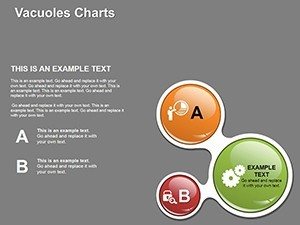
Across 23 slides, explore pie charts for composition breakdowns and bars for comparative sizes, all themed around vacuoles.
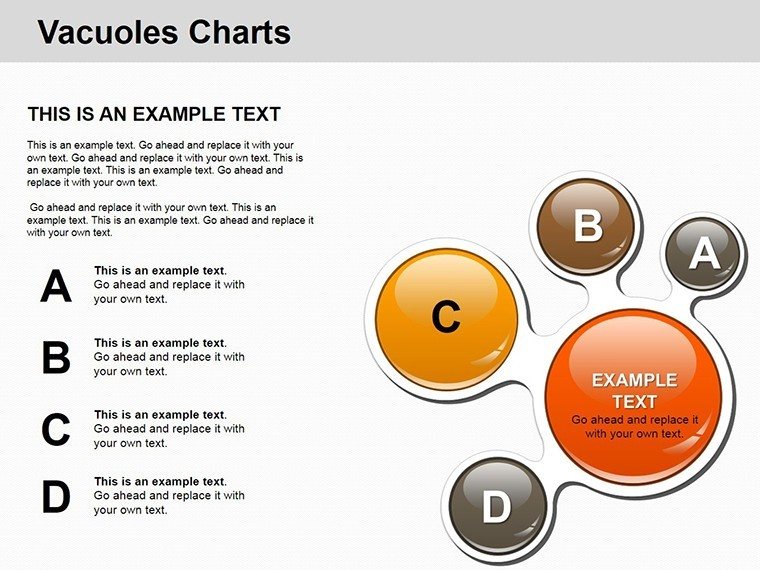
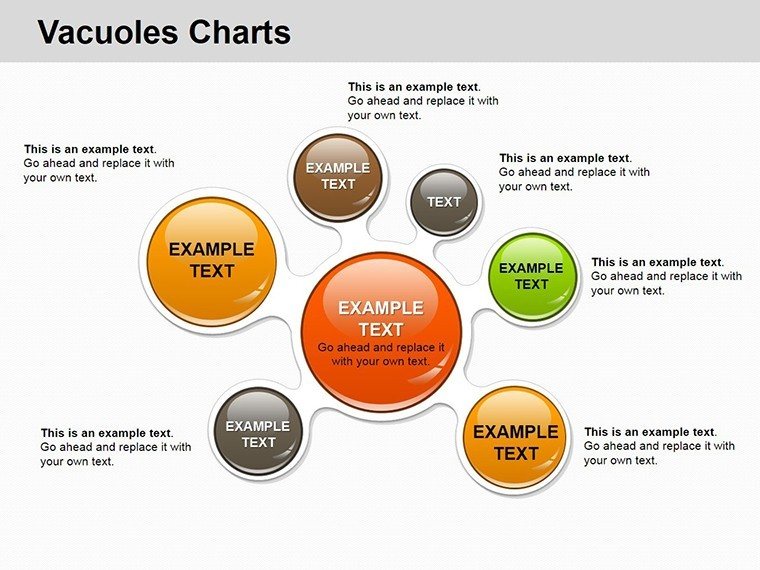
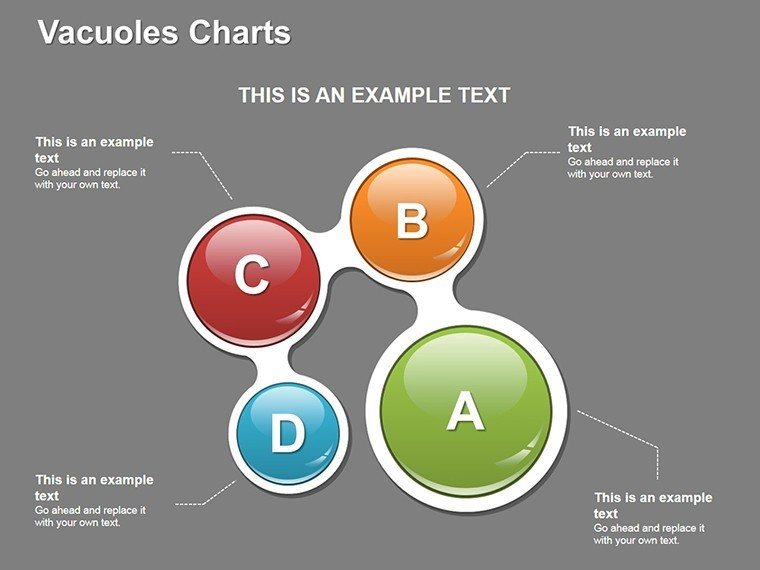
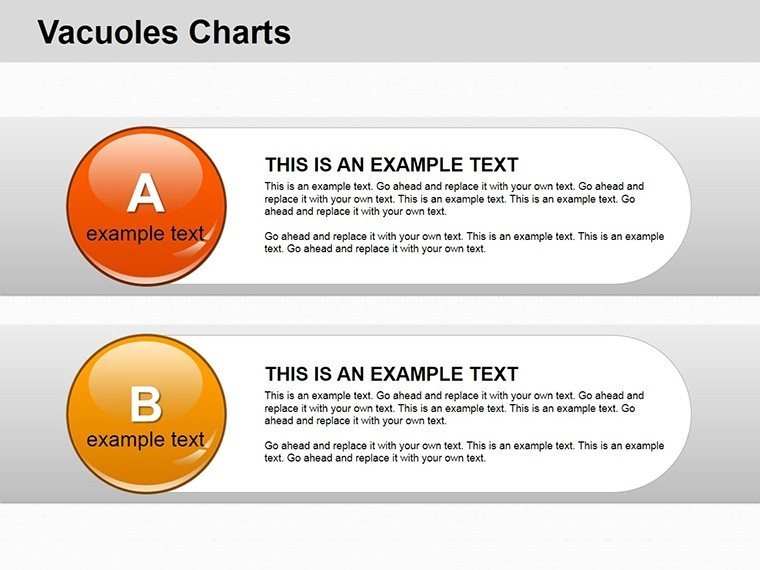
- Customization Depth: Alter shapes to represent plant vs. animal vacuoles.
- Color Precision: Use gradients for fluid representations.
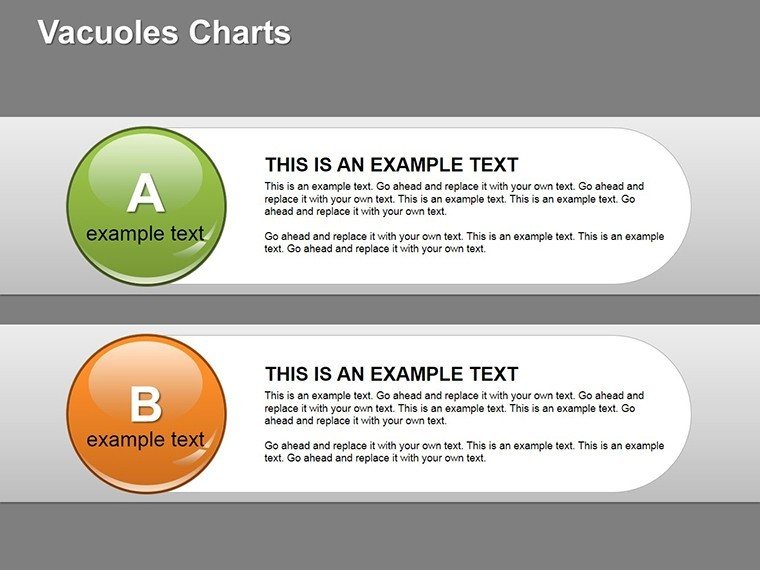
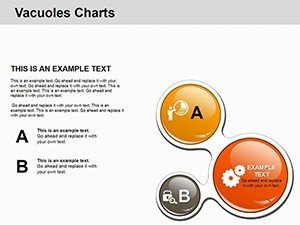
- Data Accuracy: Embed metrics with tooltips for details.
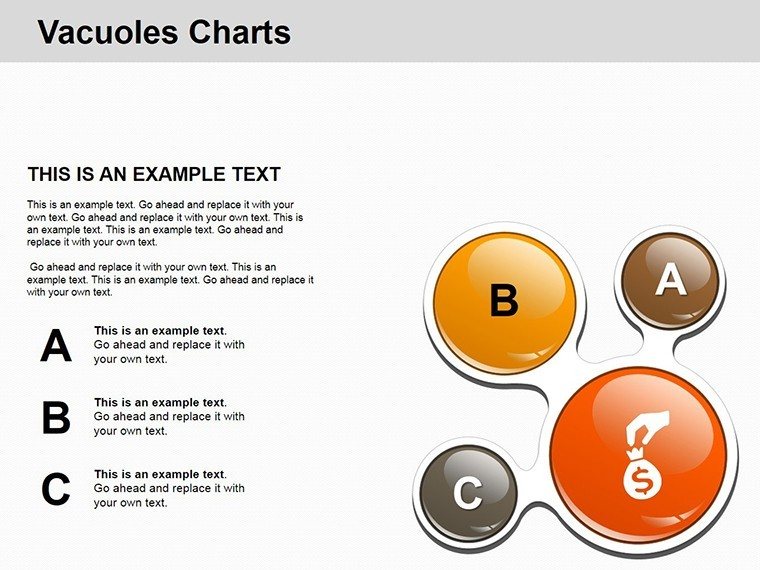
- Thematic Icons: Biology-specific symbols for enhanced relevance.
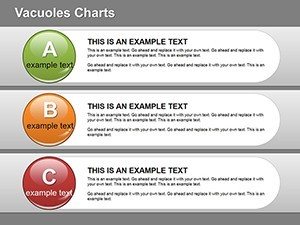
Fully .pptx, it supports animations that simulate cellular processes.
Interdisciplinary Use Cases with Real Value
Scientists can illustrate vacuole functions in research pitches, as in a study on plant stress where visuals clarified mechanisms, aiding grant wins. Architects might analogize to building cavities for airflow, in line with AIA green guidelines.
Educators engage students with interactive charts on osmosis; business pros adapt for process "voids" in workflows. Overcomes dull diagrams, fostering curiosity and better outcomes.
Step-by-Step Scientific Workflow
- Obtain the Set: Download for instant science boosts.
- Tailor to Topic: Adjust for specific vacuole types.
- Incorporate Insights: Add annotations for depth.
- Present Persuasively: Use transitions for flow.
Excels over standard charts with niche themes, accelerating prep.
Bridging Biology and Architecture Visually
For architects, vacuoles inspire hollow-core designs; visualize like biomimicry pros. Echo Darwin's observations with charts that evolve your narrative. If science feels vacuum-sealed, these charts burst it open with energy.
Tips: Scale accurately; layer for complexity. From lab experts, these build credible, inspiring content.
Insights for Visual Science Mastery
Balance detail with overview; use legends effectively. Optimize for hybrid audiences. These elevate your expertise showcase.
Invigorate your charts - download and discover the power of vacuoles today.
Frequently Asked Questions
How editable for biology lessons?
Completely, from colors to data inputs.
Can architects use analogies?
Yes, for structural voids and designs.
File compatibility?
.pptx works with PowerPoint and Google.
Number of slides?
23 versatile ones.
Scientific accuracy?
High, with precise scaling options.
Animation for processes?
Yes, simulate dynamics easily.