Tree Rings PowerPoint Charts Template: Layered Growth Visuals


Type: PowerPoint Charts template
Category: Organizational
Sources Available: .pptx
Product ID: PC00202
Template incl.: 12 editable slides
Like the rings of a tree telling its life story, our Tree Rings PowerPoint Charts Template reveals layers of progress and evolution in your data. With 12 editable slides, it's perfect for professionals, educators, and researchers depicting timelines, financial trajectories, or academic advancements. Imagine layering annual revenue growth in concentric circles or academic milestones in a radial format - this template brings historical depth to modern presentations, inspired by dendrochronology techniques used in environmental studies.
Aligned with data visualization best practices from experts like Stephen Few, it simplifies complex histories. In business, it mirrors balanced scorecards; in education, it illustrates evolutionary concepts.
Highlighted Features for Depth and Clarity
Features emphasize narrative layering, making growth stories vivid.
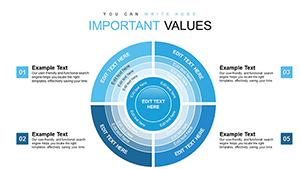
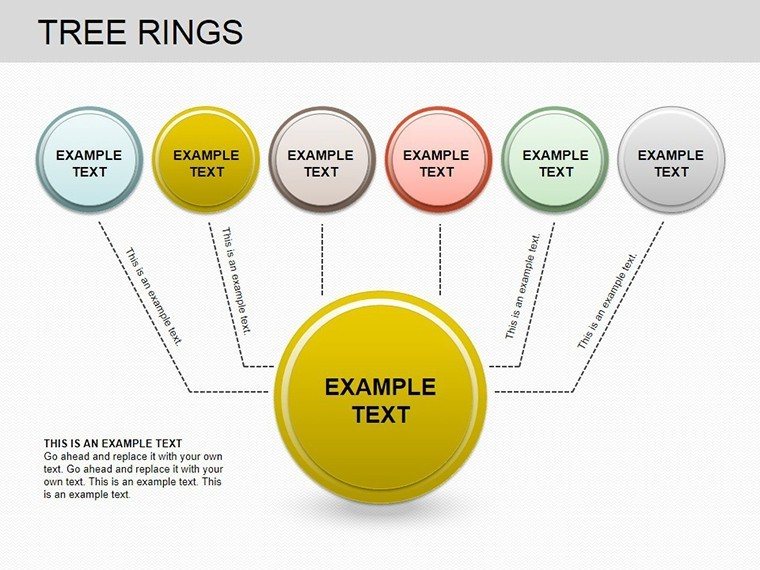
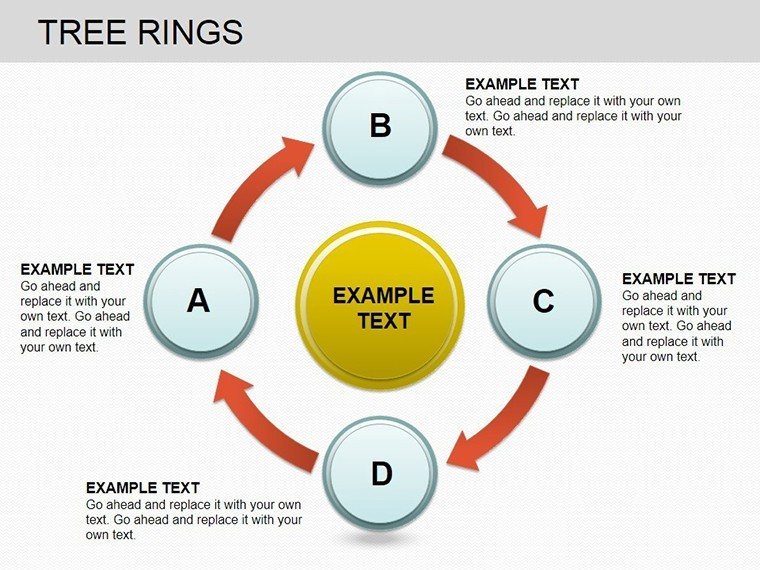
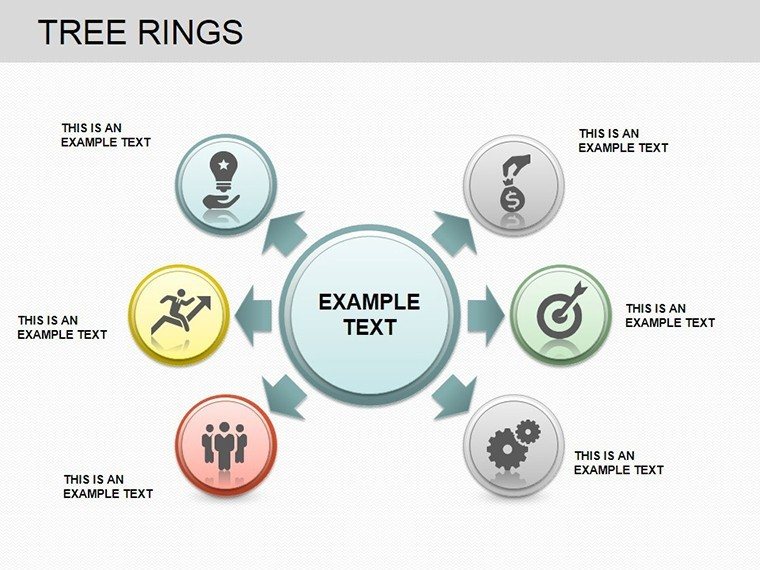
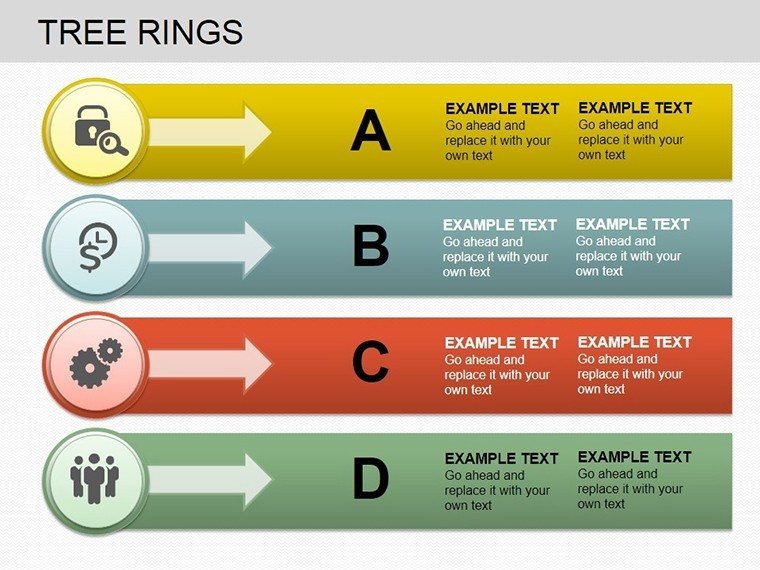
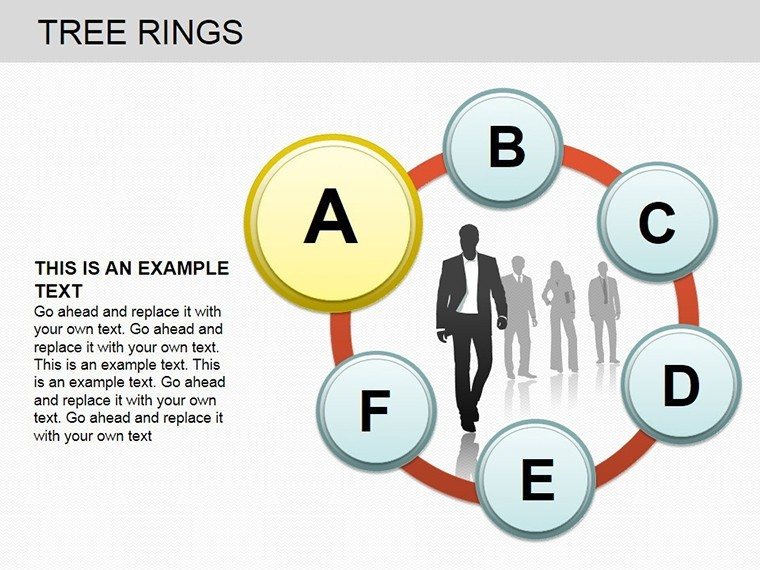
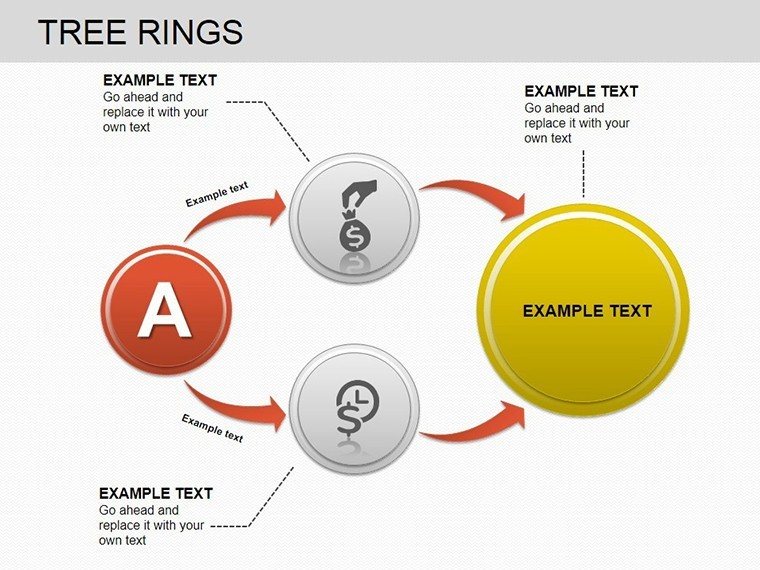
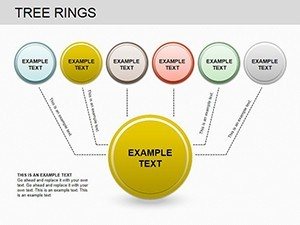
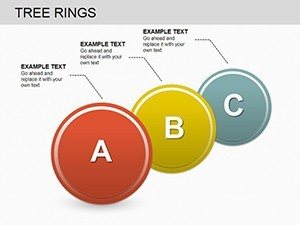
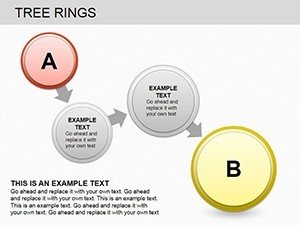
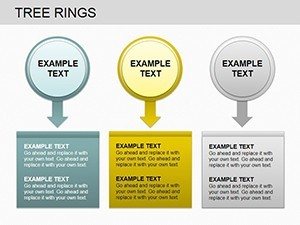
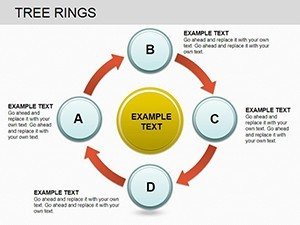
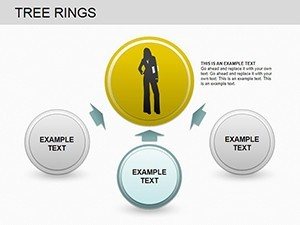
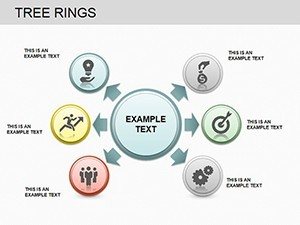
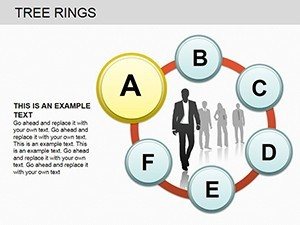
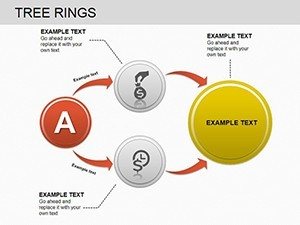
- Visual Ring Designs: Concentric charts for chronological data, engaging and informative.
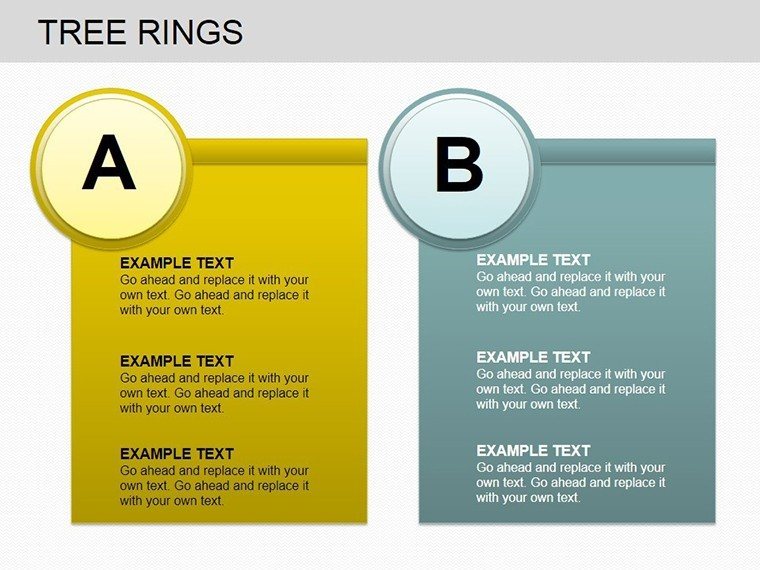
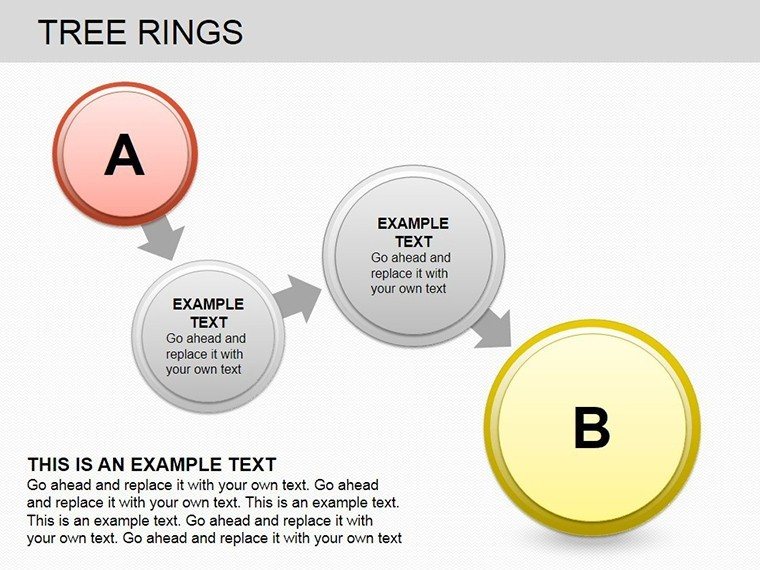
- Customization Options: Modify rings, labels, and colors for precise storytelling.
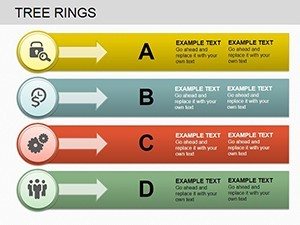
- Versatile Layouts: From simple overviews to detailed annotations.
- User Integration: Easy data input with .pptx format.
A research firm used ring charts to track climate data, enhancing grant proposals per NSF guidelines.
Applications Spanning Sectors
From boardrooms to classrooms, apply for layered insights.
- Financial Reporting: Show cumulative profits over years.
- Educational Tools: Depict historical events in rings.
- Research Findings: Visualize study phases and outcomes.
- Business Strategies: Layer market expansions.
An exec team visualized company history, boosting investor confidence.
Guidance for Ring Mastery
Start with core data at center; build outward. Vs. linear timelines, rings compact information elegantly.
Unlock Your Growth Narrative
Trust this template for authoritative, engaging depictions of evolution.
Frequently Asked Questions
- How to add more rings?
- Duplicate layers and edit as needed.
- Supports animations?
- Yes, reveal rings progressively.
- Ideal for what data types?
- Chronological or cumulative datasets.
- Compatible with Google Slides?
- Fully, for collaborative editing.
- Any tutorials?
- Site resources available for tips.
- Commercial license?
- Included for professional use.