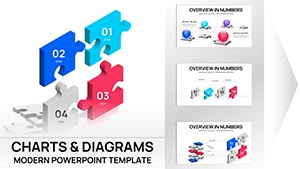
Analysis Sphere PowerPoint Charts Template


Type: PowerPoint Charts template
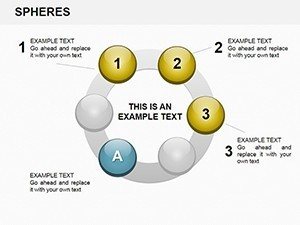
Category: Spheres
Sources Available: .pptx
Product ID: PC00194
Template incl.: 27 editable slides
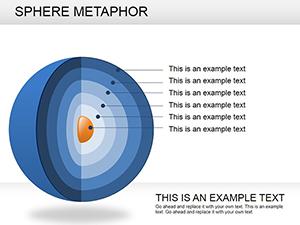
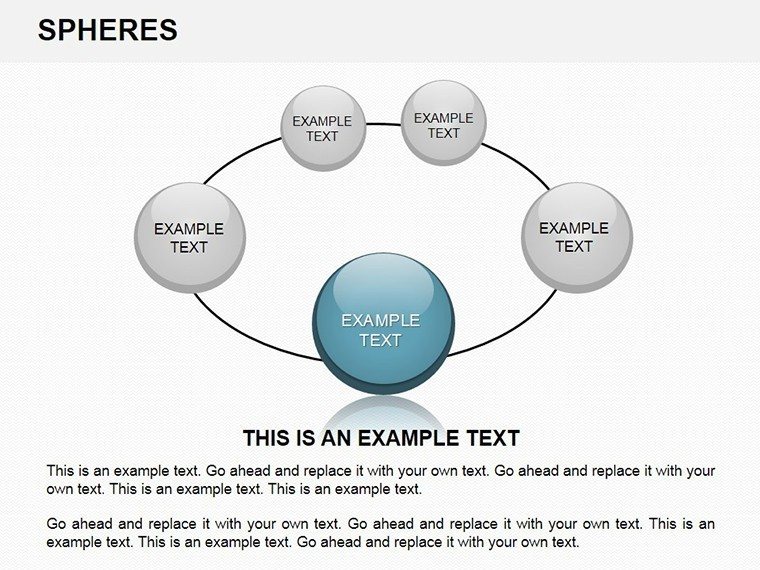
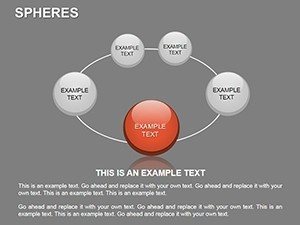
Imagine turning flat data into orbiting spheres that draw your audience in, making every proportion pop with clarity and style. The Analysis Sphere PowerPoint Charts Template is your go-to for crafting presentations where numbers don't just sit there - they engage, explain, and elevate. With 27 fully editable slides, this template specializes in 3D sphere visualizations, ideal for business professionals aiming to impress stakeholders, educators simplifying complex topics, or researchers unveiling findings with visual flair.
Whether you're dissecting market shares in a quarterly review or illustrating resource allocation in a project update, these spherical charts break down relative sizes in a way that's intuitive and memorable. No more struggling with basic pie charts that blend into the background; here, data orbits around your key message, supported by clean layouts and subtle animations that keep eyes locked. Tailored for those high-stakes moments - like pitching to investors or leading a workshop - this template saves you hours of design time, letting you focus on the story behind the stats.
Compatible with PowerPoint 2016 and later, it's as simple as dragging data into the spheres and watching them reshape. Think of it as giving your slides a gravitational pull, where each element connects to the whole. Professionals in consulting firms have leaned on similar spherical designs to map client ecosystems, turning abstract concepts into tangible takeaways. Ready to add that dimension? Grab this template and let your data sphere up your game.
Unlocking the Power of Spherical Data Displays
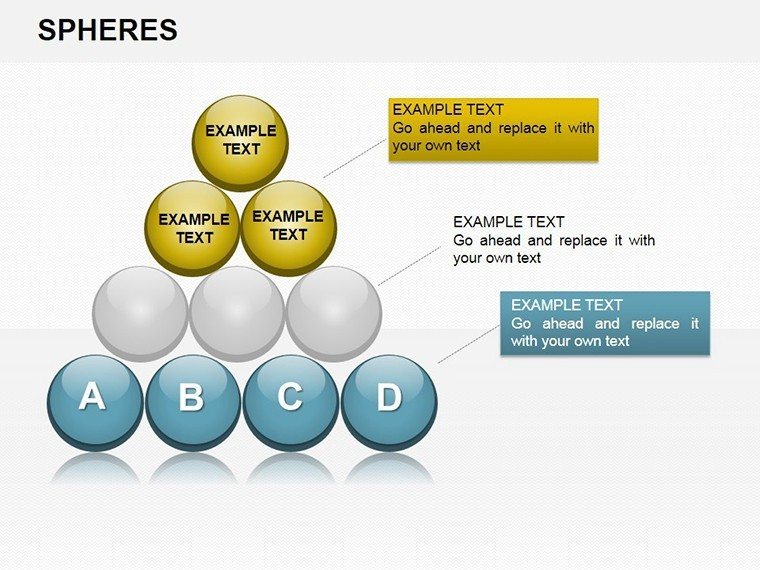
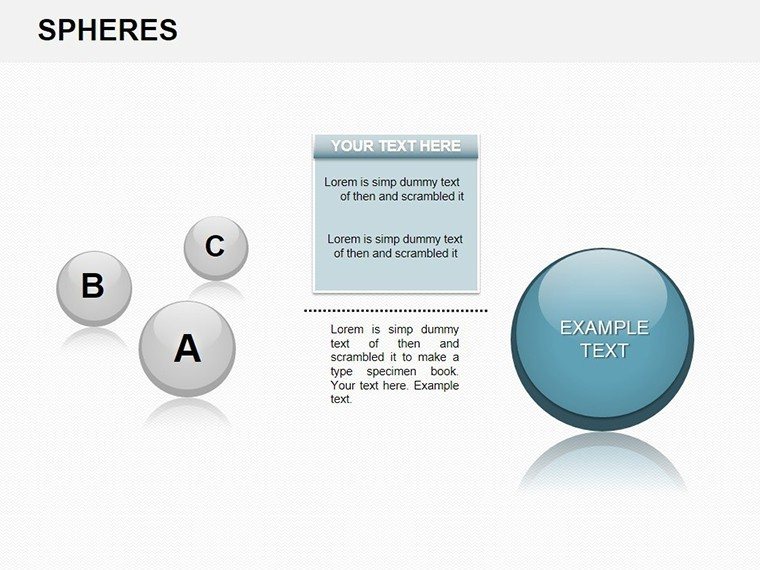
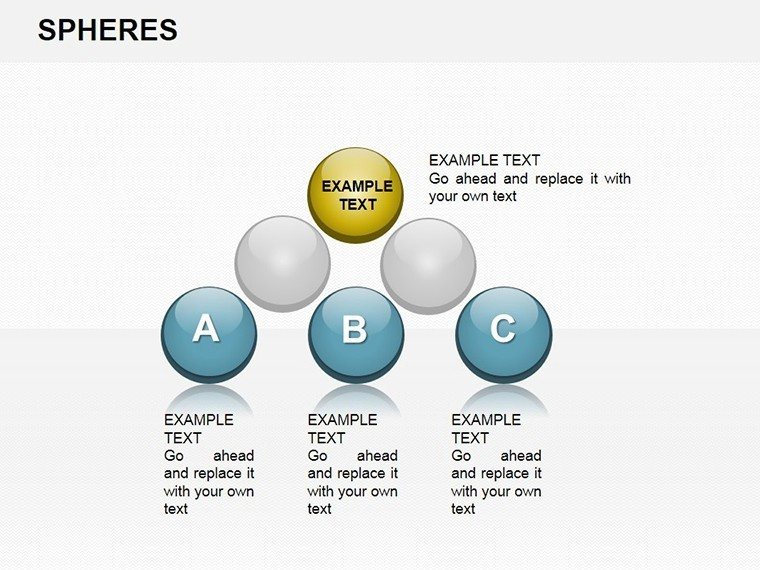
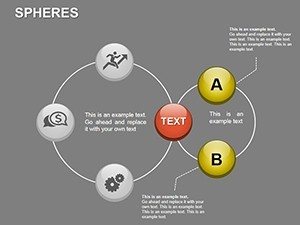
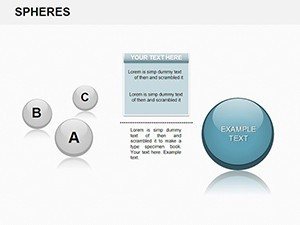
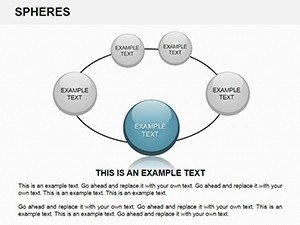
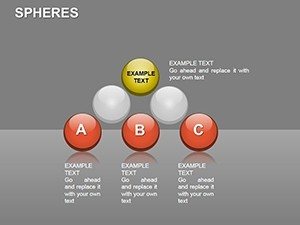
Sphere charts aren't just pretty - they're precise tools for showing how parts contribute to the bigger picture. In this template, you'll find variations from single spheres segmenting categories to clustered ones comparing datasets side by side. Each slide comes pre-loaded with placeholders for your figures, ensuring seamless integration whether you're pulling from Excel or jotting notes on the fly.
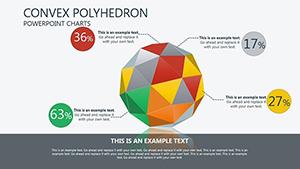
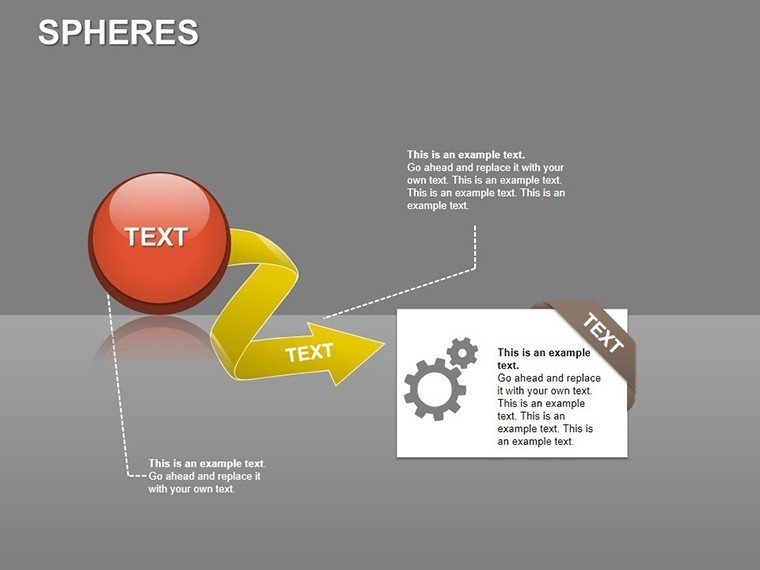
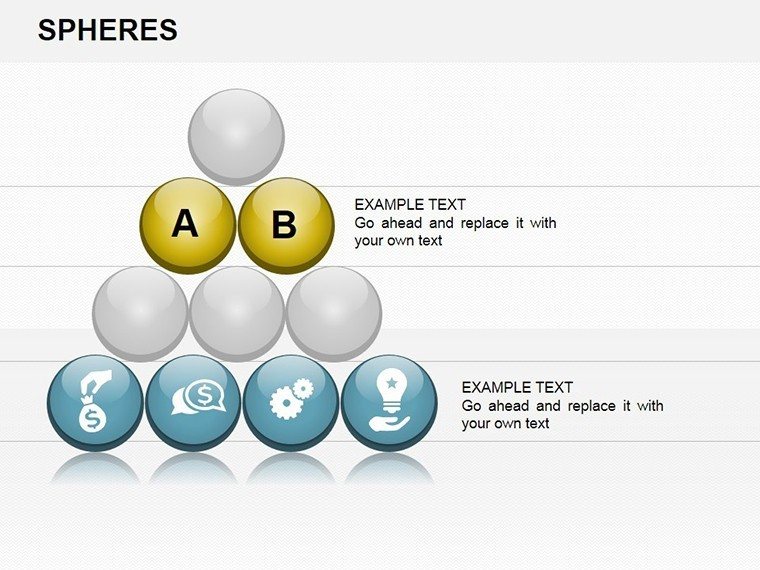
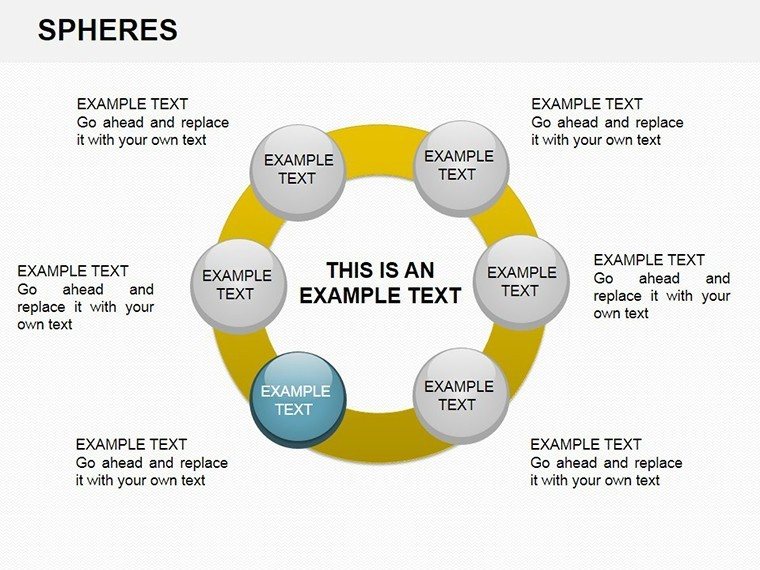
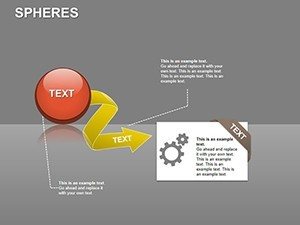
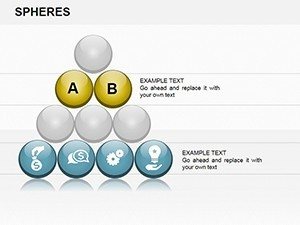
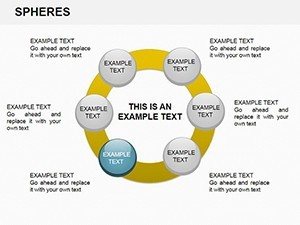
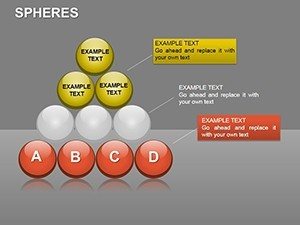
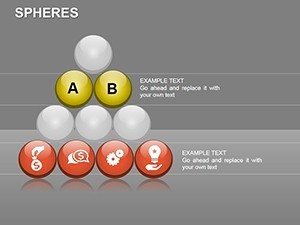
- Segmented Spheres: Divide a globe into slices for budget breakdowns, where each color-coded section reveals spending priorities at a glance.
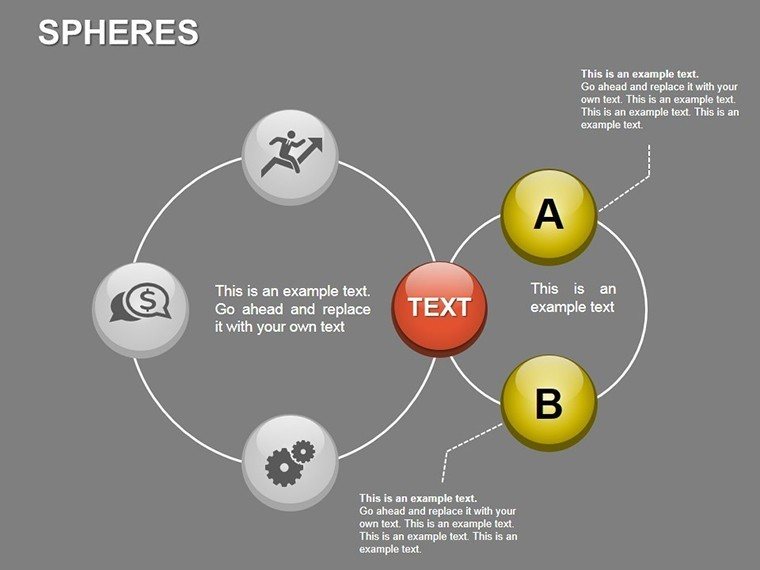
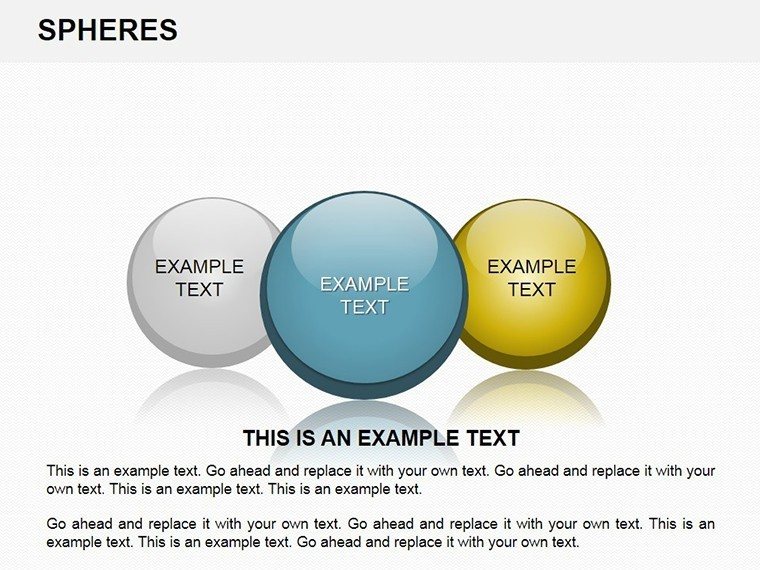
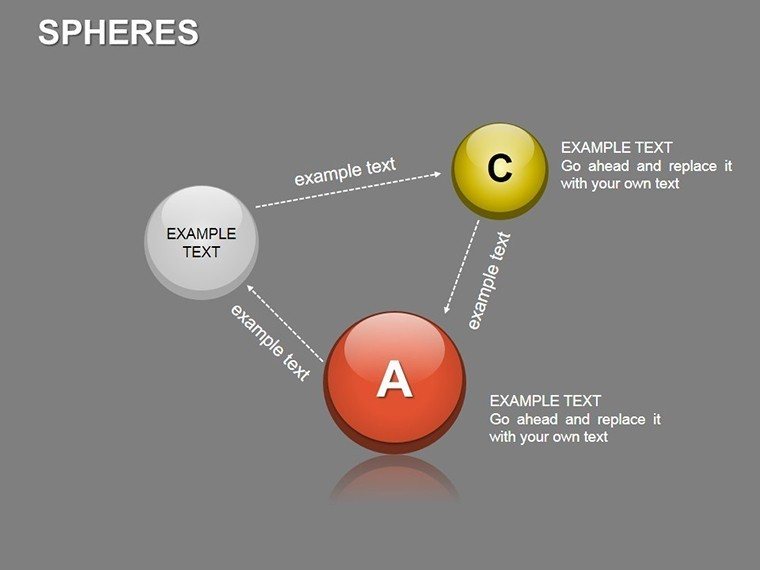
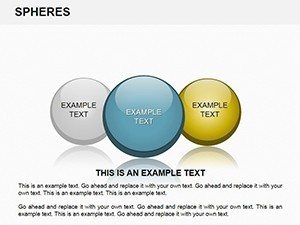
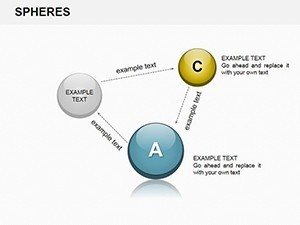
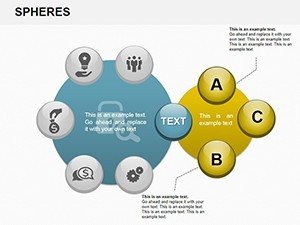
- Overlapping Orbs: Layer multiple spheres to contrast performance metrics, like sales regions overlapping to show shared influences.
- Animated Expansions: Build in subtle rotations that reveal inner details, perfect for unveiling layered analyses during live talks.
Customization flows naturally: tweak colors to match your brand palette, adjust transparency for depth effects, or resize segments to emphasize outliers. It's all vector-based, so no pixelation worries on high-res screens. For educators, this means turning abstract math into interactive models - picture a classroom where students manipulate sphere segments to grasp probability distributions hands-on.
Step-by-Step: Building Your First Sphere Chart
- Import Data: Copy-paste your values into the slide's table; the template auto-generates the sphere proportions.
- Refine Aesthetics: Select a segment, hit the format tab, and swap fills or add glows for that extra pop.
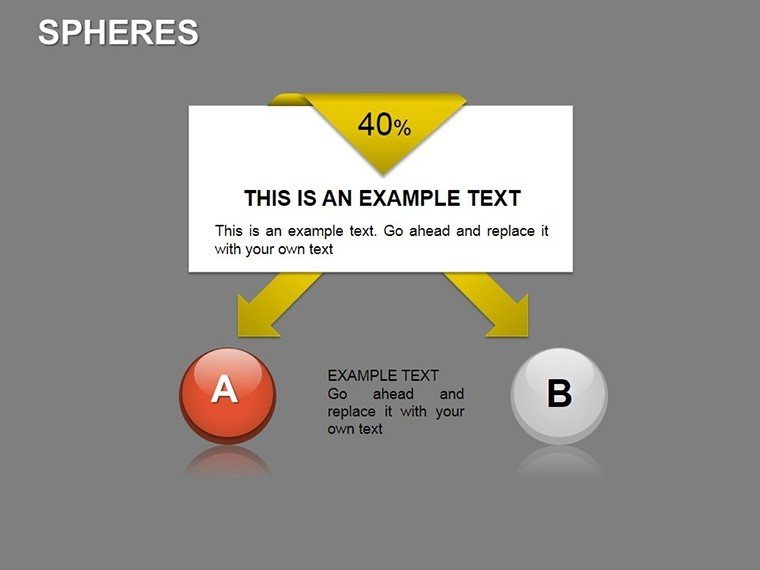
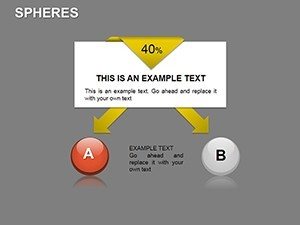
- Add Context: Layer in text boxes for legends or callouts, linking back to your narrative - say, "This 40% slice drove last quarter's surge."
- Test Flow: Preview in slideshow mode to ensure animations sync with your speaking pace, then export to PDF for handouts.
This workflow turns novices into pros, especially when integrating with tools like Visio for more intricate links. Business analysts appreciate how spheres sidestep the linearity of bar graphs, offering a holistic view that's easier to digest in boardrooms.
Real-World Applications That Resonate
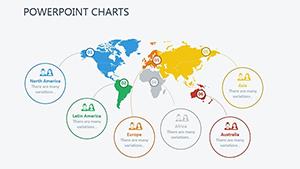
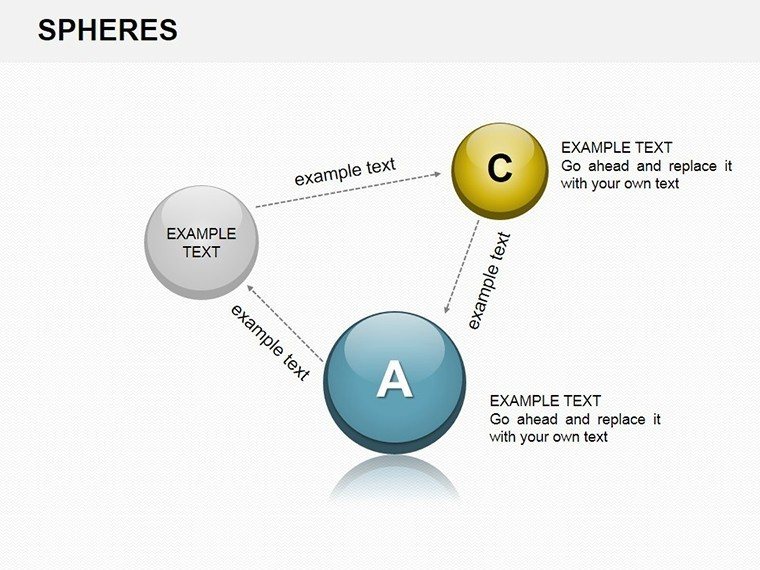
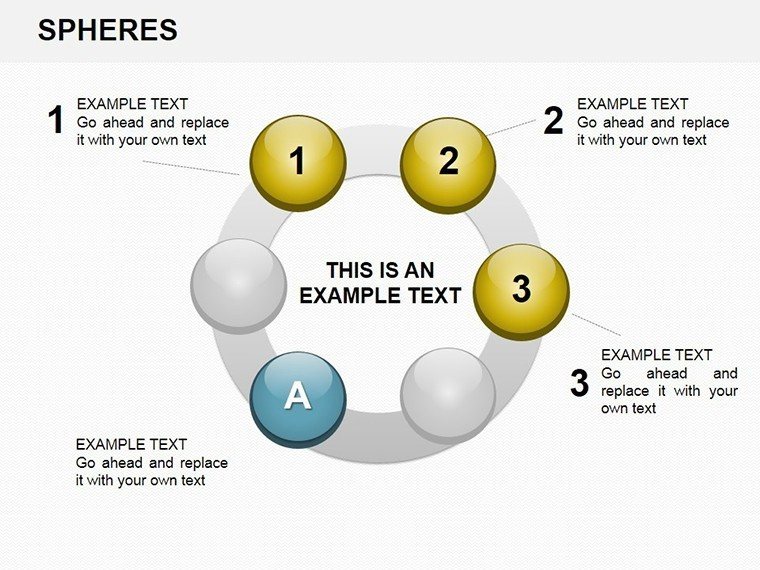
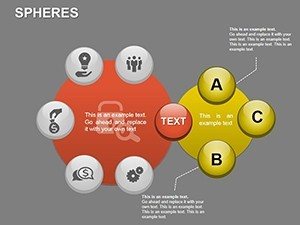
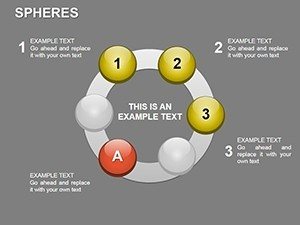
Take a marketing team prepping a campaign recap: Use a central sphere for overall ROI, with orbiting ones for channel breakdowns - email, social, PPC - each pulsing to life as you discuss wins. Or in research, map survey responses across demographics, where sphere overlaps highlight consensus points, much like how environmental scientists visualize carbon footprints in global reports.
For educators, it's a game-changer in history lessons, segmenting timelines into era-based spheres to show cultural shifts without overwhelming linear clutter. The template's flexibility shines here, with blank canvases for custom icons or photos that ground data in real contexts. And for startups? Pitch decks become magnetic when funding needs orbit around revenue projections, pulling investors into your vision.
Compared to stock PowerPoint options, this template's spheres add that professional edge - think TED-level polish without the design degree. Users often pair it with timeline add-ons for hybrid slides, creating flows that guide audiences from overview to deep dives effortlessly.
Tips for Maximum Impact
Keep segments to five or fewer for quick reads; use contrasting hues for accessibility. In diverse audiences, narrate the 'why' behind each sphere - don't let visuals stand alone. For virtual meetings, leverage the 3D effect in Zoom shares to combat screen fatigue, ensuring your message lands even through pixels.
Why This Template Stands Out in Your Toolkit
Beyond the visuals, it's the thoughtful details: SmartArt integration for easy expansions, theme-consistent fonts for cohesion, and print-ready exports for hybrid events. At $20, it's an investment in clarity that pays off in every nod of agreement from your crowd. Whether refreshing annual reports or workshop materials, these spheres make data feel alive, approachable, and actionable.
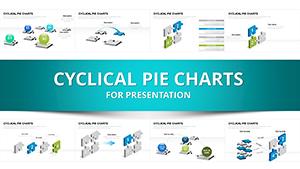
Dive deeper with related cycle templates for fuller narratives, or stick to spheres for punchy standalones. The choice is yours - start orbiting success today by downloading and experimenting with your next dataset.
Frequently Asked Questions
Are these sphere charts fully editable in PowerPoint?
Yes, every element from segments to labels is adjustable using standard PowerPoint tools, no add-ons required.
Can I use this template for non-business presentations?
Absolutely - it's versatile for education, research, or personal projects, with layouts that adapt to any theme.
Does it support animations for the spheres?
Built-in entrance and emphasis effects are included, customizable to fit your pacing and style.
What file formats are available?
Download as .pptx for PowerPoint, with options to save as PDF or image sequences for versatility.
Is it compatible with Google Slides?
While optimized for PowerPoint, it imports well into Google Slides with minor animation tweaks.