Fully Editable Interlinked Chain Process Flow PowerPoint Template - Instant Download


Type: PowerPoint Charts template
Category: Process
Sources Available: .pptx
Product ID: PC00192
Template incl.: 16 editable slides
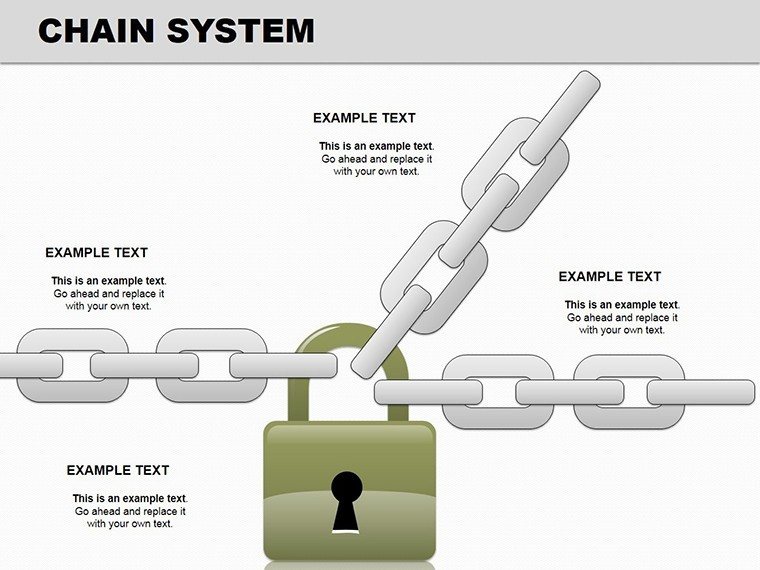
The Chain System PowerPoint Charts Template solves a critical presentation challenge: how do you visually connect sequential steps in a process so stakeholders instantly grasp dependencies, bottlenecks, and flow logic?
Whether you're presenting supply chain operations to executives, mapping customer journey touchpoints for marketing teams, or documenting standard operating procedures for training sessions, disconnected bullet points fail to show how each phase influences the next. This 16-slide template transforms linear lists into visually linked process chains that guide audiences through complex workflows with clarity and precision.
Designed for operations managers, process consultants, project coordinators, and business analysts, these interlinked chain diagrams use interconnected node structures to represent workflows where each step builds upon or triggers the previous one. The visual metaphor of linked chains immediately communicates dependency relationships - critical when explaining manufacturing sequences, approval hierarchies, or multi-stage service delivery models.
Key Features
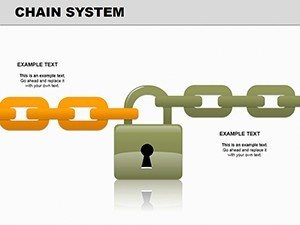
- 16 unique, fully editable slides in .pptx format
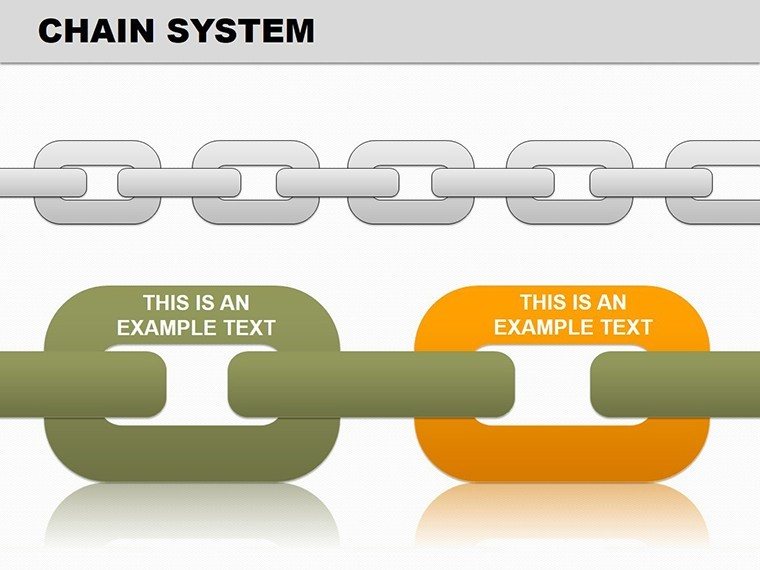
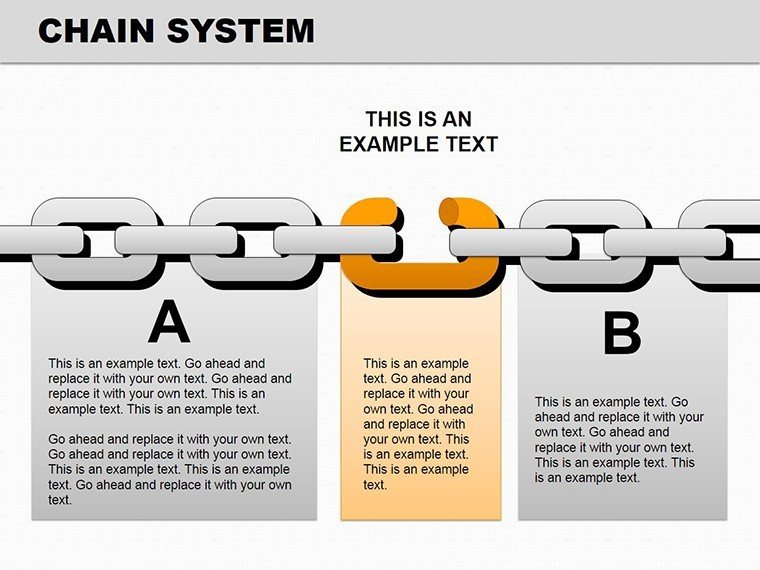
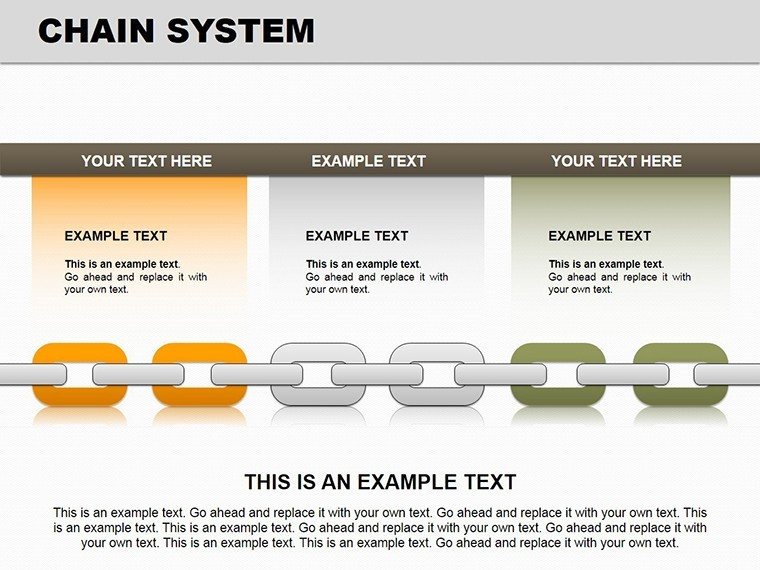
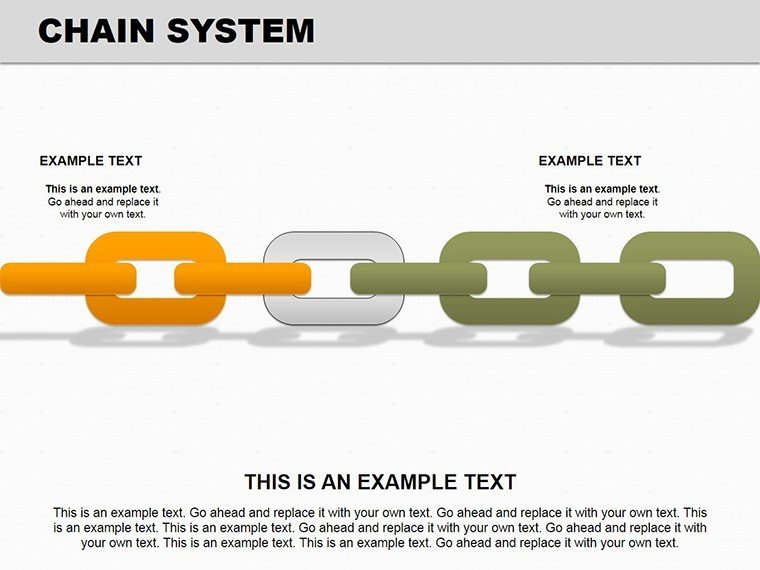
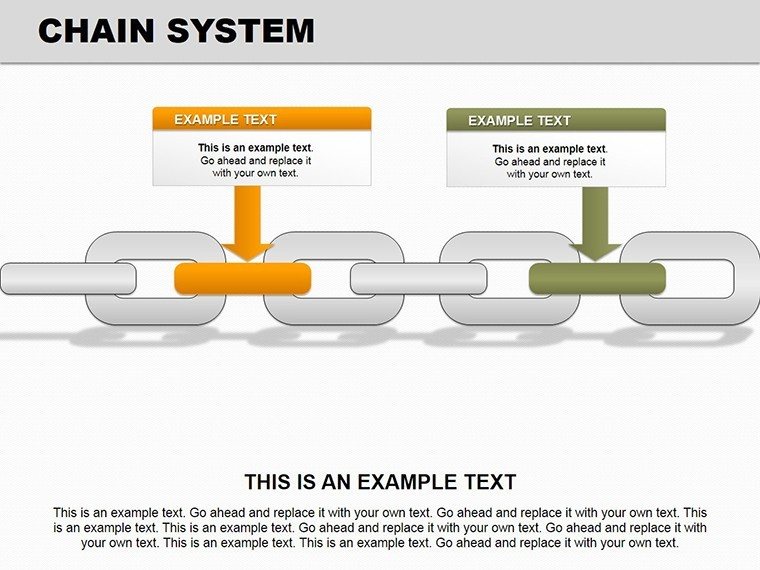
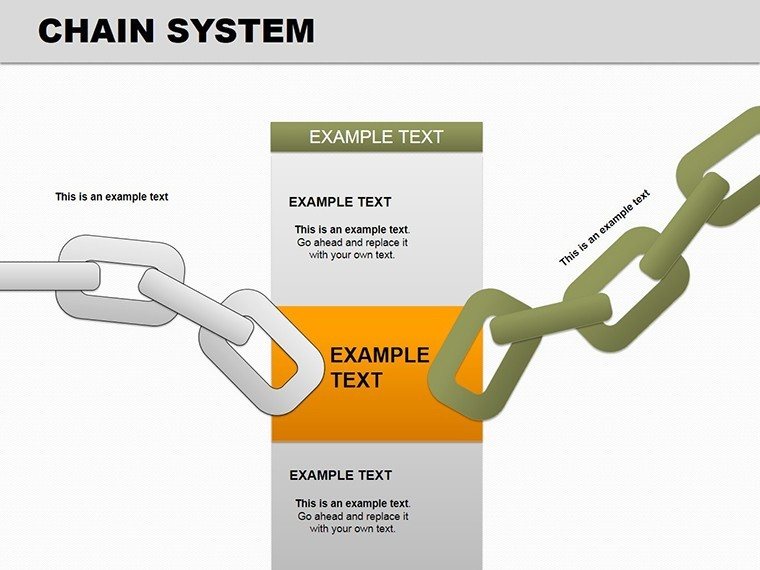
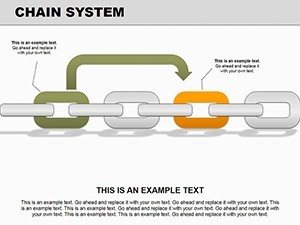
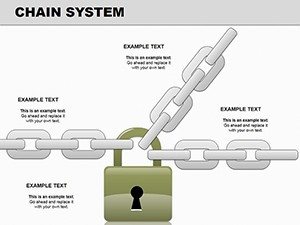
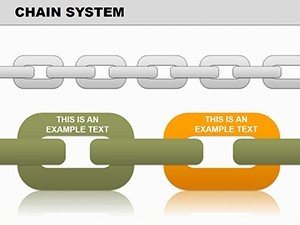
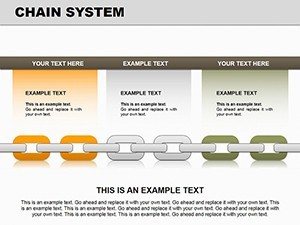
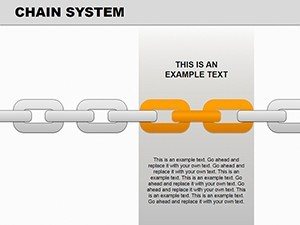
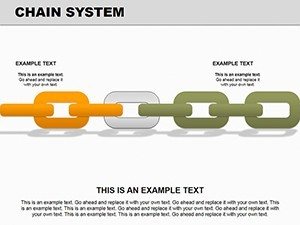
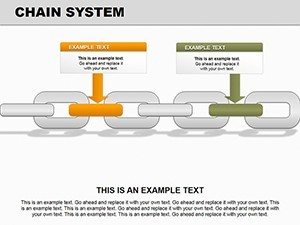
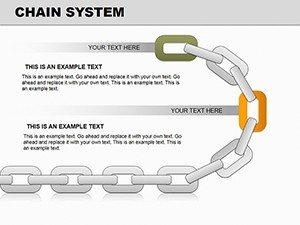
- Horizontal linear chains (3 - 7 links) for sequential timelines and simple processes
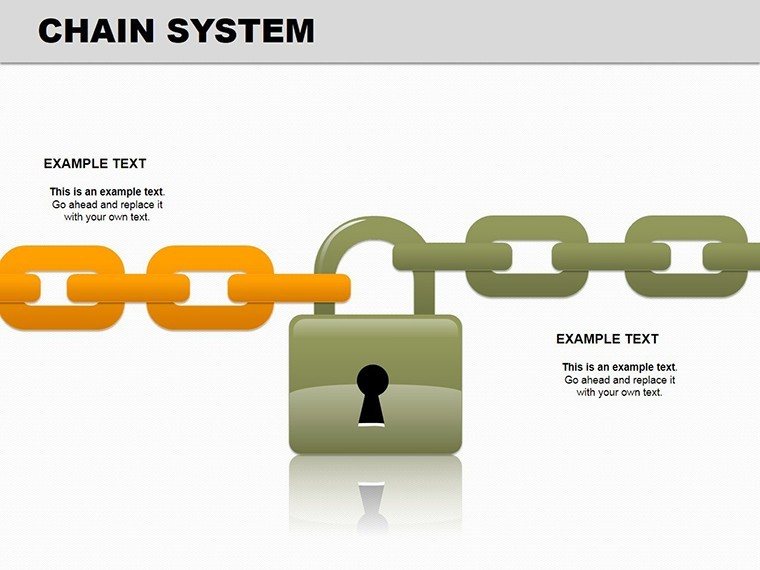
- Vertical and stacked chains for hierarchical approvals and reporting structures
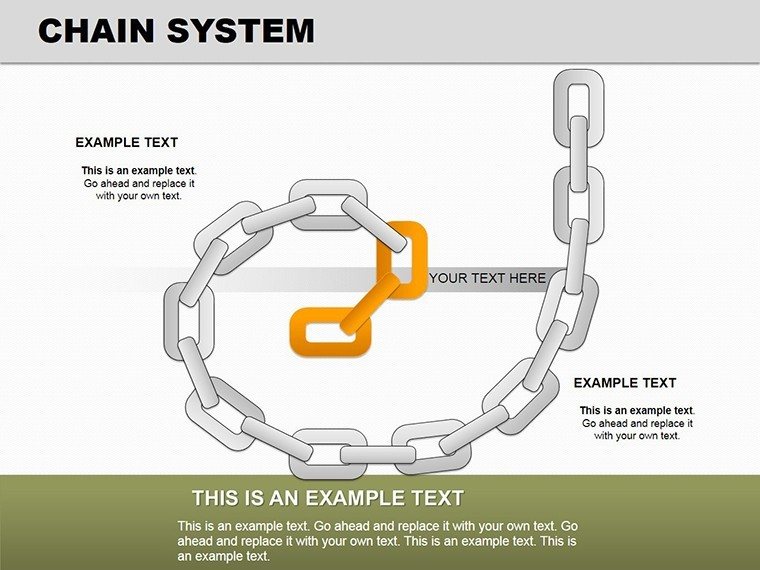
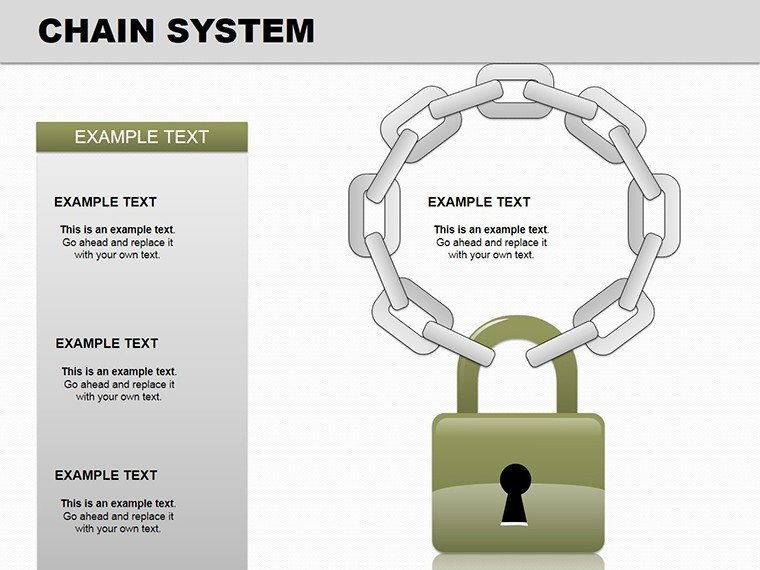
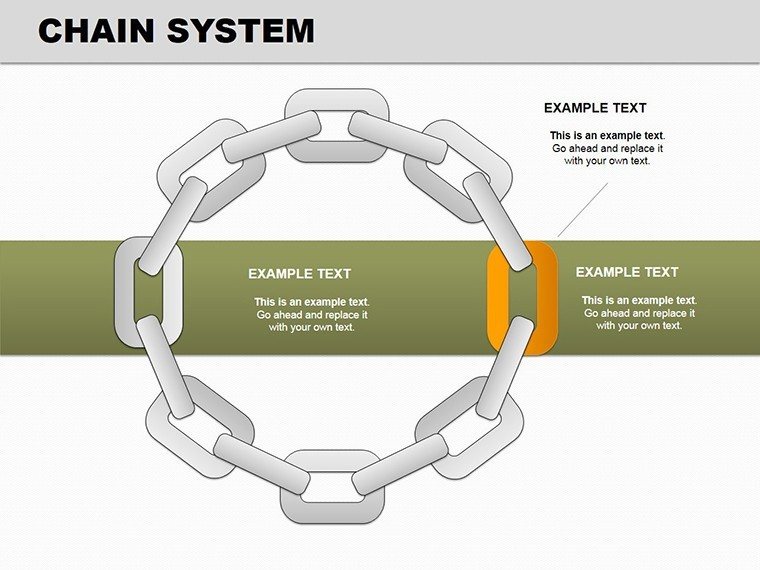
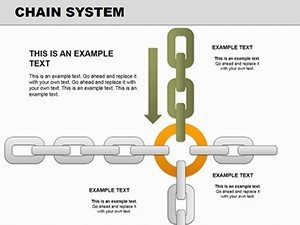
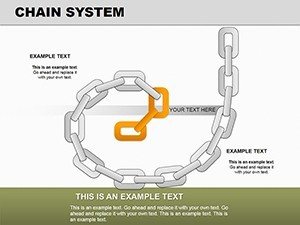
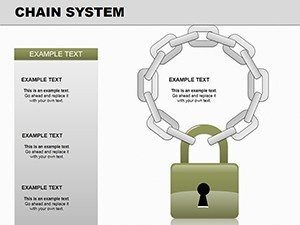
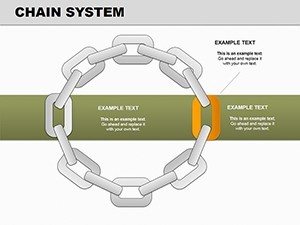
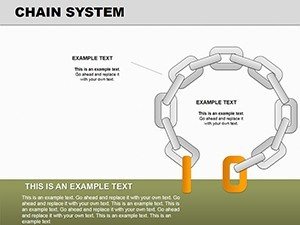
- Circular chain loops for continuous improvement and iterative cycles
- Branching chain structures for decision trees and multi-path workflows
- 100% vector shapes for crisp scaling and easy customization
- Neutral color palette with customizable accents to match your branding
Professional Scenarios Where This Template Excels
Use these interlinked chain diagrams when sequence and dependency matter most. Operations directors rely on them during quarterly reviews to demonstrate process improvements to executives. Process consultants build workflows collaboratively in ISO certification workshops. HR teams incorporate them into onboarding materials to clarify new employee journeys.
In consulting engagements, highlight client process bottlenecks with branching chains. Manufacturing teams map procurement-to-distribution flows. Marketing departments visualize campaign stages from content creation to performance measurement. Project managers illustrate task dependencies where one delay impacts the next.
Elevate your next presentation with professional process visualization. Add this template to your cart for instant access to clearer, more impactful workflow communication.
How to Customize Your Chain Diagrams
Editing is straightforward in PowerPoint 2016 or later. Click any chain node to reposition, drag connectors to reroute paths, or use Format Painter for consistent styling. Text boxes support 2 - 3 lines per link - perfect for step labels plus brief notes or KPIs.
For recurring use, save your customized version as a .potx template. Animate individual links with entrance effects to reveal processes step-by-step during live presentations. Link text to Excel for dynamic updates in frequently changing workflows.
Frequently Asked Questions
What software is required to edit this template?
The template is native to Microsoft PowerPoint (.pptx) and works best in versions 2016 or later. It is also compatible with Google Slides and Apple Keynote, though minor connector adjustments may be needed.
How many slides and variations are included?
16 fully editable slides featuring horizontal linear chains (slides 1 - 4), vertical/stacked (5 - 8), circular loops (9 - 12), and branching decisions (13 - 16).
Are the chain diagrams fully customizable?
Yes - all elements are vector-based. Change colors, fonts, node sizes, text, and connector paths without quality loss. Ungroup and regroup shapes for advanced modifications.
What types of processes work best with chain diagrams?
Chain diagrams excel at linear sequential processes with clear dependencies, such as supply chains, approval workflows, customer journeys, manufacturing sequences, and onboarding procedures.
Can I animate the chain links during presentations?
Absolutely - select individual links or nodes and apply entrance animations to reveal the process step-by-step for greater audience engagement.
Ready to communicate complex processes with absolute clarity? Download the Chain System template today and transform your workflow presentations.