Spiral Analysis PowerPoint Charts Template
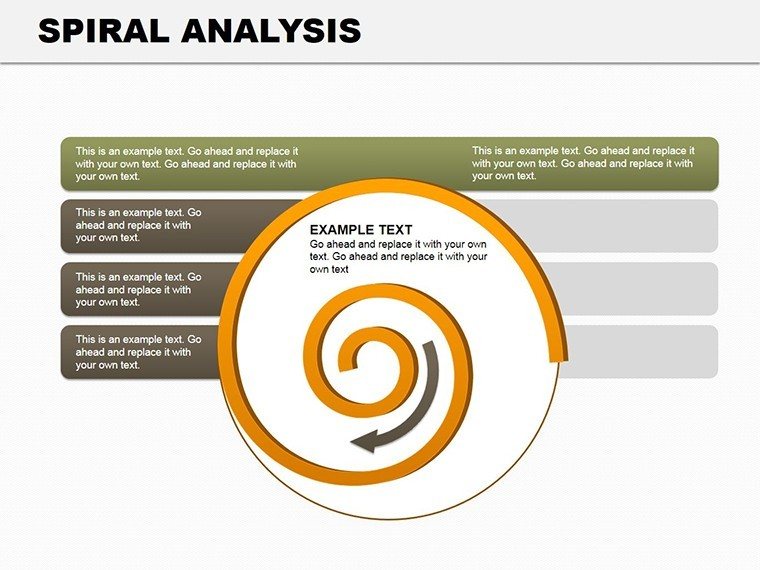


Let your data uncoil like a story unfolding, each turn building toward revelation. The Spiral Analysis PowerPoint Charts Template captures this essence in 18 editable slides, a boon for those decoding patterns in flux. Sales teams tracking seasonal swells, project leads charting phase evolutions, or analysts spotting financial loops will love how these spirals make sequences sing.
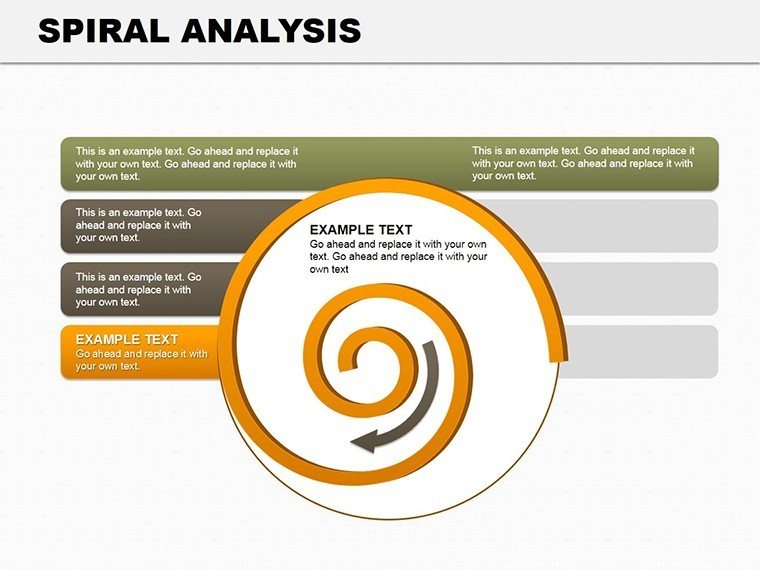
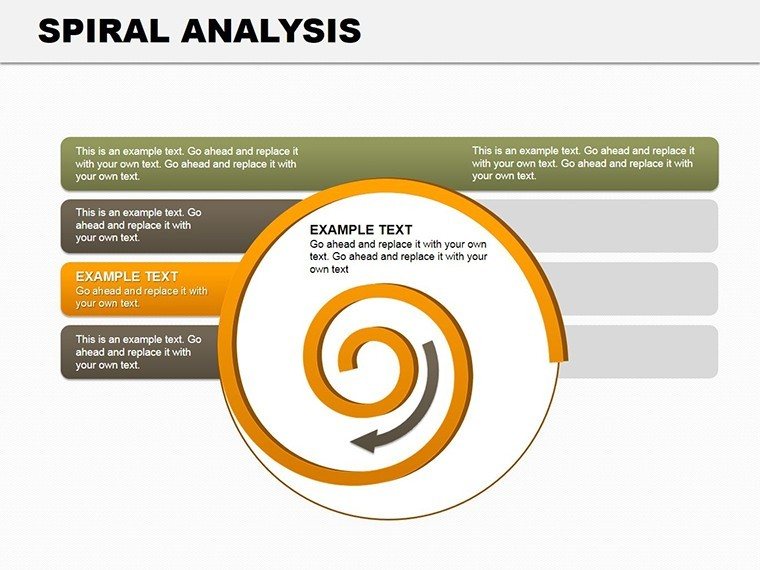
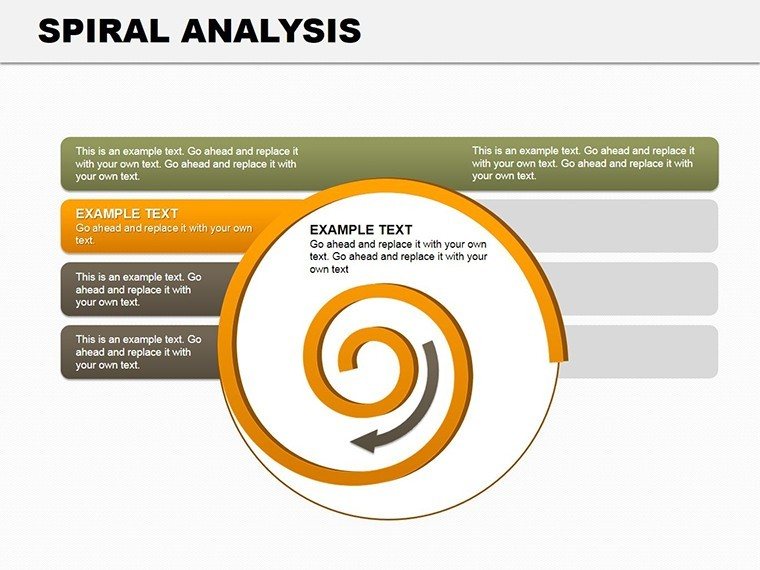
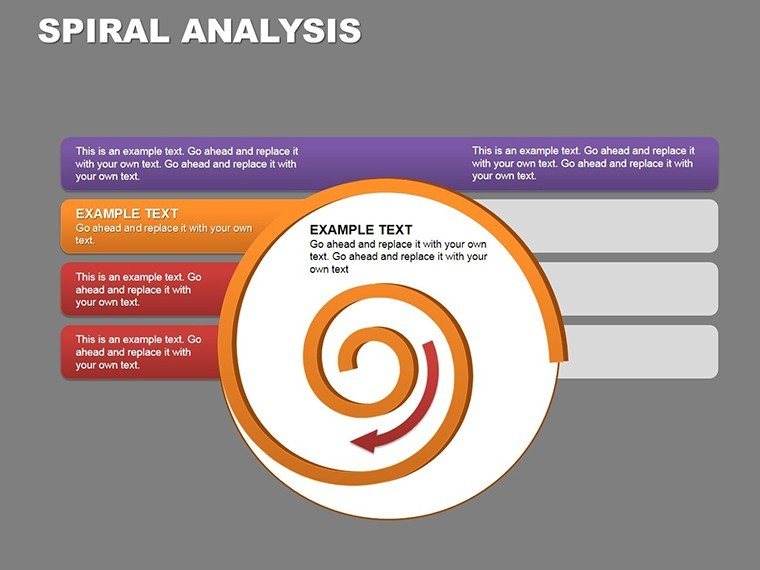
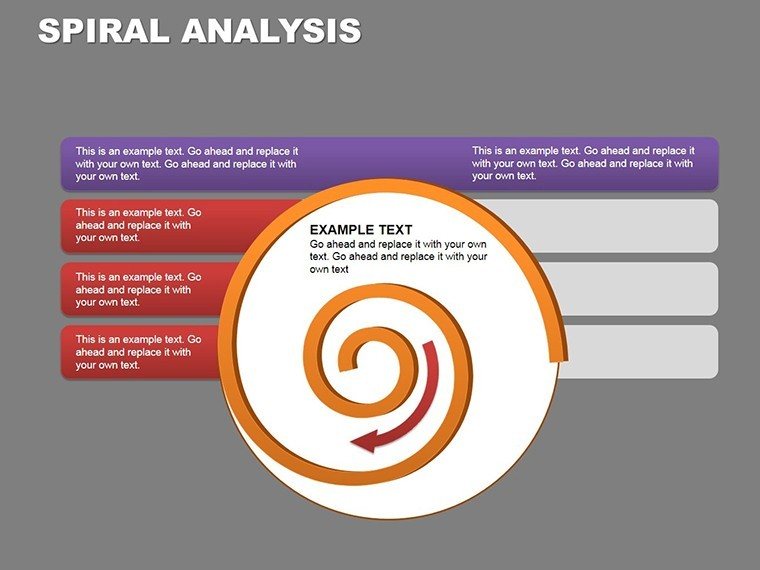
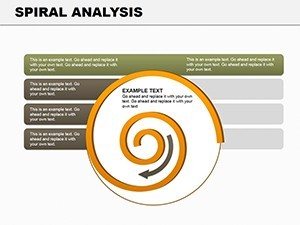
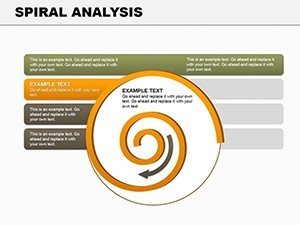
Rooted in cycle visuals, spirals here depict growth, decline, or repetition with elegant curves - far from the boxy confines of tables. They invite eyes to follow the path, uncovering correlations that straight lines miss, all while fitting neatly into broader decks. In fast-moving fields like healthcare or consulting, where trends twist unexpectedly, this template provides the twist that clarifies.
From PowerPoint 2016 onward, personalization is a breeze: stretch arms for emphasis, hue-shift for phases, or annotate coils with milestones. Financial planners echo its use in quarterly spirals, where revenue whorls highlight compounding effects, guiding reallocations with visual grace. If static charts leave you spiraling in frustration, this one's your anchor.
Twisting Data into Telling Tales
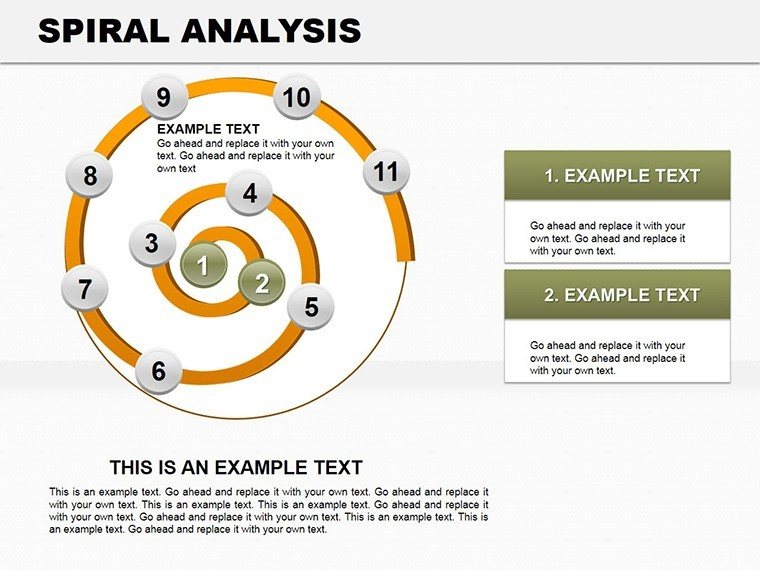
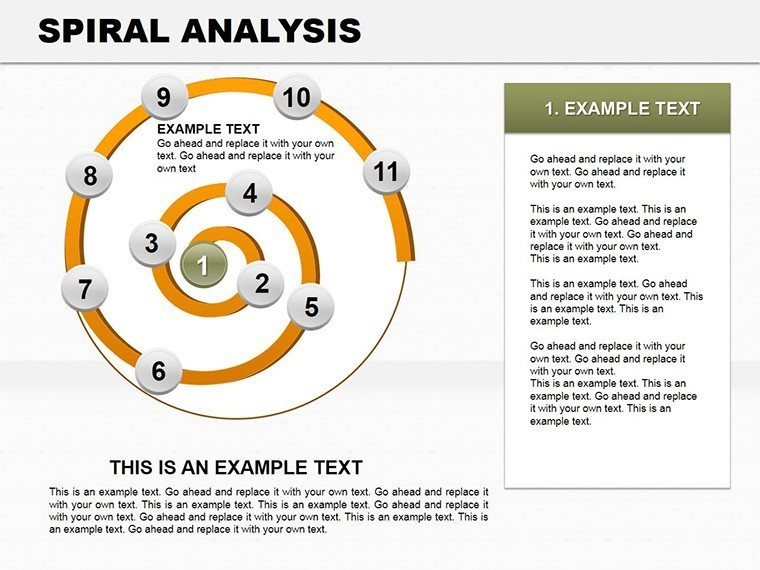
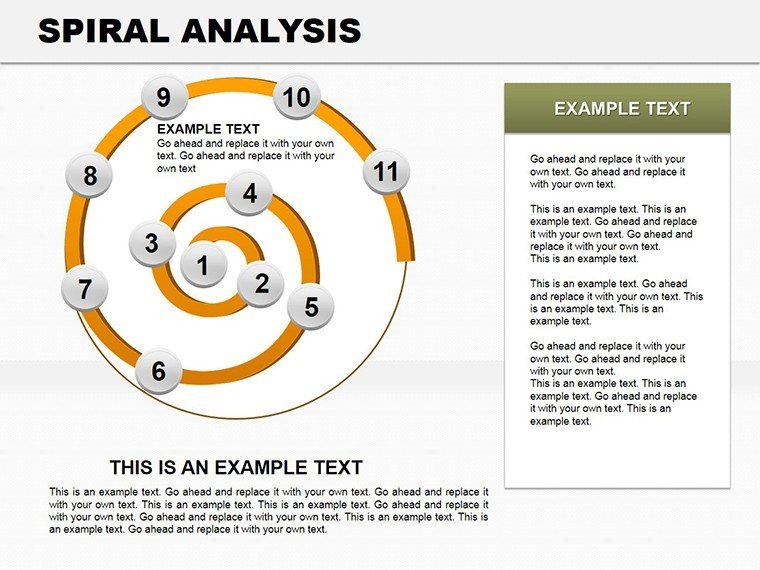
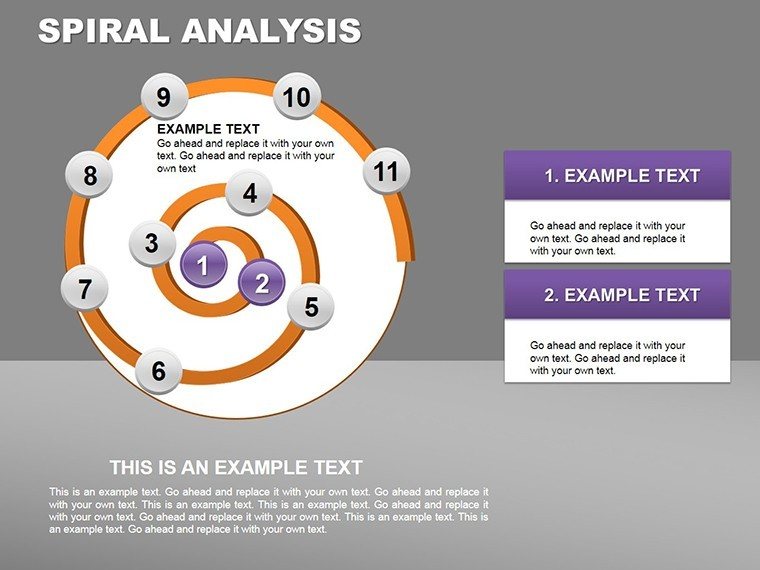
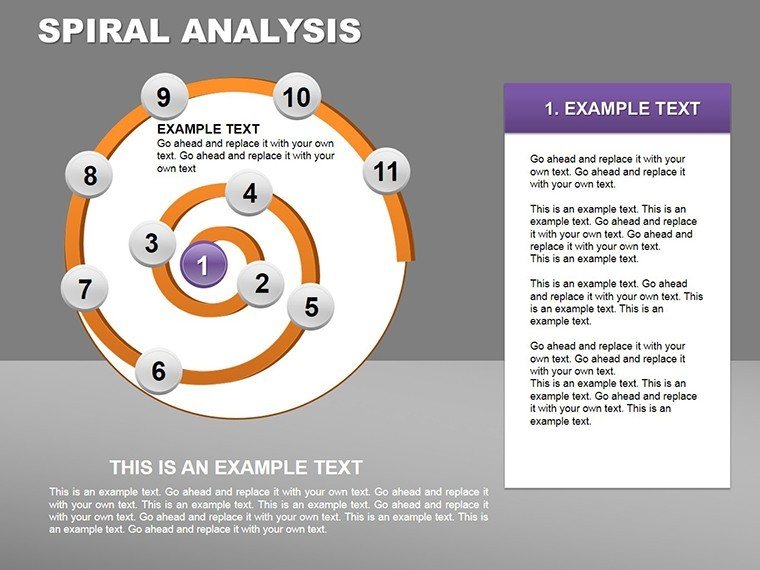
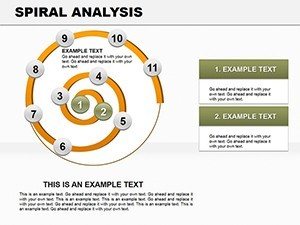
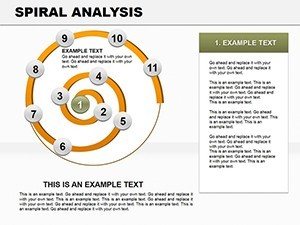
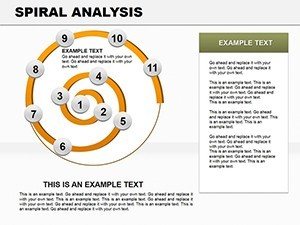
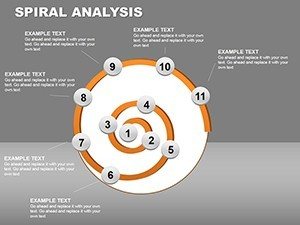
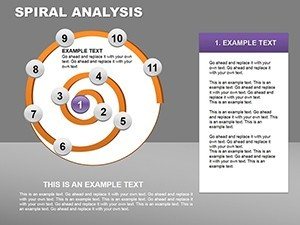
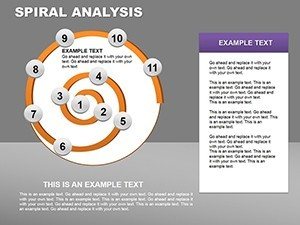
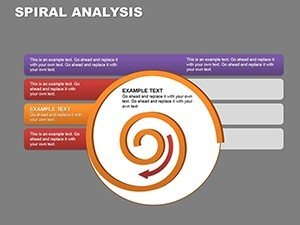
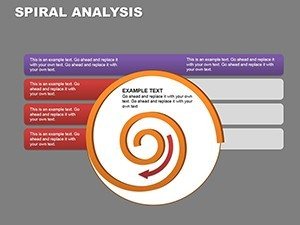
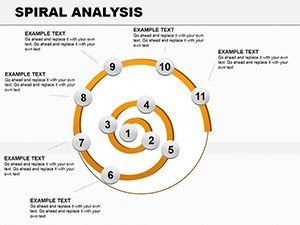
Spiral designs range from tight coils for micro-trends to expansive helices for long arcs, blending table precision with cycle flow. Crisp vectors hold up under zoom, supporting annotations that deepen without crowding.
- Upward Spirals: Ascending paths for success metrics, like user engagement building over campaign waves.
- Descending Coils: Inward turns for cost reductions, pinpointing efficiency gains per loop.
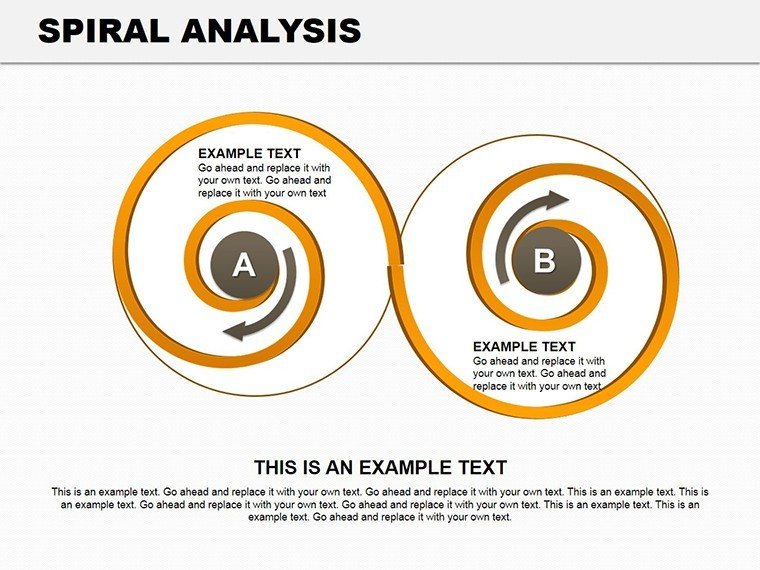
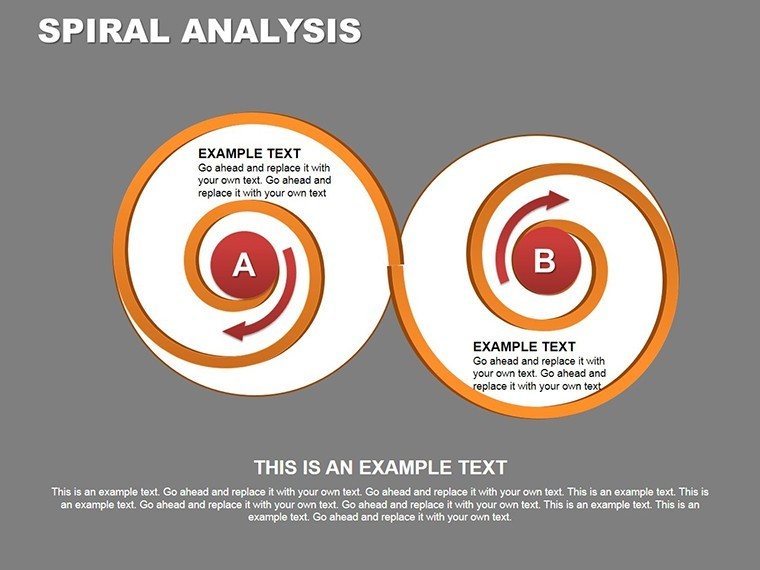
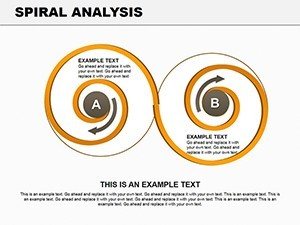
- Layered Helices: Multi-arm spirals comparing datasets, such as dual tracks for A/B test outcomes.
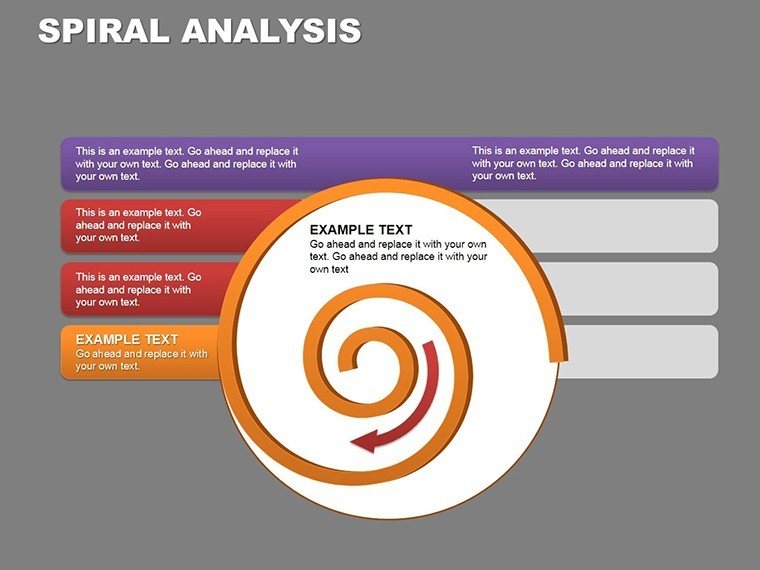
Flex it freely - elongate for timelines, cluster for matrices, or fade ends for focus. The cycle and tables categories enhance pairings, like embedding spirals in grid layouts for hybrid analyses.
Uncoiling Customization: Step by Spiral
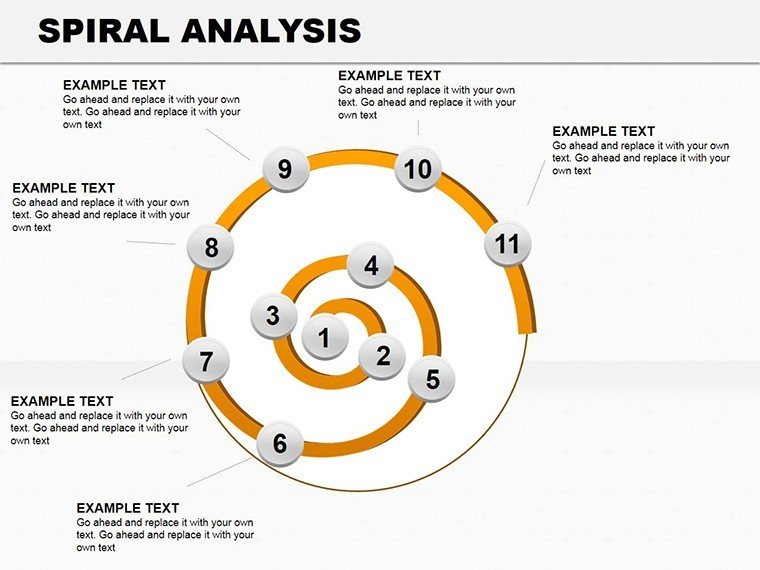
- Feed the Core: Enter sequence data; the spiral auto-forms, scaling to your range.
- Curve the Narrative: Grip an arm to bend or thicken, adding texture for categorical layers.
- Label the Loops: Pin notes at key bends, tying back to events - like "Peak from Q4 push."
- Harmonize the Helix: Preview rotations in slide show, syncing with gestures for immersive tells.
Such steps demystify for all levels, especially syncing with spreadsheets for dynamic refreshes. Against plain cycles, spirals infuse motion, turning data into journeys that resonate emotionally.
Cycles That Spiral into Action
Project managers spiral phases to forecast completions, each coil compressing timelines for agile tweaks. In wellness tracking, spirals chart habit streaks, motivating with visible momentum. Marketers unwind launch impacts, where outer arms flare for viral spikes, informing next orbits.
For educators, historical spirals loop eras, revealing recurring themes without chronological rigidity. The template's lightness aids quick pivots in workshops, where live edits keep energy high. Merge with process visuals for sequenced depths, crafting decks that evolve with your points.
Spiral-Specific Insights
Keep spirals to four loops max for scannability; opt for warm tones on ascents. Guide viewers along the path with pointers, amplifying the unwind effect. Digitally, they captivate in shared screens, as the curve counters square fatigue.
The Coil That Captivates
Highlights? Personal-commercial licensing, broad compatibility, and intuitive guides per file. At just $12, it's a low-risk whirl into superior storytelling. Spiral onward with table complements for grounded expansions, or pure-form for elegant solos.
Time to twist toward triumphs - download and let your data spiral free.
Frequently Asked Questions
How editable are the spiral arms?
Completely - resize, recolor, and reshape each segment via PowerPoint's shape tools.
Suitable for financial trend tracking?
Ideal, with layouts tuned for revenue cycles and expense patterns over periods.
Can I add multiple spirals per slide?
Yes, duplicate and align for comparisons, maintaining clean spacing.
Compatible with older PowerPoint?
Best on 2016+, but basics work on earlier with reduced animations.
Does it include table integrations?
Yes, hybrid slides blend spirals with tabular data for detailed backups.