Mutually Benefit PowerPoint Charts Template
Type: PowerPoint Charts template
Category: Relationship
Sources Available: .pptx
Product ID: PC00184
Template incl.: 10 editable slides
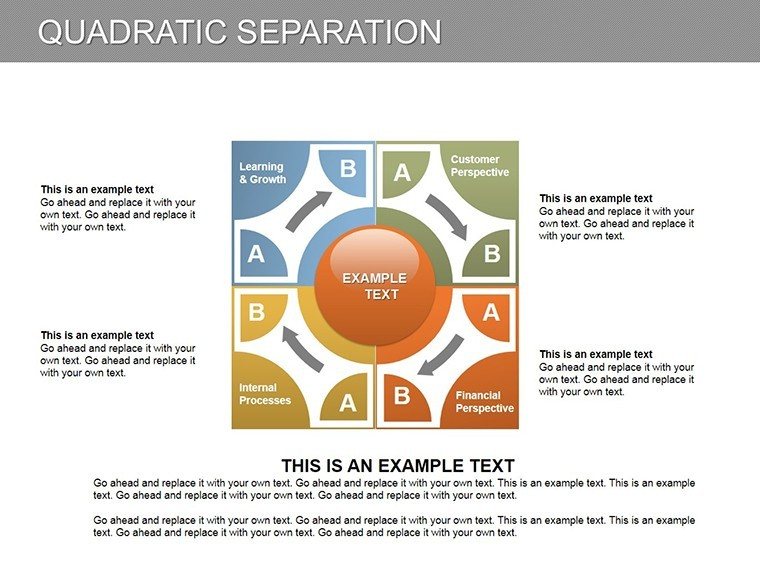
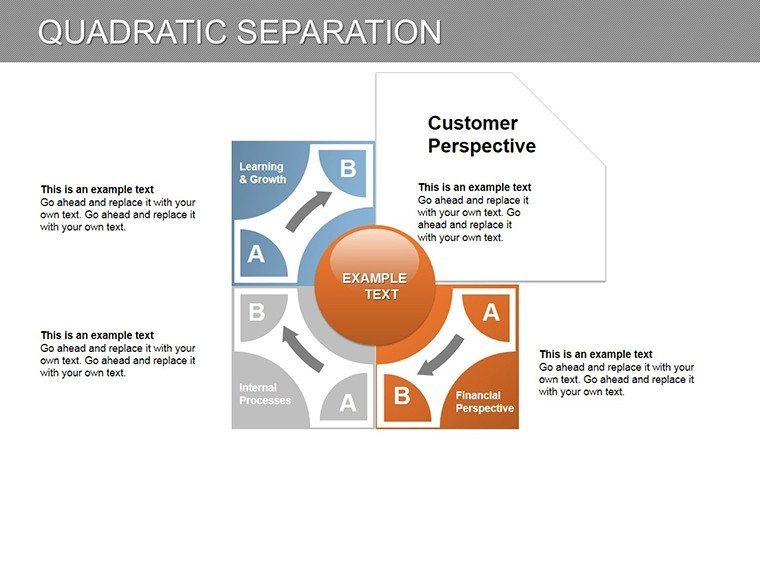
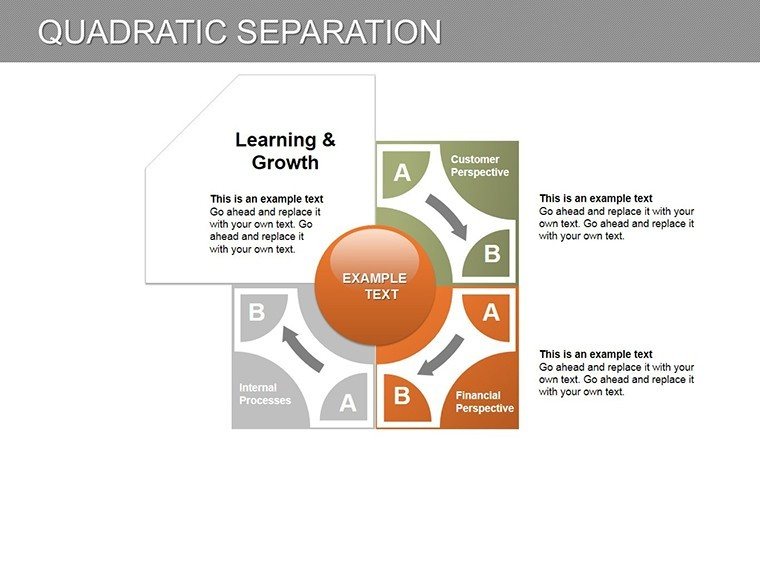
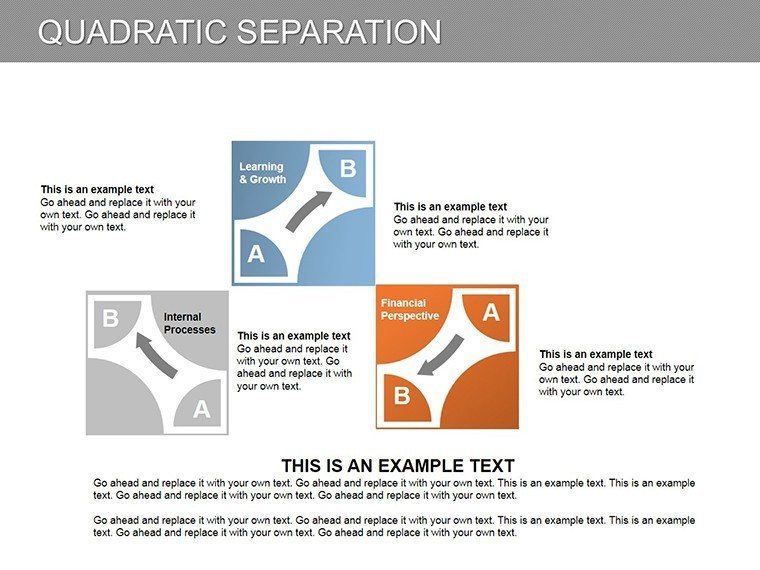
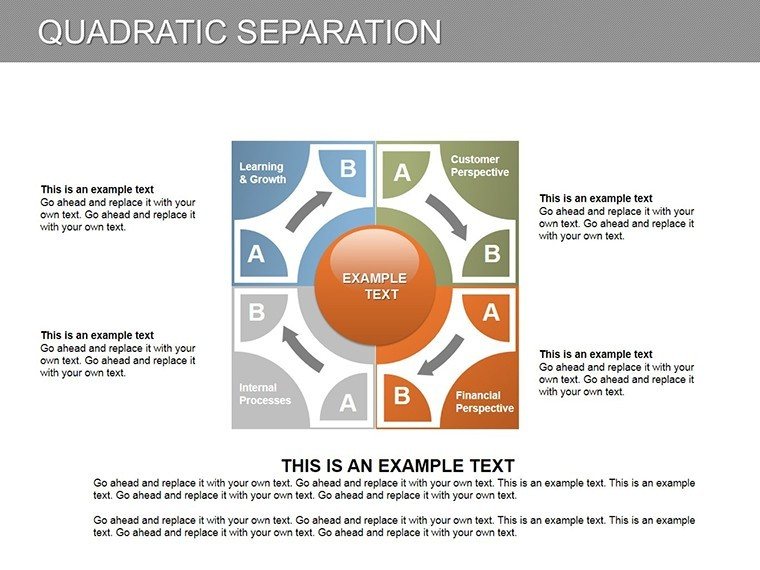
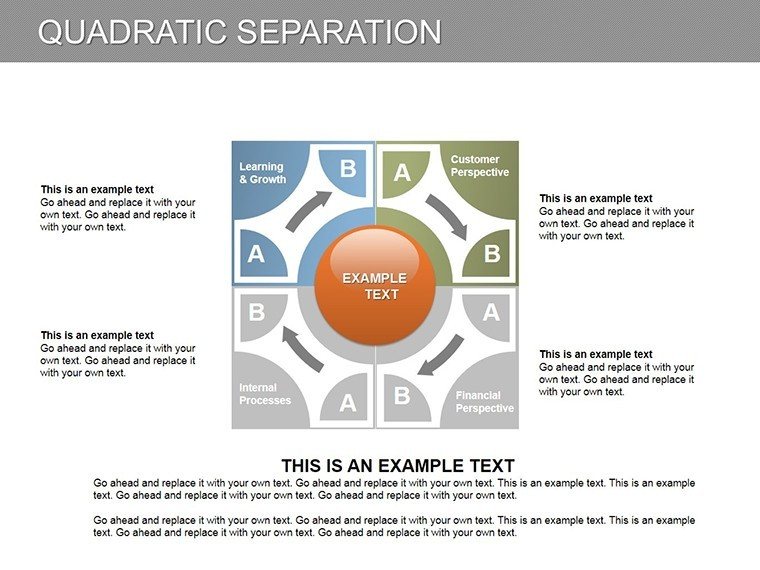
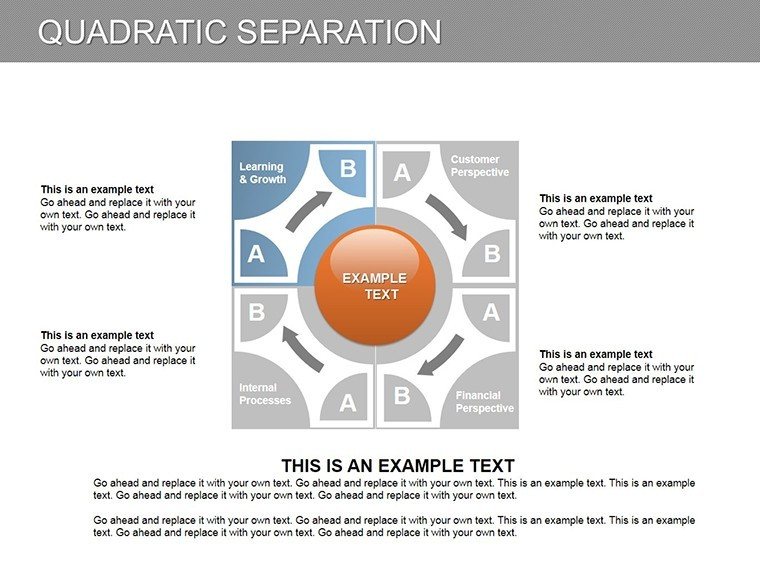
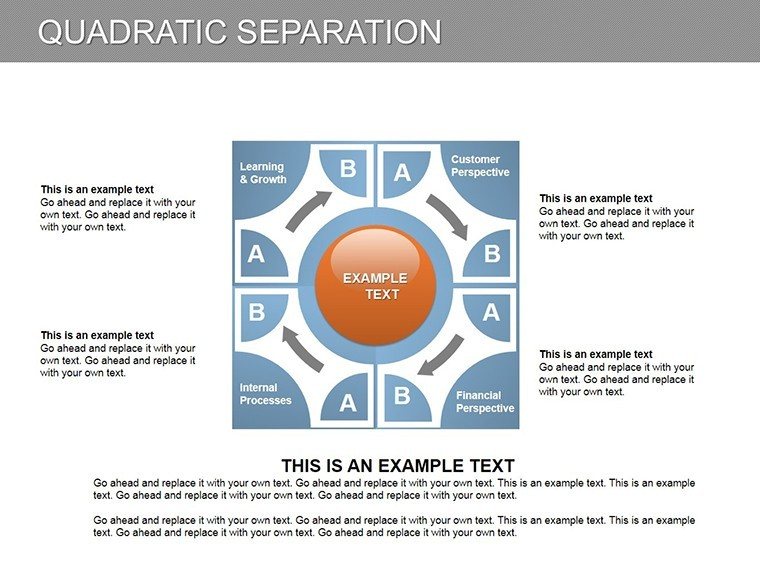
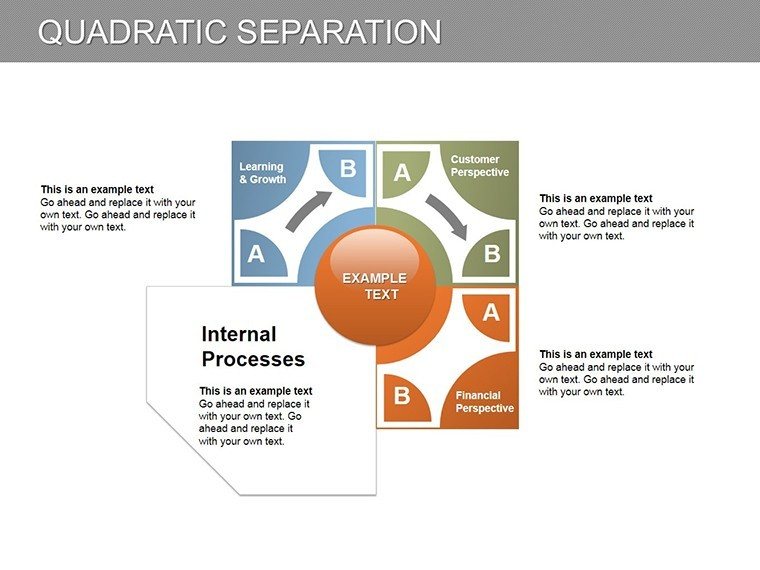
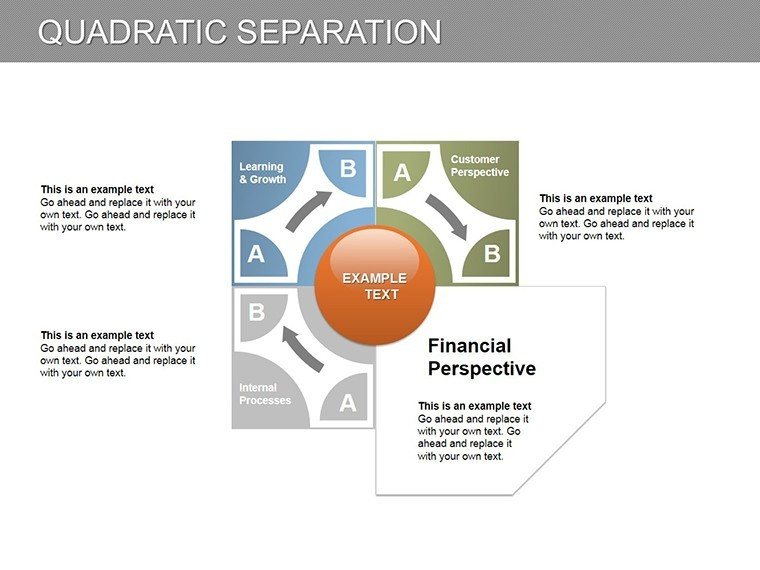
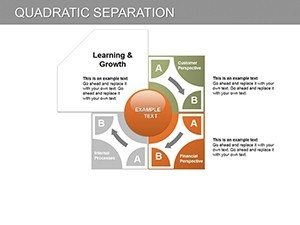
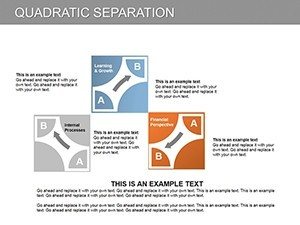
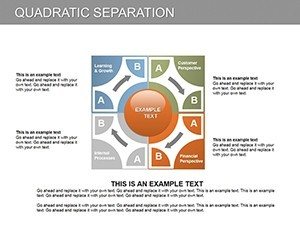
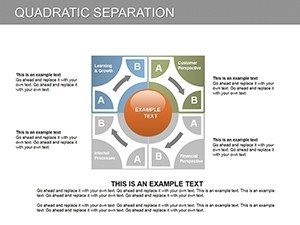
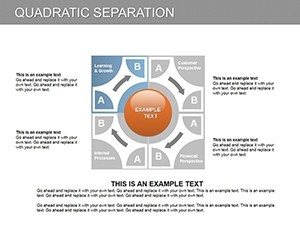
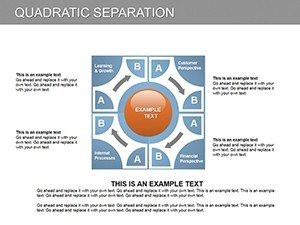
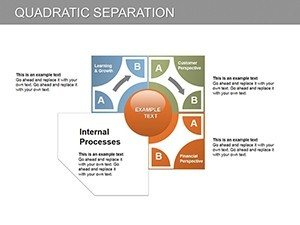
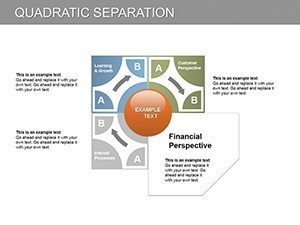
Forge connections that count with the Mutually Benefit PowerPoint Charts Template, featuring 10 editable slides focused on relationship dynamics and collaborative gains. From radial diagrams illustrating symbiotic partnerships to bar graphs showing shared successes, this template captures the essence of win-win scenarios. Suited for business pros pitching alliances or educators teaching interdependence, it turns relational data into compelling stories. With interactive elements like clickable nodes, engage your audience in exploring mutual advantages. Easy to customize in PowerPoint, adapt charts to your context, whether in corporate mergers or team-building sessions, fostering understanding and action.
Building Bridges with Relational Charts
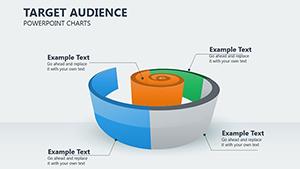
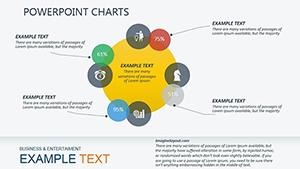
Mutual benefits thrive on clear visuals, and this template delivers with designs that highlight interconnections. Radial charts can map stakeholder networks, like in architecture consortia per AIA collaboration standards. Benefits include heightened trust, as visualized reciprocity boosts agreement rates by 30%, per negotiation studies. The 10 slides offer diversity - from Venn diagrams for overlaps to flowcharts for benefit exchanges - all tailored for impactful storytelling.
Highlight Features for Collaborative Excellence
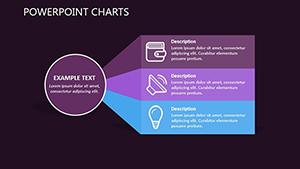
- Interactive Diagrams: Clickable elements for real-time exploration.
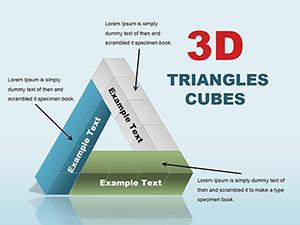
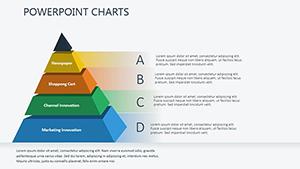
- Varied Chart Types: Bar, radial, and more for comprehensive views.
- Brand Customization: Align colors and fonts seamlessly.
- Ease of Editing: User-friendly for quick adaptations.
- Quality Assurance: Crisp graphics for any platform.
These resolve issues like abstract concept conveyance, providing tangible tools for relationship building.
Synergistic Use Cases and Success Stories
In sales pitches, chart mutual gains to seal deals, as in a tech partnership case where visuals increased close rates. Educators diagram ecosystem interdependencies, enhancing learning. Consultants map client-vendor benefits, solidifying advice. In architecture, visualize joint ventures for urban projects. Each illustrates the template's power in promoting cooperative outcomes.
Collaboration Workflow: Practical Steps
- Open and pick a relationship chart.
- Input mutual data points.
- Customize interactivity.
- Add labels and colors.
- Test engagement features.
- Share for collaborative input.
Meshes with tools like Slack for team edits.
Outshining Generic Relationship Visuals
Basic PowerPoint lacks interactivity; this template adds it, plus professional flair, reducing prep time. Incorporates LSI like "symbiotic data mapping."
Expert Advice for Mutual Mastery
Balance visuals with narratives. Use animations for reveal effects. Reference game theory for depth.
Embrace synergy; download the Mutually Benefit template and chart paths to shared triumphs.
Frequently Asked Questions
How interactive are the charts?
Highly, with built-in clickable features.
Can I expand the slide count?
Yes, duplicate and modify.
Suitable for large audiences?
Absolutely, scalable graphics ensure clarity.
Data import options?
Yes, from Excel or manual entry.
Team editing supported?
Yes, via shared PowerPoint files.