Process Server Circular PowerPoint Charts


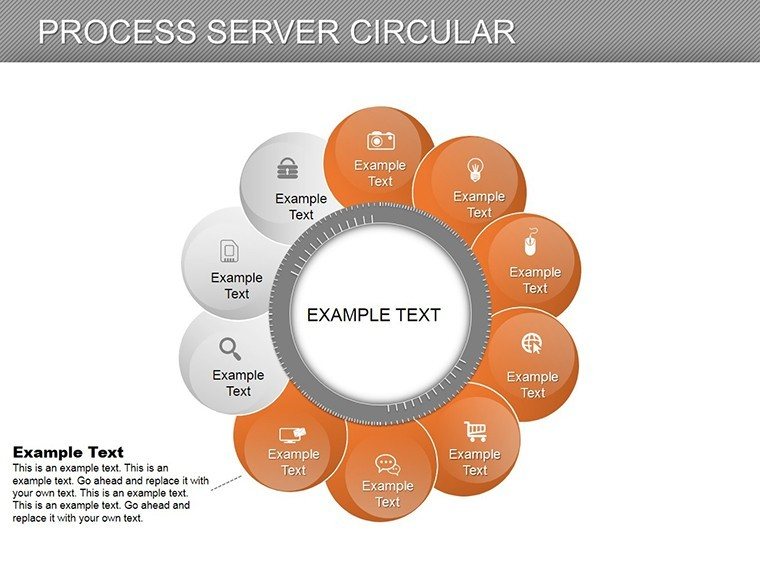


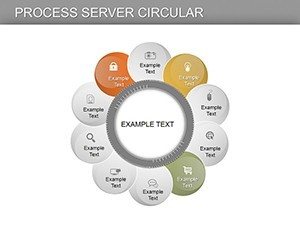
Navigate the complexities of processes with grace using our Process Server Circular PowerPoint Charts Template. Boasting 14 editable slides, this resource specializes in circular designs that excel at illustrating workflows, cycles, and hierarchies. Tailored for project managers, educators, and marketers, it tackles the challenge of conveying sequential data in a non-linear, engaging format. Circular charts provide a holistic view, making it easier to spot connections and efficiencies. Benefits include streamlined communication, heightened professionalism, and audience captivation - ideal for transforming dense information into digestible visuals. Whether mapping IT processes or teaching business models, this template equips you to present with confidence and clarity.
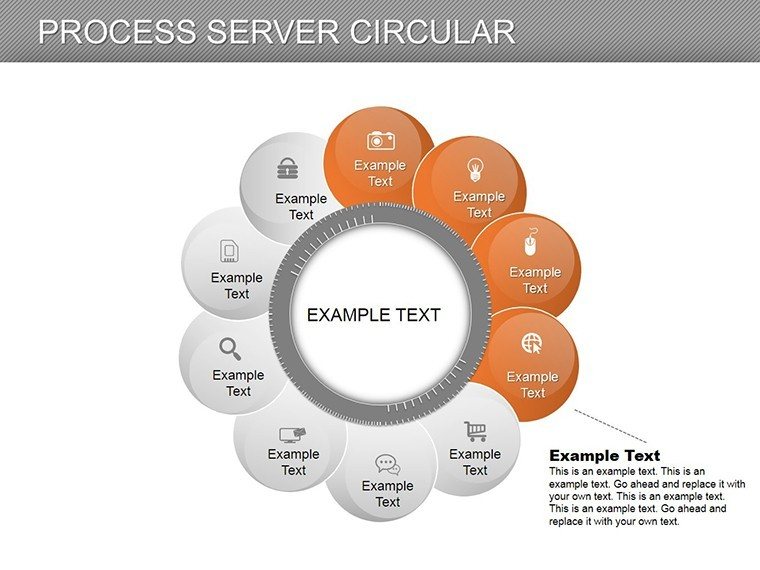
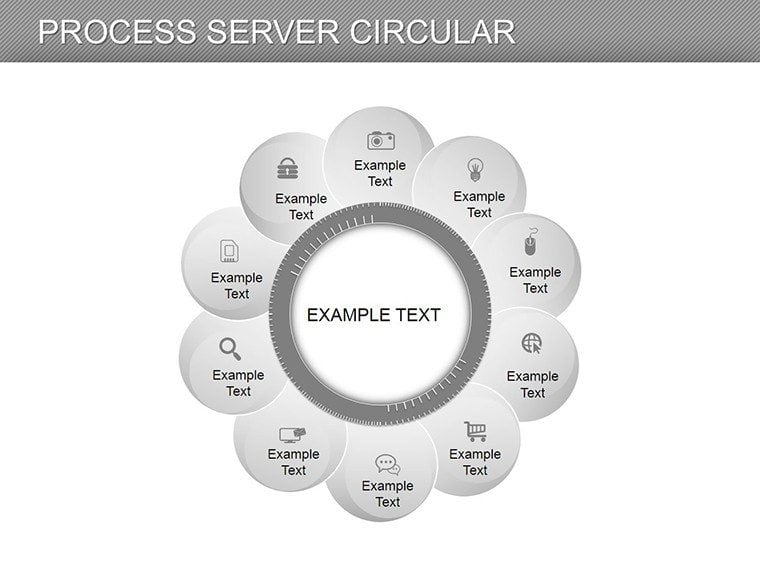
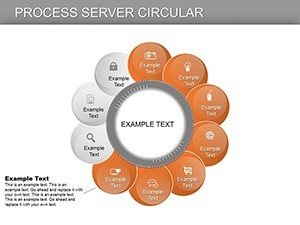
Harnessing Circular Designs for Process Excellence
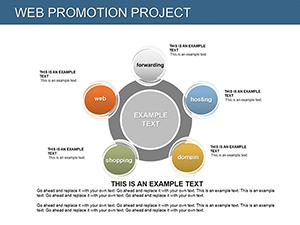
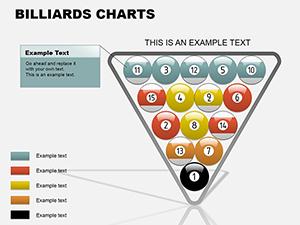
Circular charts shine in depicting continuity, like server workflows in tech or feedback loops in quality control. Customize styles to highlight phases, with colors denoting urgency or status. This surpasses linear timelines by offering a 360-degree perspective, as endorsed by visualization experts in fields like operations management. For instance, use them in project updates to show iterative developments, aiding teams in identifying bottlenecks. Educators can illustrate economic cycles, fostering interactive discussions. The template's ease of use means quick adaptations, integrating with tools like Excel for data pulls.
Core Features Enhancing Your Visual Toolkit
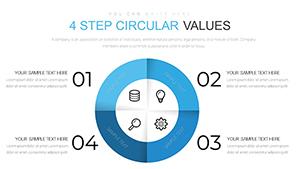
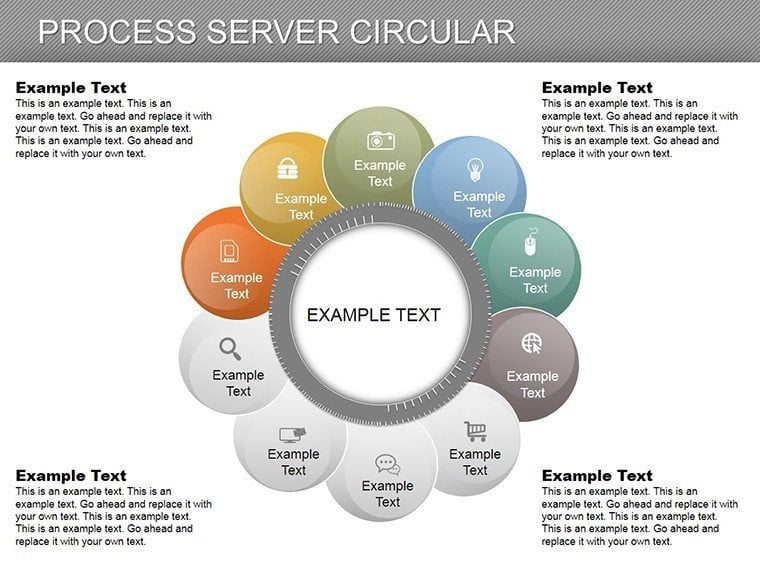
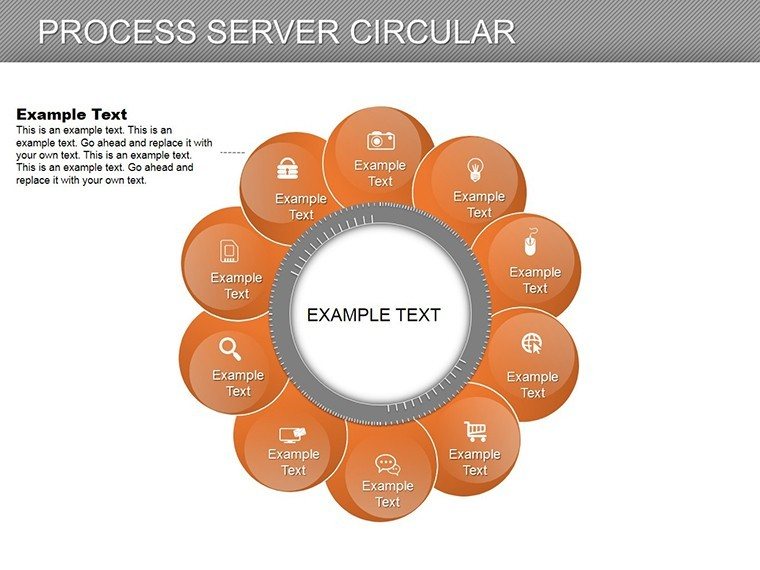
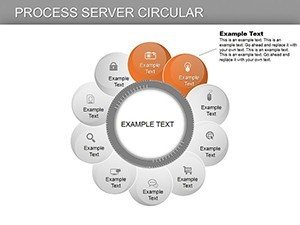
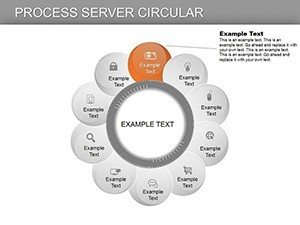
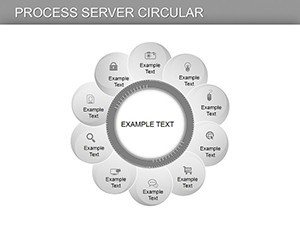
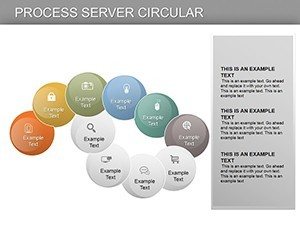
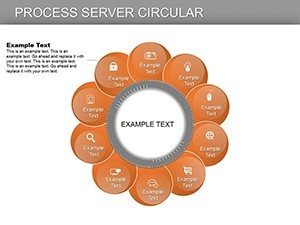
- Dynamic Circular Elements: Create charts that emphasize interconnections and progress.
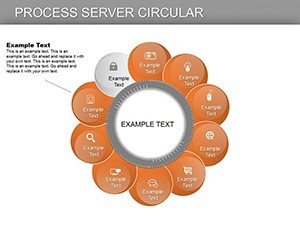
- Brand Customization: Adapt sizes, colors, and texts to align with your identity.
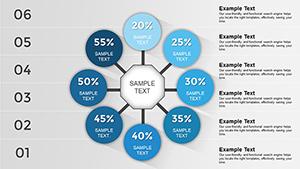
- Engagement Boosters: Visuals that draw focus to trends and key points.
- Versatile Slide Set: Covers from basic overviews to detailed analyses.
These elements solve visualization gaps, promoting better retention in presentations.
Applied Scenarios for Circular Chart Success
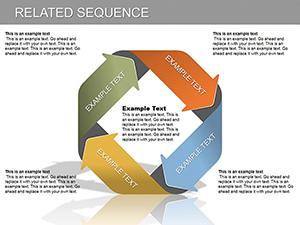
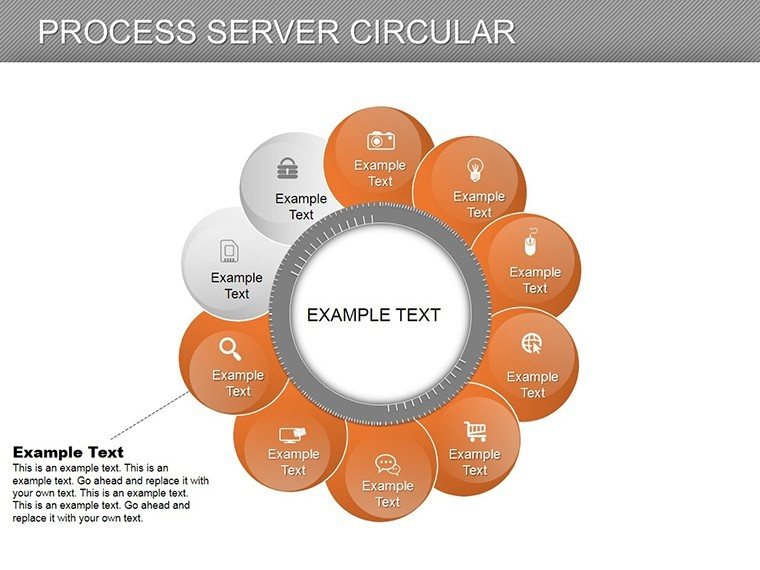
In marketing, map customer journeys circularly to reveal retention strategies. Project managers might use them for agile sprints, visualizing iterations. A success story: A tech firm employed similar charts to clarify server maintenance processes, reducing downtime through clearer protocols. This method outshines flat designs by adding depth.
Strategic Tips for Process-Focused Presentations
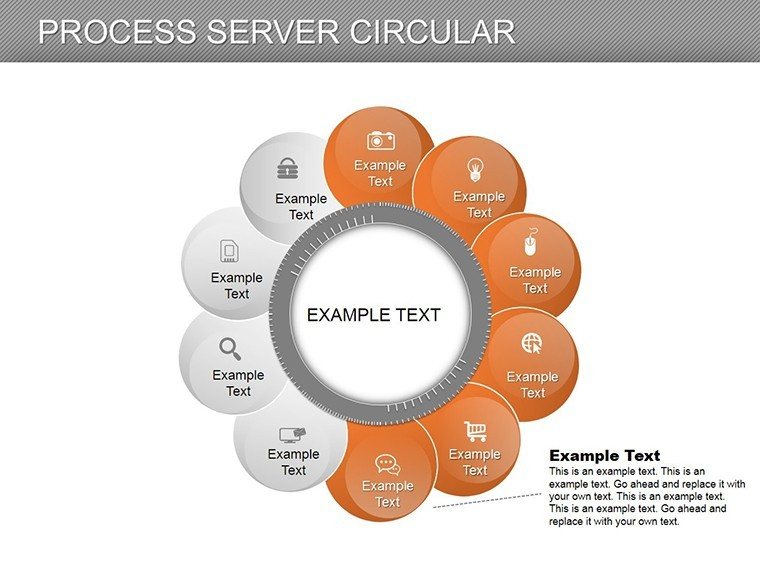
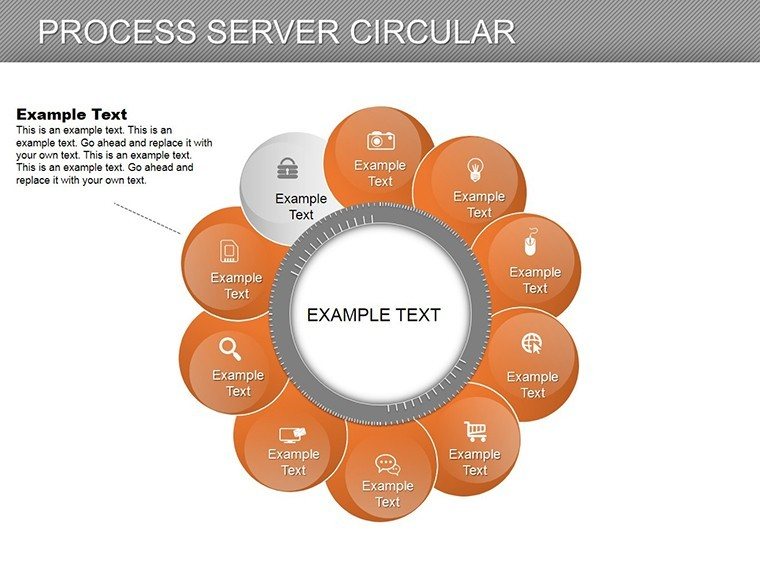
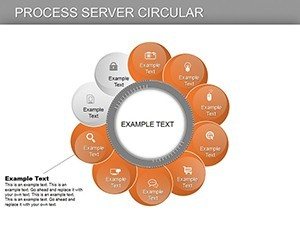
- Segment clearly: Use arcs for distinct phases in cycles.
- Integrate data: Link to sources for credibility.
- Animate progressively: Reveal segments to build narrative.
- Review holistically: Ensure the circle tells a complete story.
Embrace this template to revolutionize your process presentations - download now for impactful results.
Frequently Asked Questions
How do circular charts differ from linear ones?
They emphasize cycles and connections over sequences.
Can I resize the circles?
Yes, fully scalable without quality loss.
Is data import supported?
Absolutely, from spreadsheets for accuracy.
Suitable for large audiences?
High-res designs ensure clarity in projections.
Any animation templates included?
Yes, for dynamic reveals.