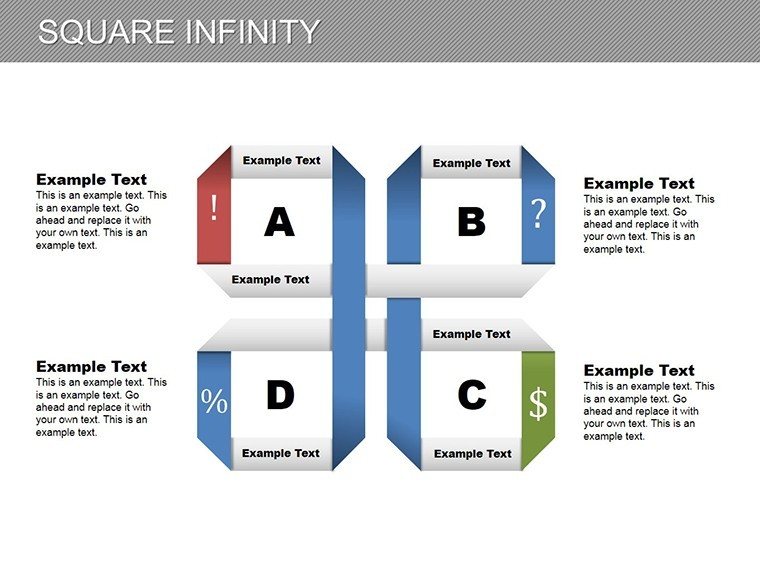
Square Infinity PowerPoint Charts Template


Type: PowerPoint Charts template
Category: Cycle
Sources Available: .pptx
Product ID: PC00174
Template incl.: 12 editable slides
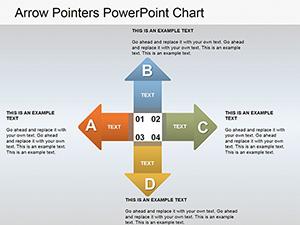
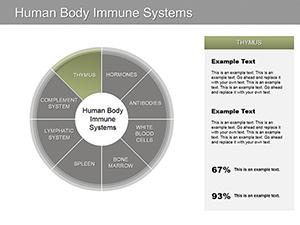
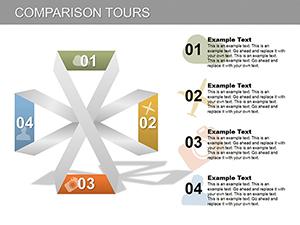
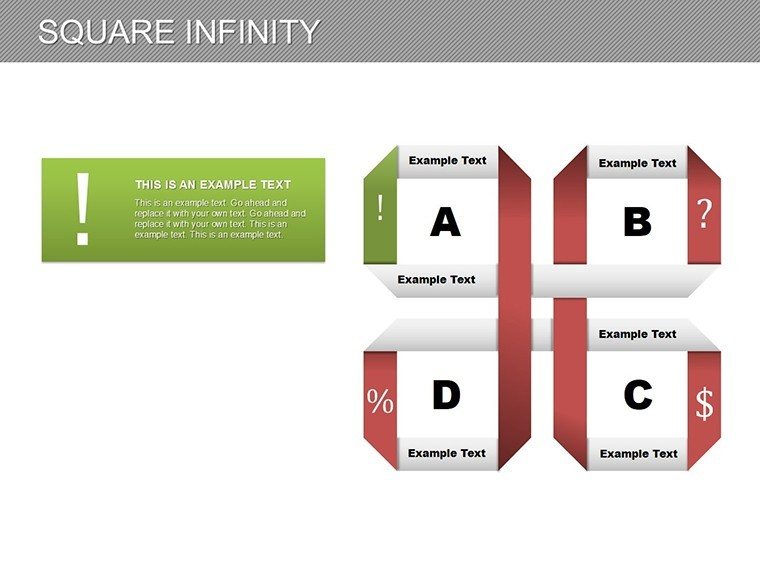
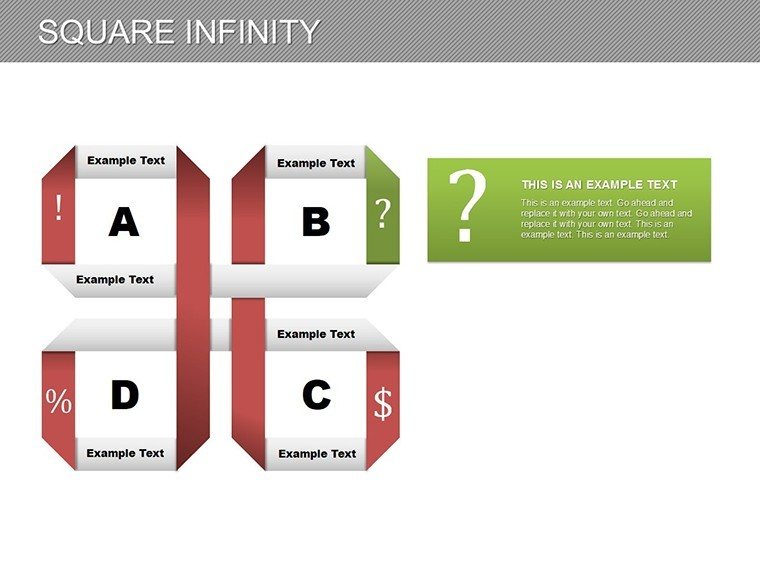
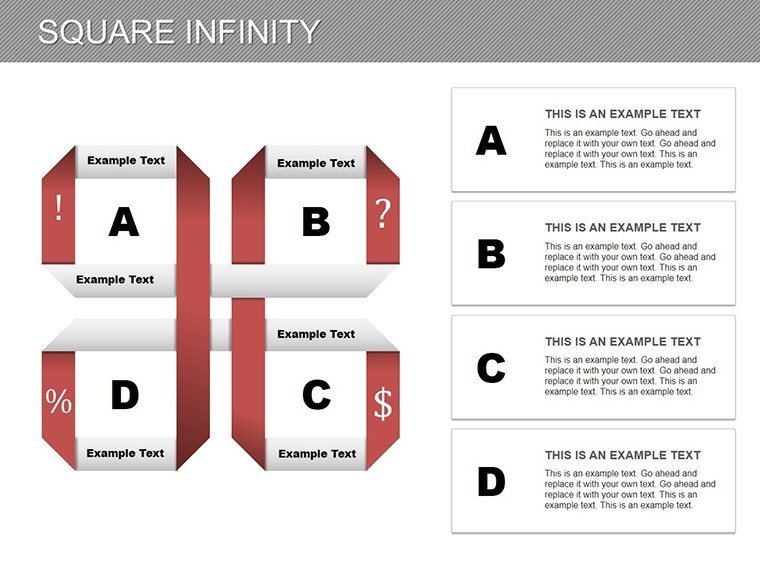
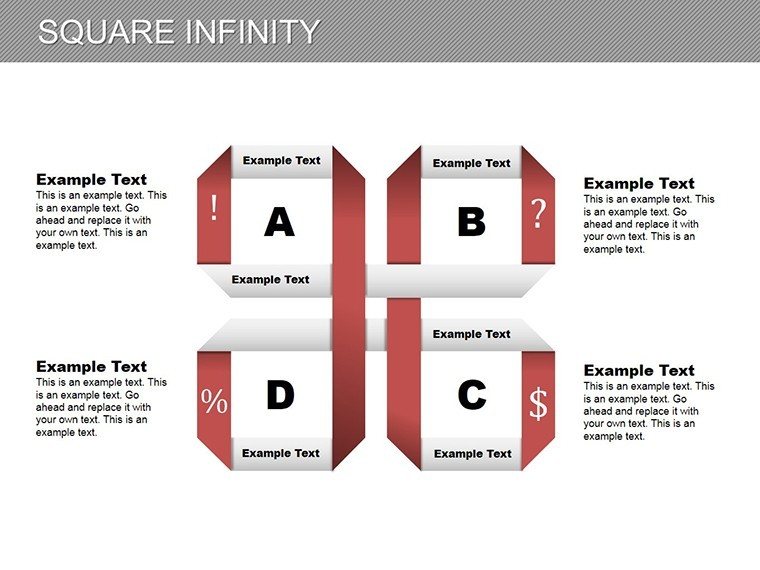
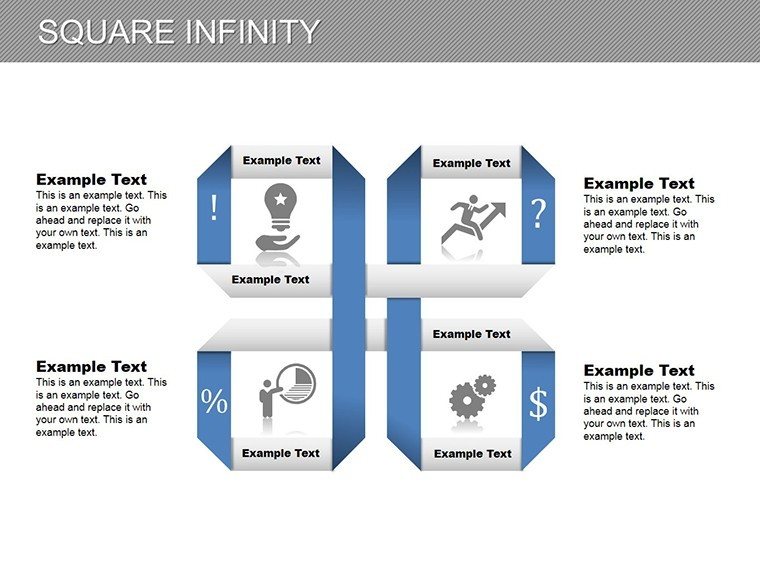
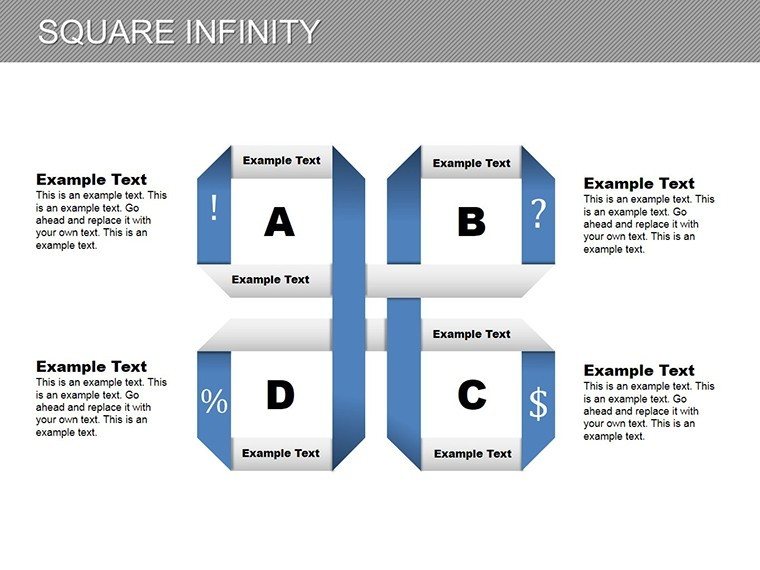
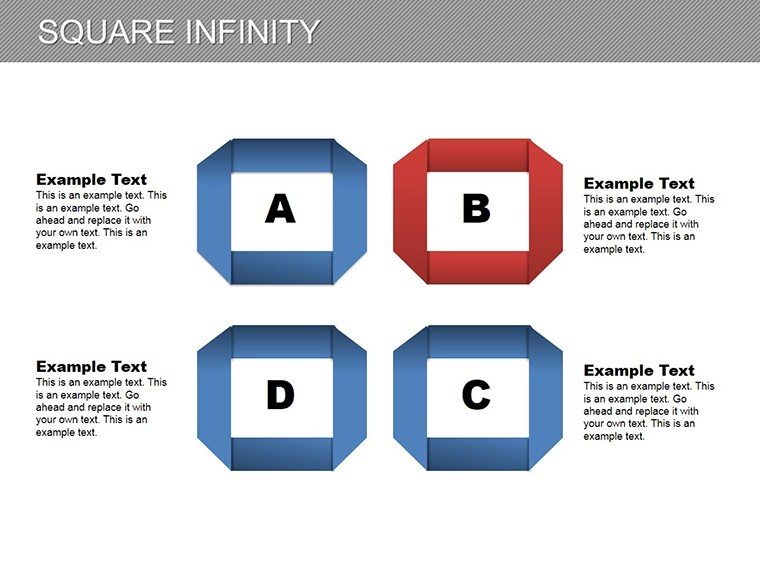
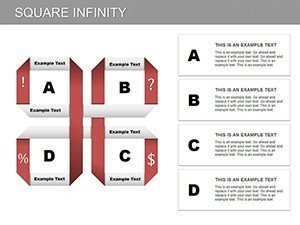
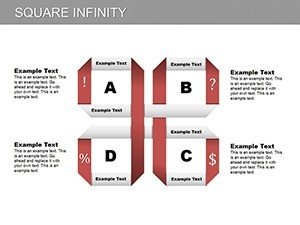
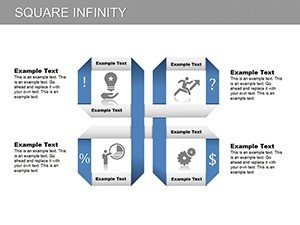
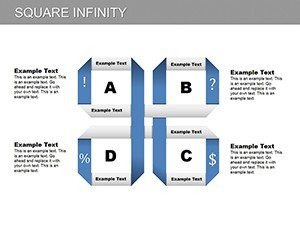
Unlock infinite potential in your presentations with the Square Infinity PowerPoint Charts Template. This 12-slide editable powerhouse features modern square designs symbolizing perpetuity and growth, ideal for cycle-based data. Suited for business analysts, marketers, researchers, managers, and entrepreneurs, it resolves the issue of static visuals by offering dynamic, infographic-rich slides. Benefits encompass time savings, audience captivation, and tailored messaging - perfect for conveying ongoing processes like innovation cycles or market evolutions. Transform your data into compelling stories that resonate long after the meeting ends.
Embracing Infinity in Data Visualization
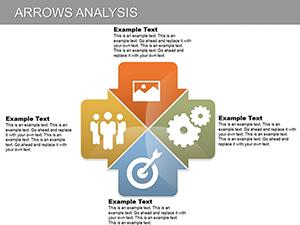
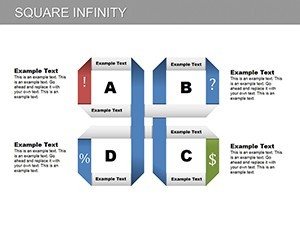
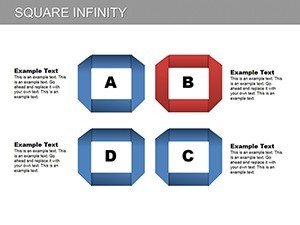
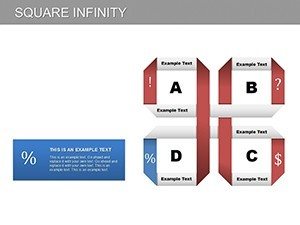
Square infinity motifs provide a fresh take on cycles, with layered squares representing endless iterations. Customize options allow brand-specific tweaks, enhancing relevance. Superior to basic charts, these draw from design principles seen in tools like Visio, promoting clarity in complex scenarios. Analysts can map perpetual data flows, while marketers visualize campaign loops.
Standout Features for Infinite Creativity
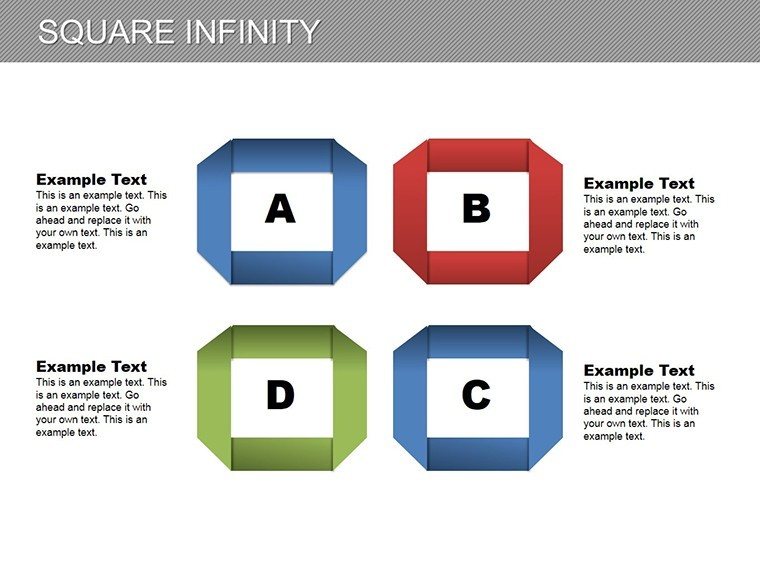
- Modern Designs: Versatile squares for diverse data sets.
- Chart Collection: Comprehensive for all visualization needs.
- Easy Edits: User-friendly for quick modifications.
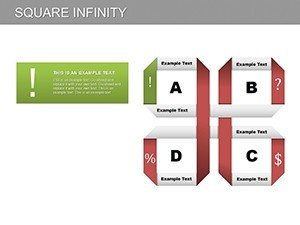
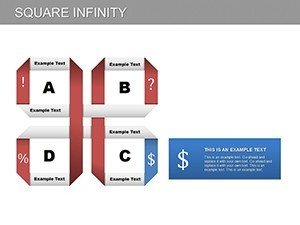
- Infographics: Enhance with visual elements.
These empower seamless PowerPoint integration.
Infinite Applications in Real Scenarios
Startup founders pitch scalable models; researchers show iterative findings. A consultant used akin designs to illustrate business loops, boosting client understanding.
Tips to Perpetuate Presentation Success
- Layer for depth: Build from core to outer infinities.
- Captivate visually: Use gradients for dimension.
- Tailor messages: Align with stakeholder goals.
- Impress with ease: Leverage built-in tools.
Download to perpetuate excellence in your presentations.
Frequently Asked Questions
What symbolizes the infinity design?
Endless cycles and growth.
Can I integrate infographics?
Yes, seamlessly.
Ideal for which fields?
Business, academia, startups.
Customization level?
Full, including colors and layouts.
Download format?
.pptx for immediate use.