Comparison Tours PowerPoint Charts Template: Revolutionize Your Data Storytelling


Type: PowerPoint Charts template
Category: Relationship
Sources Available: .pptx
Product ID: PC00173
Template incl.: 23 editable slides
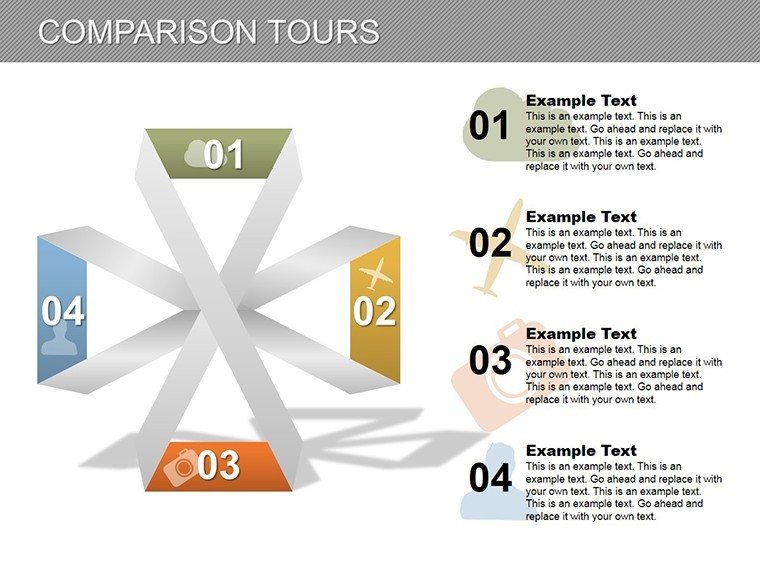
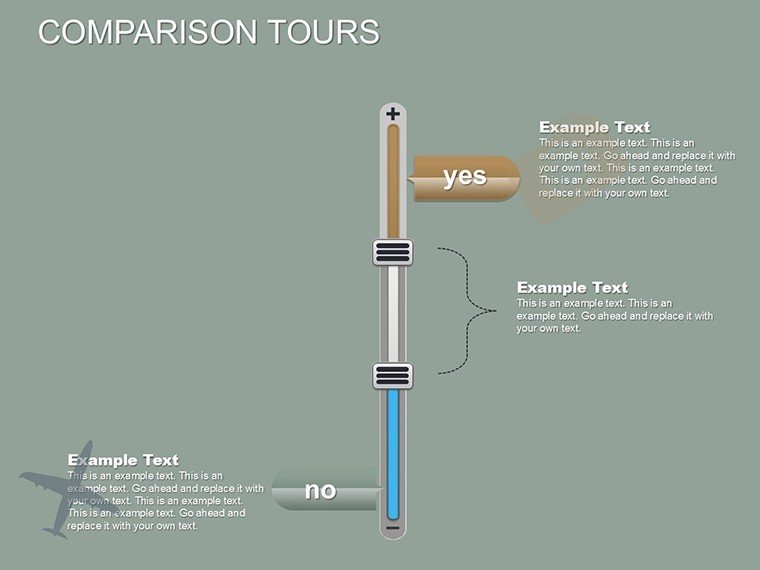
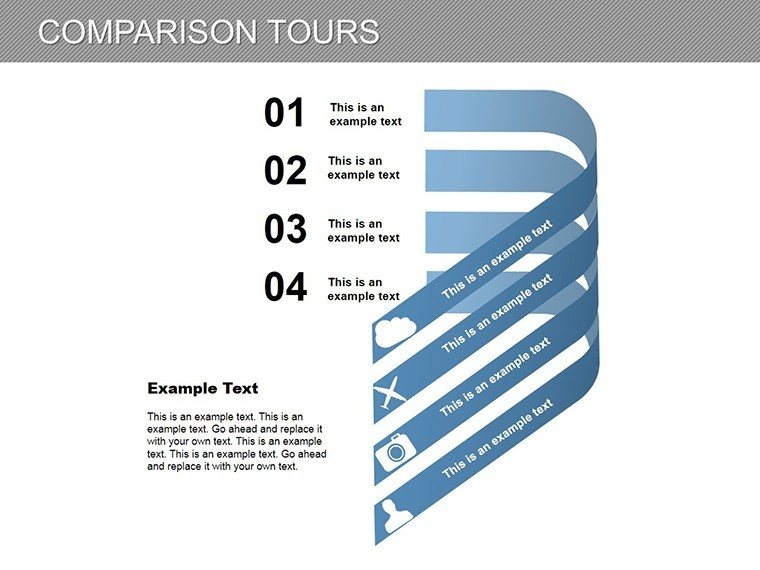
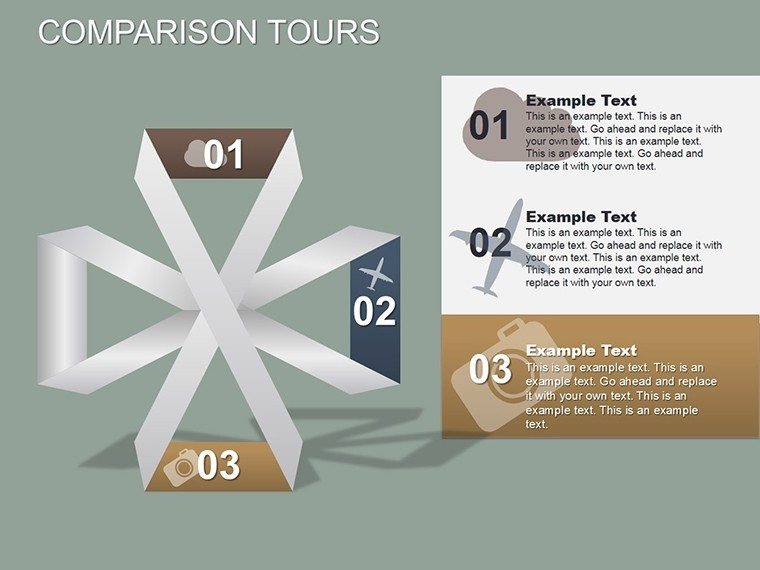
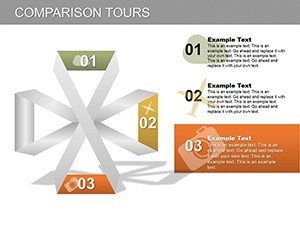
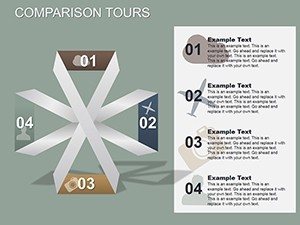
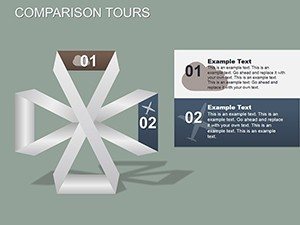
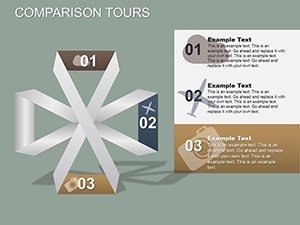
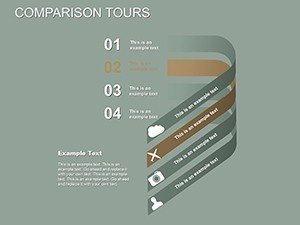
In the realm of professional presentations, where clarity meets creativity, the Comparison Tours PowerPoint Charts Template stands out as a game-changer. Designed for those who need to juxtapose ideas, data points, or strategies effectively, this template offers 23 fully editable slides that transform mundane comparisons into engaging visual journeys. Imagine guiding your audience through a "tour" of options, where each slide builds on the last, revealing contrasts and synergies with precision. Whether you're a market analyst comparing product features, an educator contrasting historical events, or a consultant evaluating business models, this template equips you with tools to make your narrative unforgettable. With its relationship-focused charts, it emphasizes connections and differences, helping you craft stories that resonate and persuade.
Key Features That Set This Template Apart
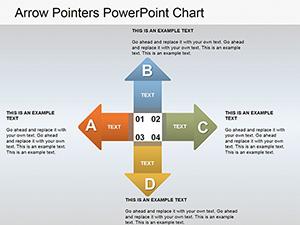
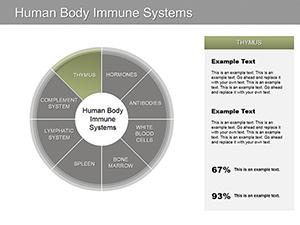
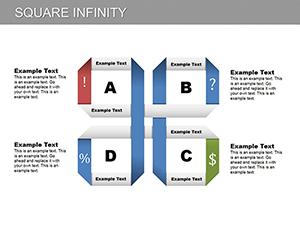
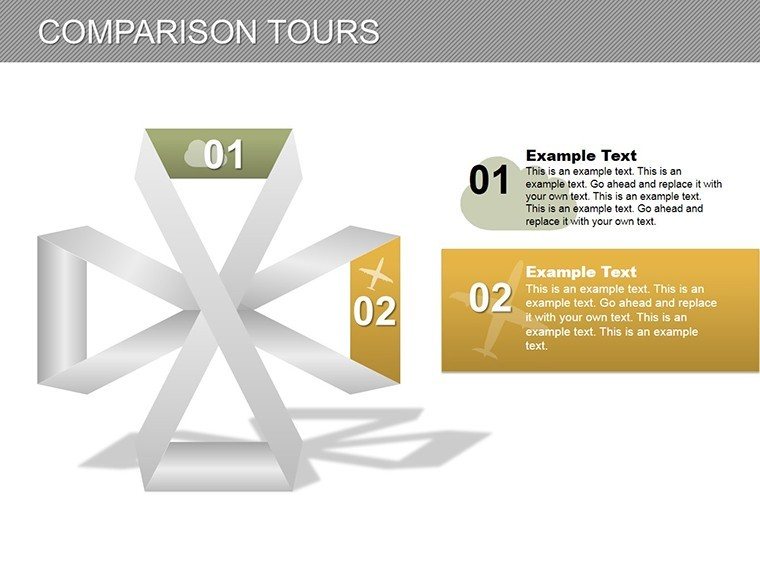
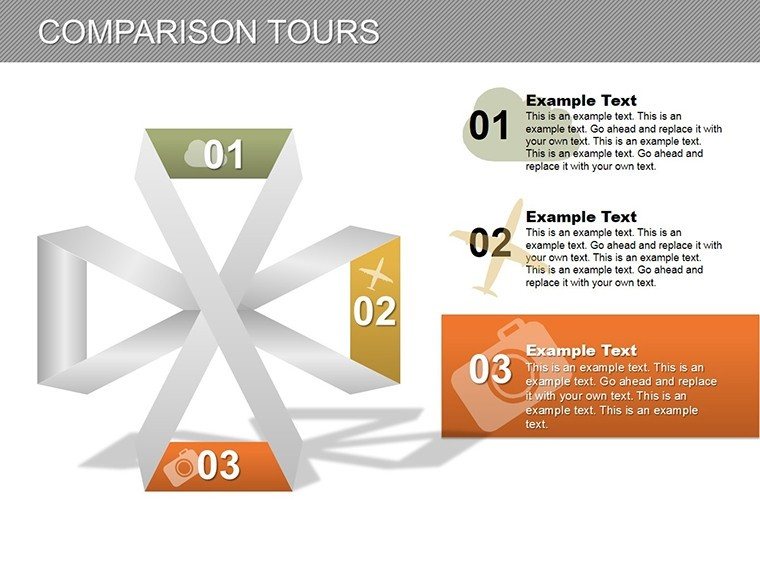
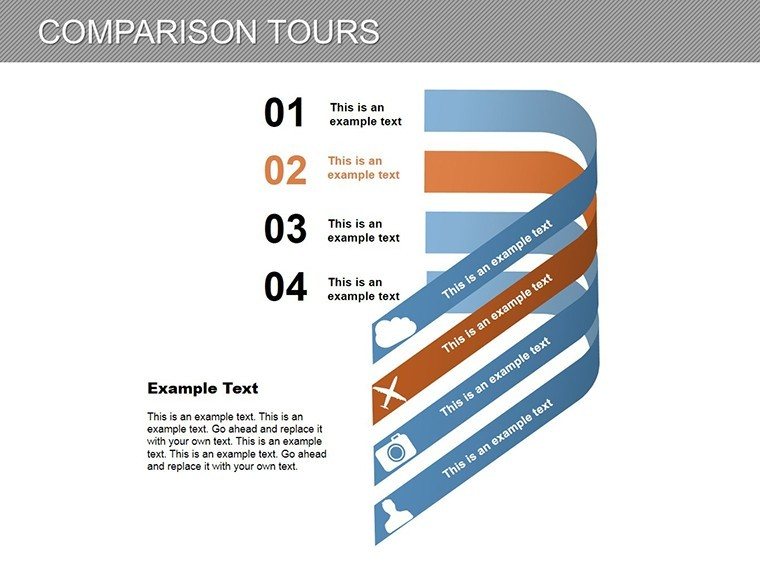
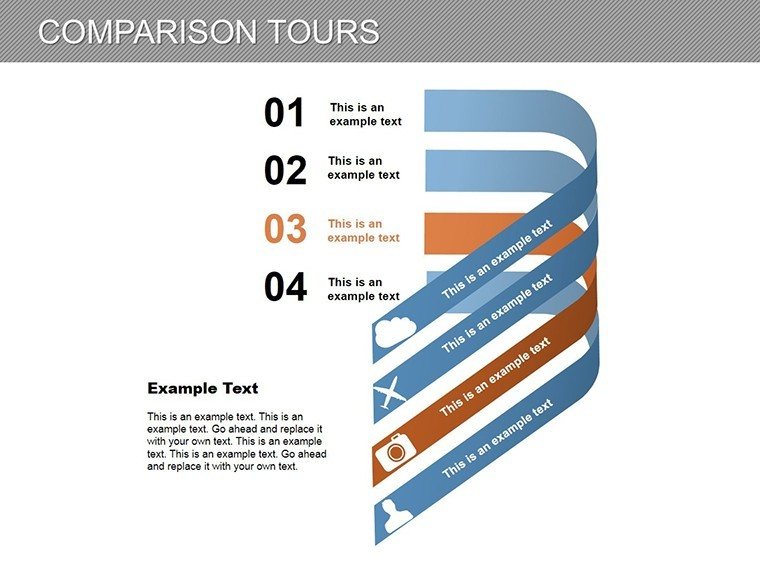
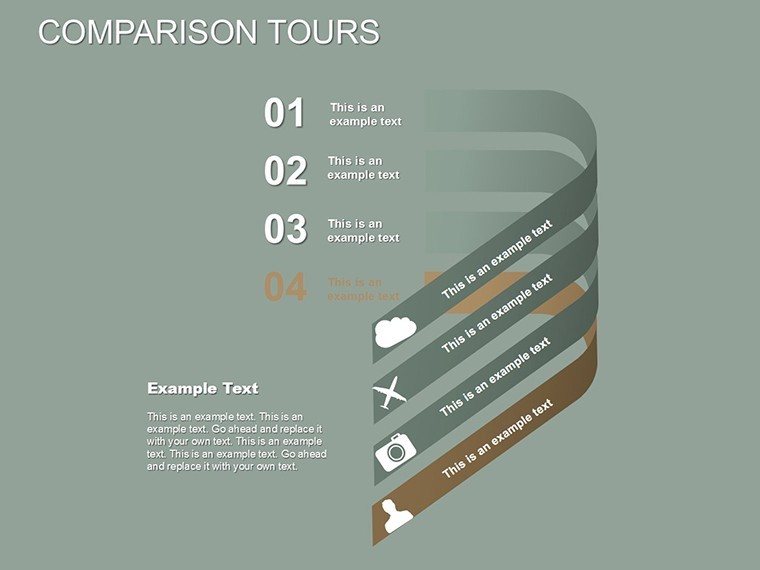
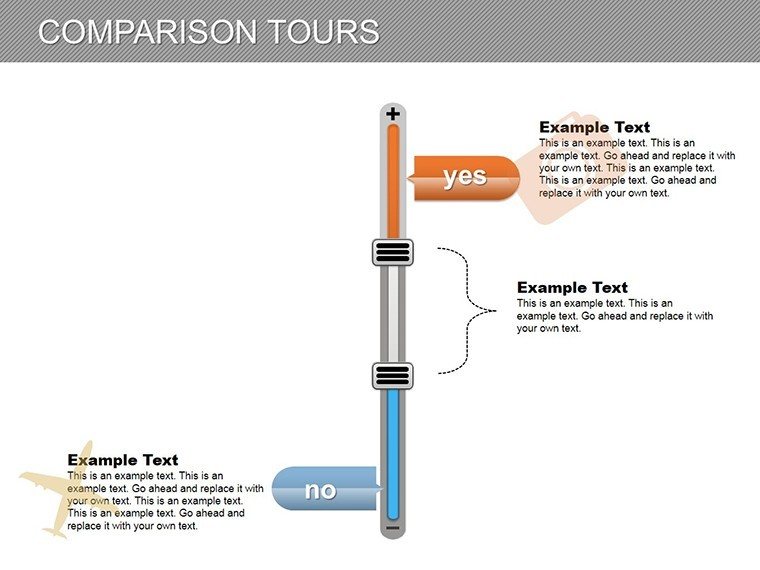
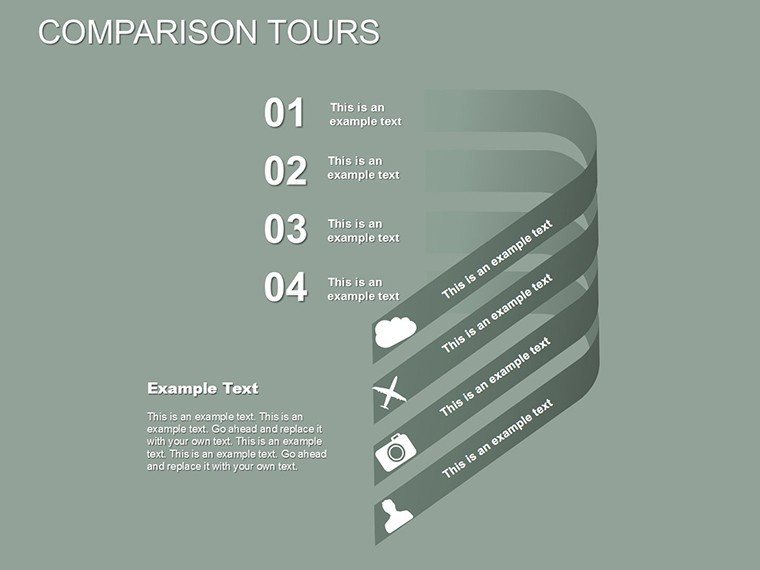
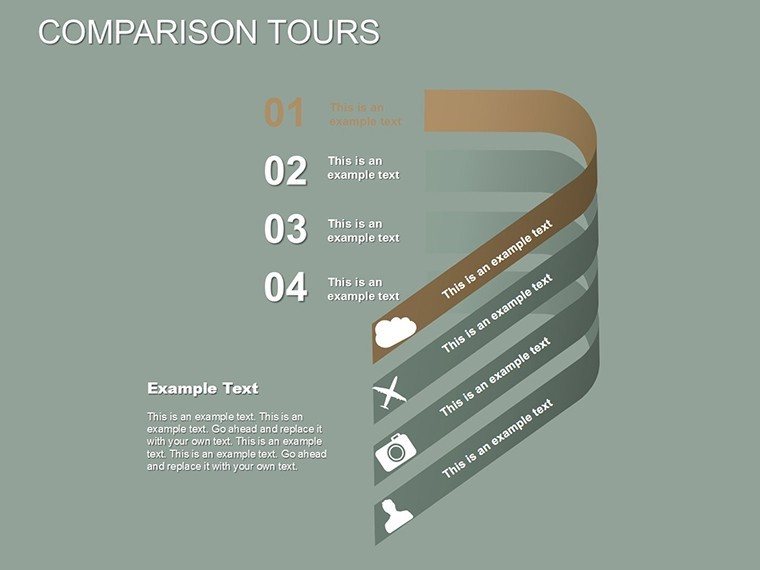
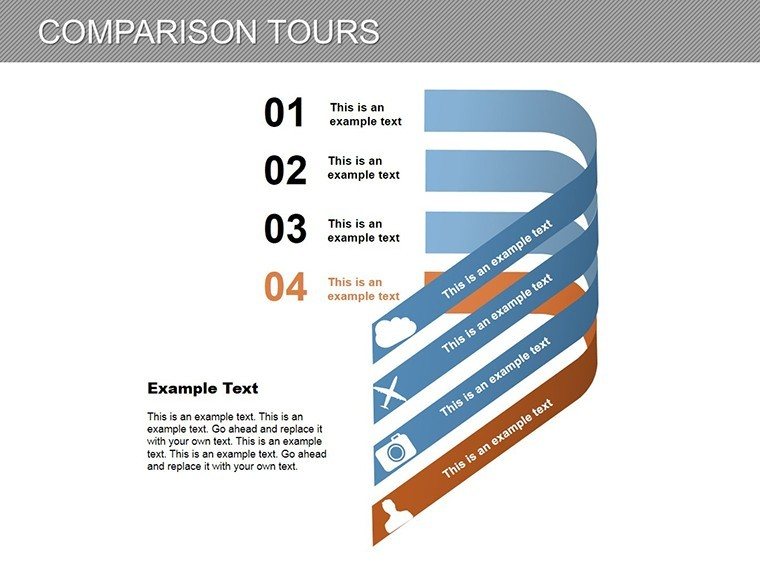
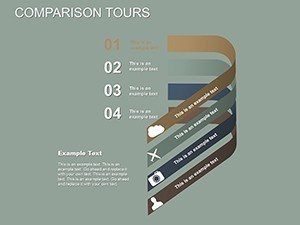
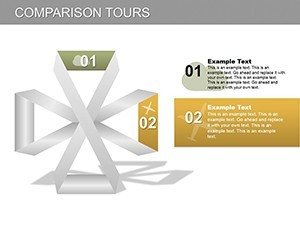
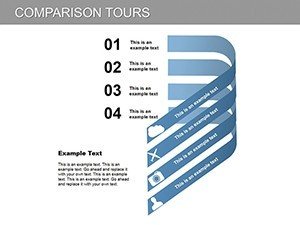
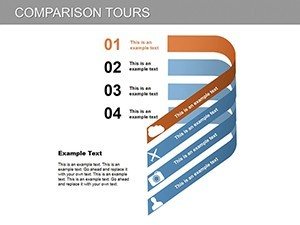
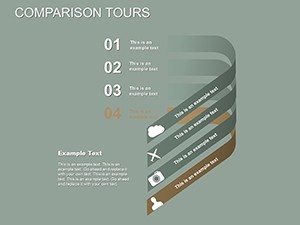
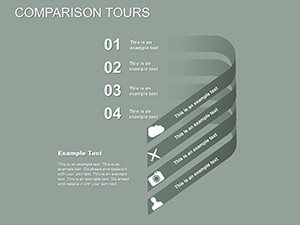
Diving deeper, the Comparison Tours template isn't just about aesthetics - it's built for functionality. Each of the 23 slides comes pre-loaded with dynamic elements like side-by-side bar graphs, Venn diagrams, and flowchart tours that allow seamless navigation through comparative data. For instance, one slide might feature a multi-layered tour chart where users can click through phases of a project comparison, ideal for agile teams reviewing iterations. Customization is at the core: adjust color palettes to match your brand's identity, tweak fonts for readability, or integrate your datasets directly into the charts without hassle. This flexibility ensures that whether you're presenting to a boardroom or a classroom, your visuals align perfectly with your message.
Enhancing Engagement Through Visual Tours
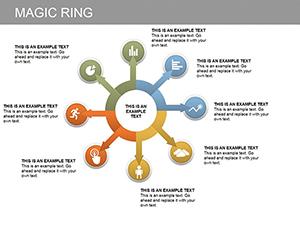
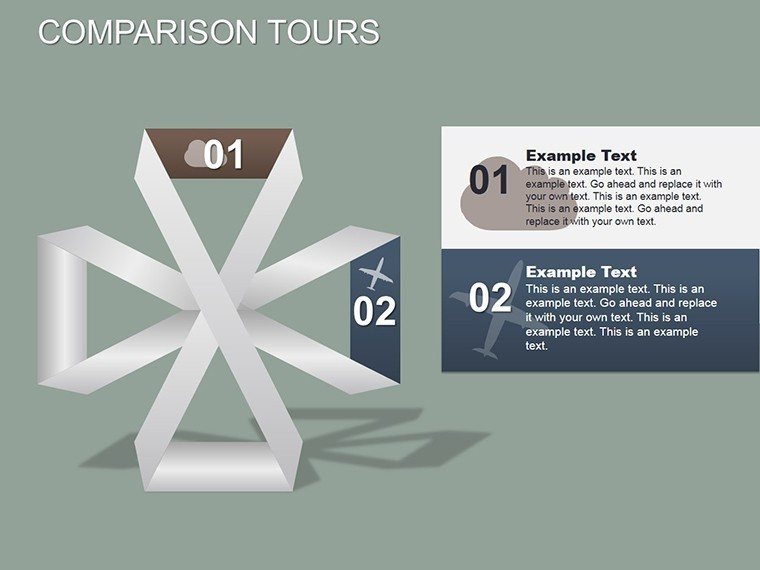
What makes comparison tours truly powerful is their ability to turn static data into an interactive experience. Picture this: in a sales pitch, you use a tour chart to compare your product's performance against competitors, with arrows guiding the eye from one metric to the next. This not only keeps attention but also aids retention - studies from presentation experts like those at Duarte Design show that visual storytelling can increase audience recall by up to 65%. Our template includes themed icons and animations that add flair without overwhelming, ensuring your tours feel professional yet approachable. Plus, with PowerPoint and Google Slides compatibility, you can edit on the go, making last-minute tweaks effortless.
Real-World Applications and Case Studies
Let's explore how this template shines in practice. For business professionals, consider a case where a tech firm used similar comparison tours to pitch software upgrades. By visualizing feature gaps and benefits side-by-side, they secured a major client deal, as the clear contrasts highlighted value propositions effectively. Educators might adapt it for literature classes, comparing character arcs in novels through timeline tours, fostering deeper discussions among students. Speakers at conferences, drawing from TED Talk principles, can leverage these charts to contrast ideas, building suspense and leading to powerful conclusions. In each scenario, the template solves common pain points like information overload by structuring data into digestible tours.
- Market Trend Analysis: Use stacked comparison charts to tour through quarterly growth data, spotting patterns at a glance.
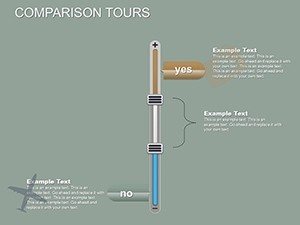
- Product Evaluations: Highlight pros and cons with balanced visuals, aiding decision-making in team meetings.
- Strategic Planning: Map out scenario comparisons, from best-case to worst-case, for robust forecasting.
Beyond these, integrate it into workflows like SWOT analyses, where tours can sequentially unpack strengths against weaknesses. A real example from a consulting firm aligned with PMI standards involved using such charts to compare project methodologies, resulting in streamlined processes and higher efficiency.
Design Tips for Maximum Impact
To elevate your use of this template, focus on simplicity: limit each tour to 3-5 key comparisons to avoid clutter. Incorporate high-contrast colors for accessibility, adhering to WCAG guidelines, ensuring everyone in your audience can follow along. Add subtle animations - like fade-ins for each tour segment - to guide focus without distraction. For data integrity, always source from reliable datasets; for instance, pair with tools like Excel for live updates. These tips, drawn from years of presentation design expertise, turn good slides into great ones.
Why Download This Template Today
In a world flooded with information, standing out requires tools that blend insight with inspiration. The Comparison Tours PowerPoint Charts Template does just that, offering value through its editable nature and versatile applications. Priced affordably, it's an investment in your communication skills, saving hours on design while boosting engagement. Don't let your next presentation fall flat - customize your tours now and watch your ideas connect like never before.
Frequently Asked Questions
How customizable are the comparison tour charts?
The charts are fully editable, allowing changes to data, colors, layouts, and even adding custom elements via PowerPoint tools.
Is this template compatible with Google Slides?
Yes, it works seamlessly with Google Slides after uploading the .pptx file, maintaining all features and edits.
Can I use these for non-business purposes?
Absolutely, it's ideal for educational, personal, or nonprofit presentations, adapting to any comparative need.
What file format is provided?
The download includes a .pptx file, ready for immediate use in Microsoft PowerPoint or compatible software.
Are there animation options included?
Yes, pre-set animations enhance the tour flow, but you can modify or remove them as needed.