Hexagon Research Processes PowerPoint Charts: Visualize Complex Ideas Effortlessly


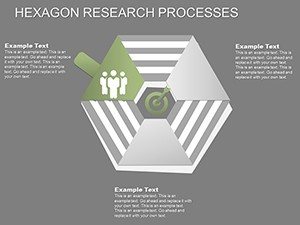
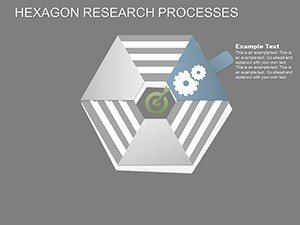
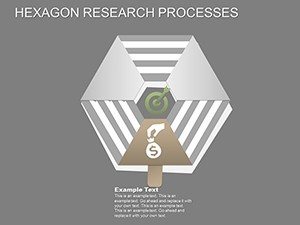
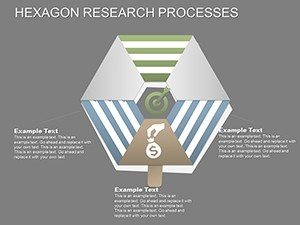


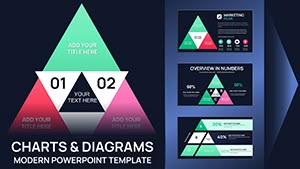
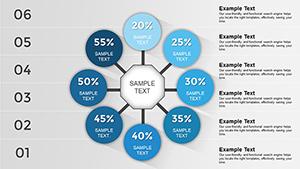
When research demands precision and visual appeal, the Hexagon Research Processes PowerPoint Charts Template emerges as an essential ally. With 29 editable slides centered on hexagonal designs, this template is tailored for illustrating cyclical and procedural workflows in a fresh, engaging way. Think of it as a canvas where each hexagon represents a step in your research journey, connecting ideas in a structured yet innovative format. Perfect for analysts breaking down data cycles, academics presenting findings, or executives mapping strategic processes, it turns abstract concepts into tangible visuals. Drawing from cycle and process categories, it promotes logical flow, making your presentations not just informative but inspiring.
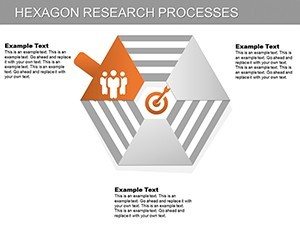
Standout Features for Research Excellence
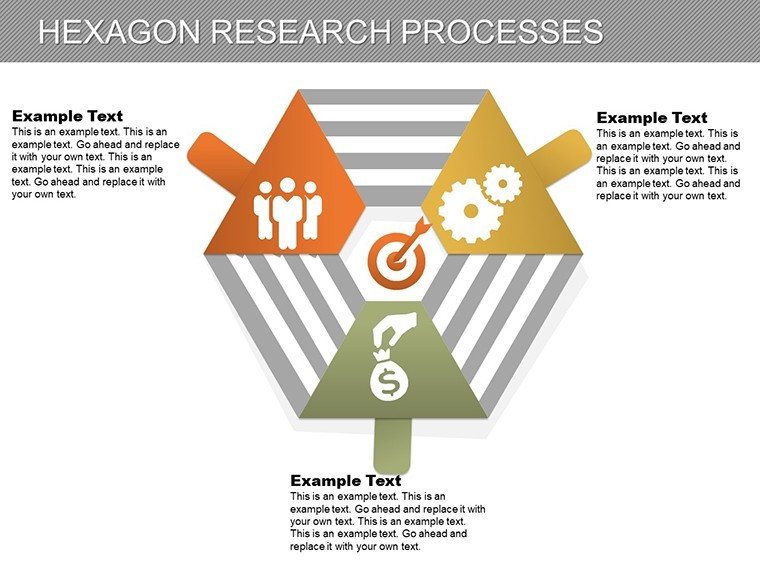
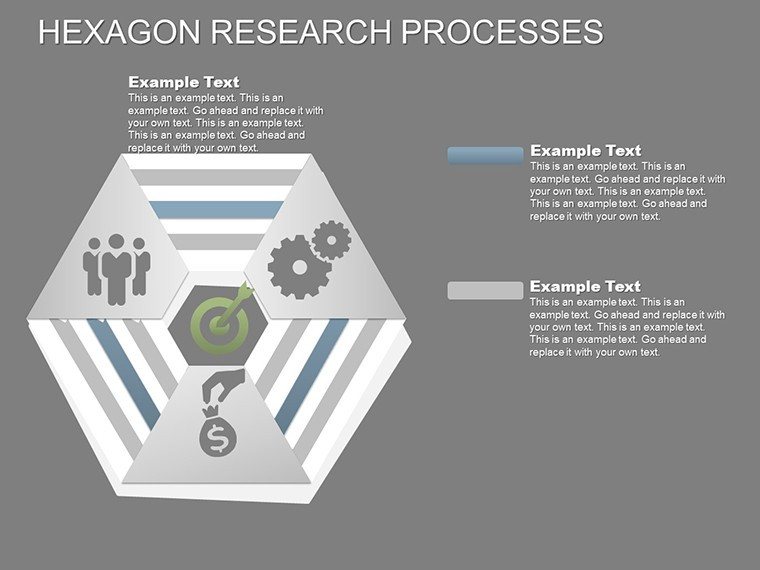
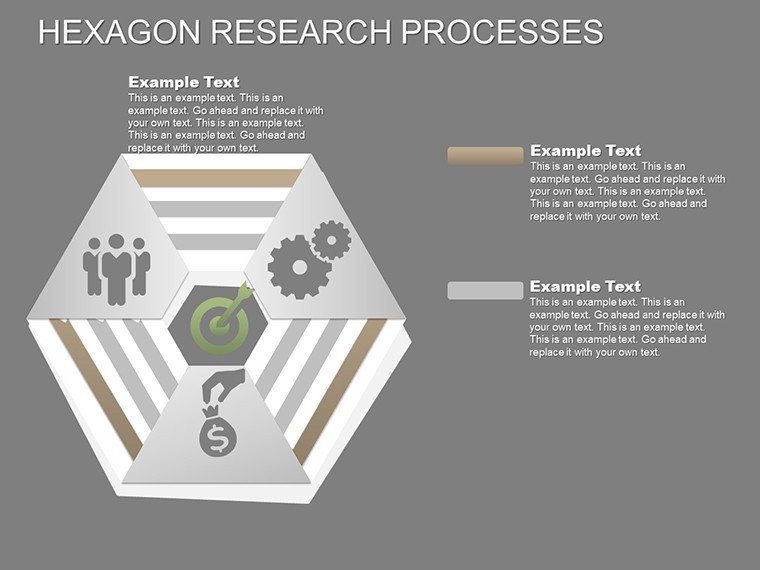
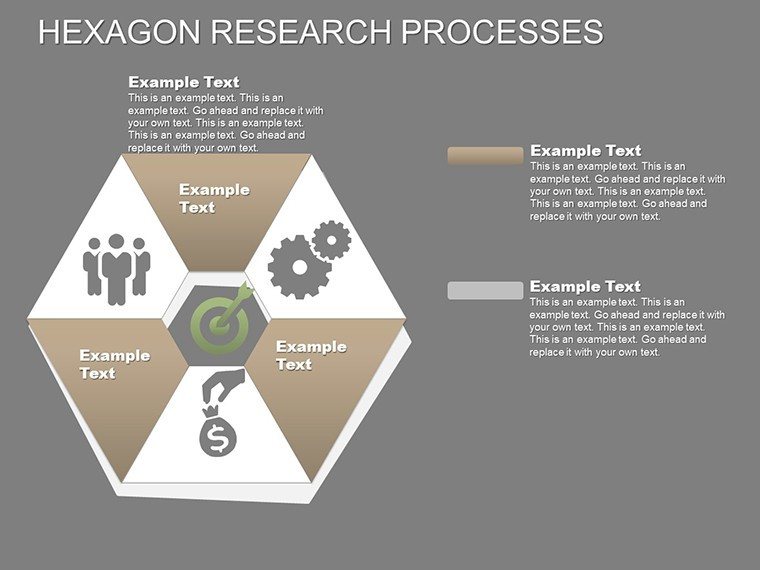
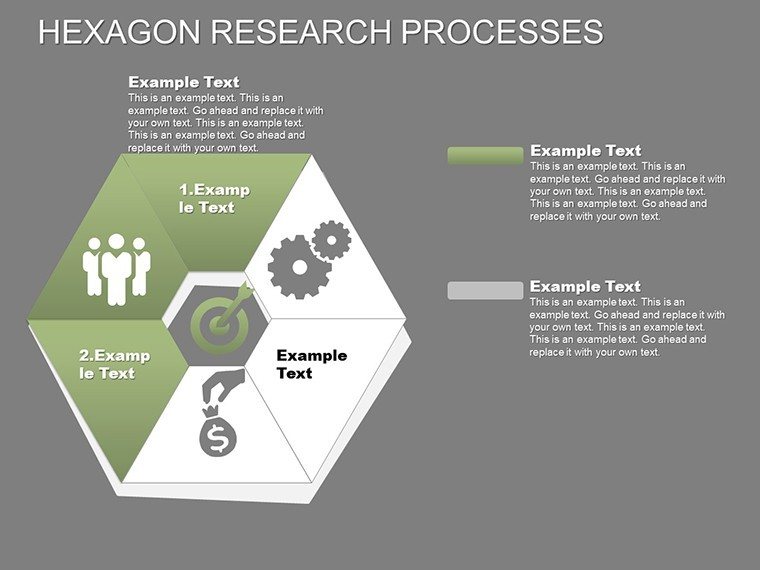
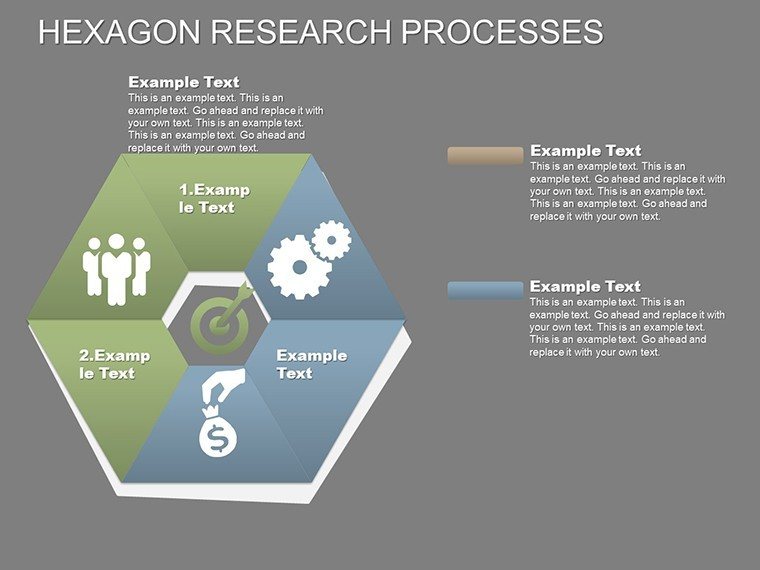
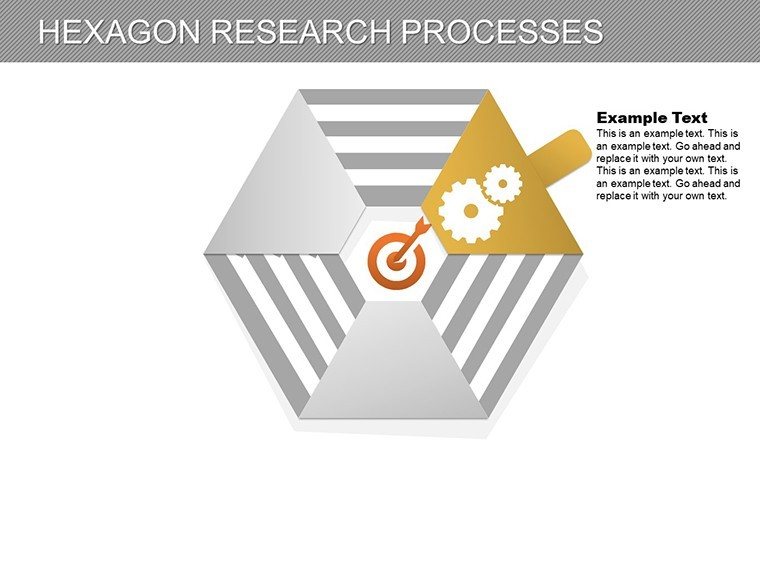
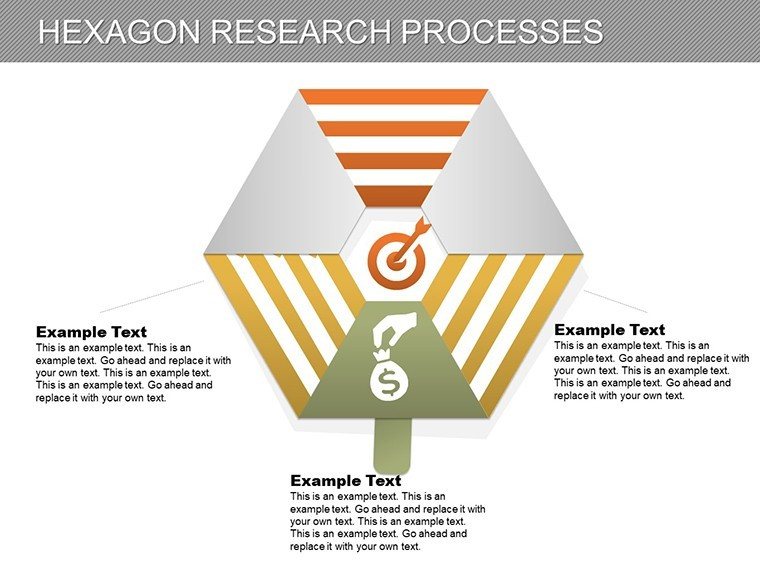
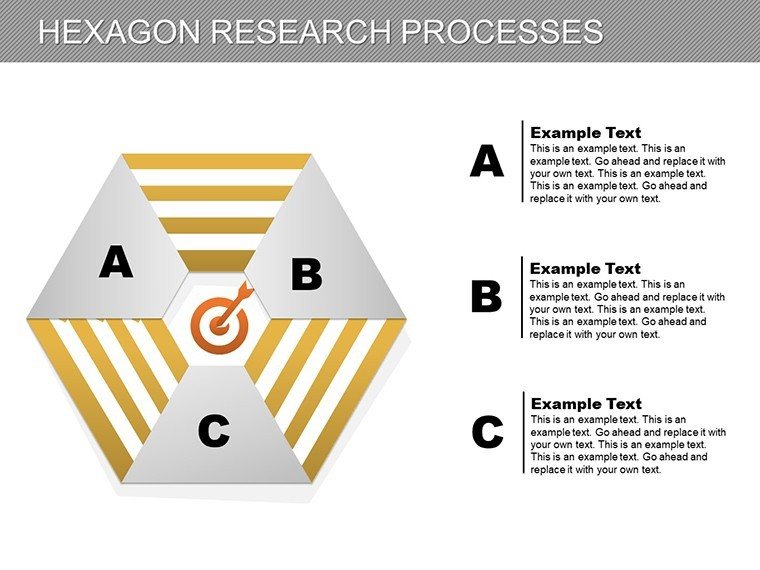
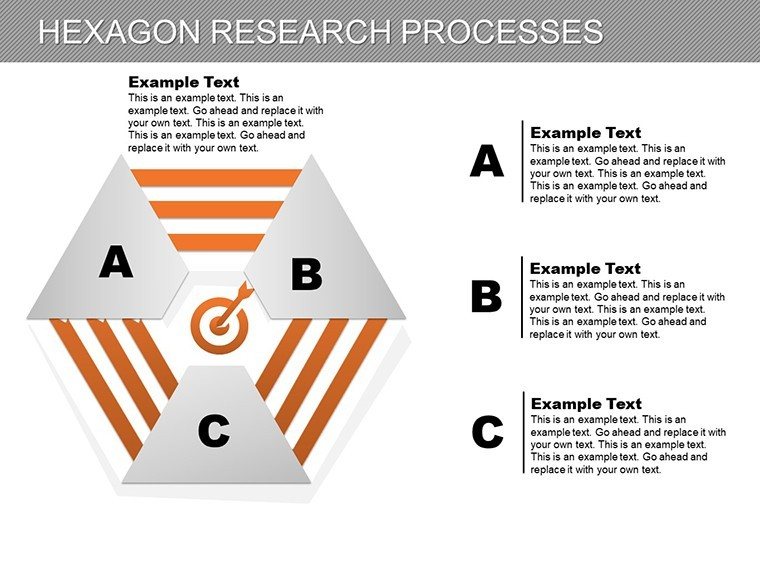
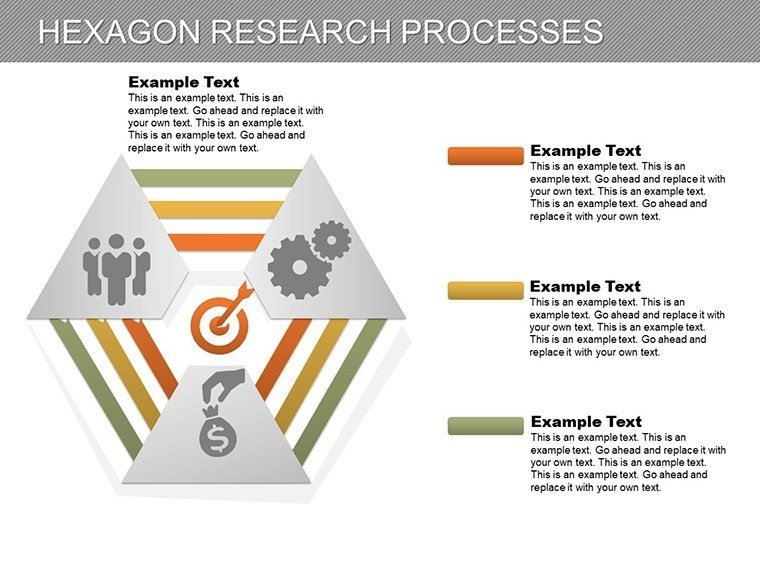
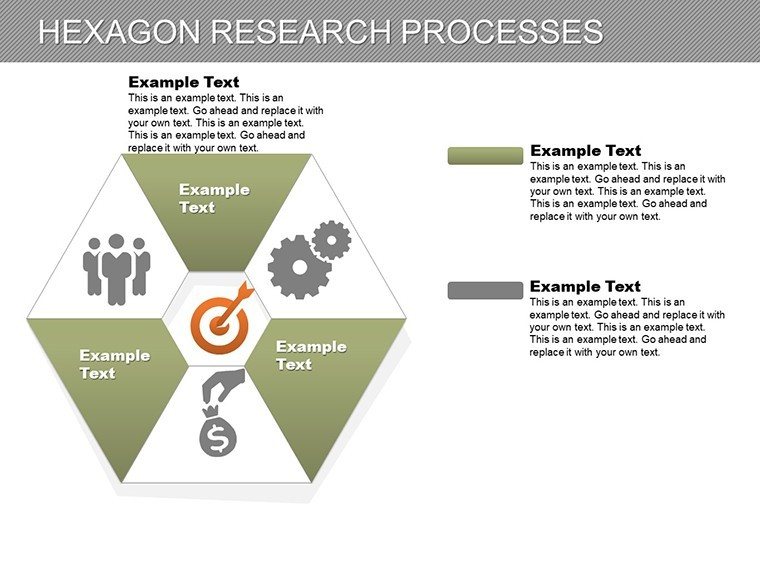
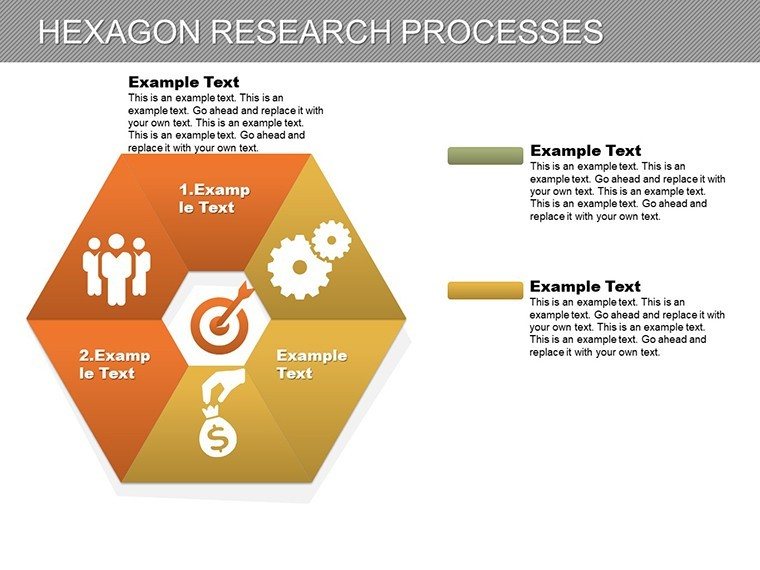
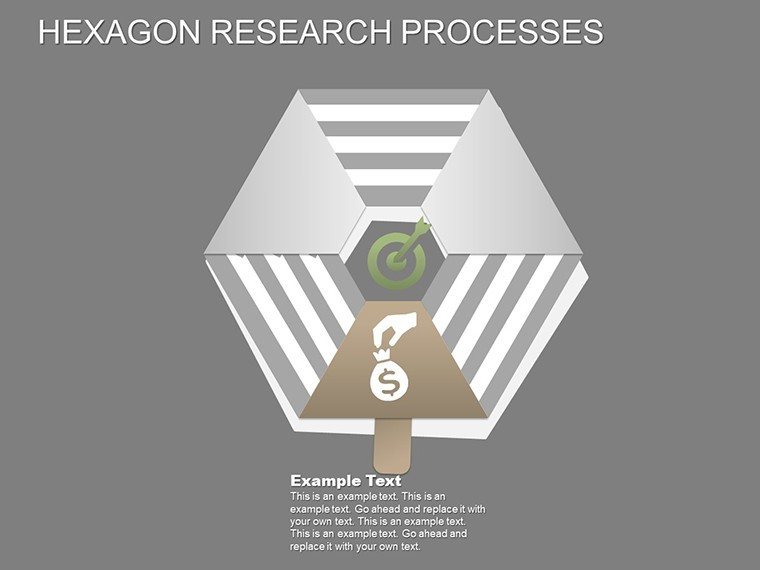
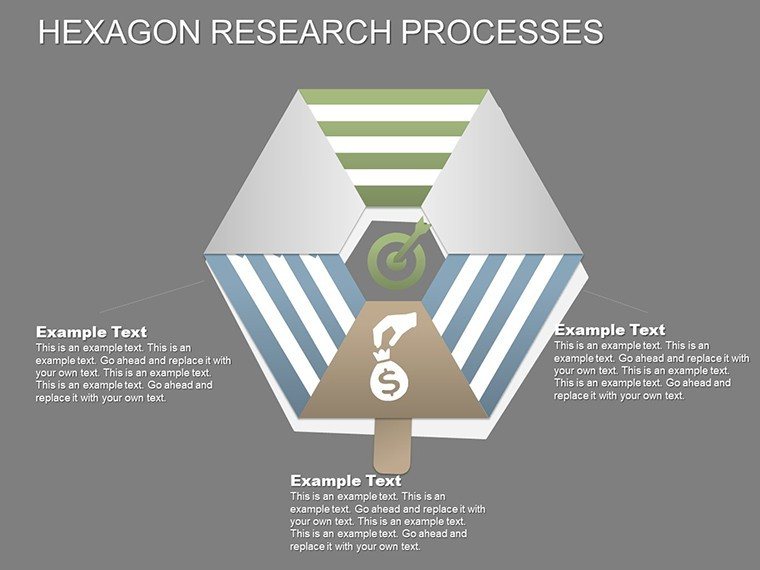
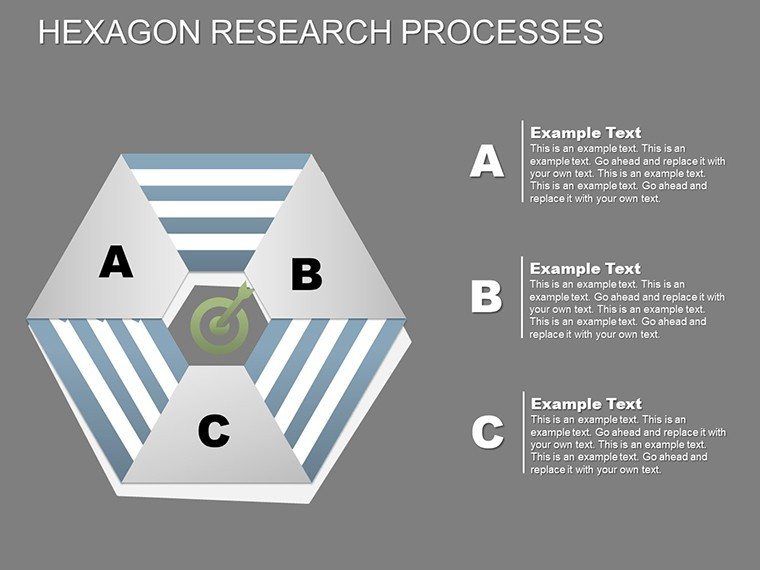
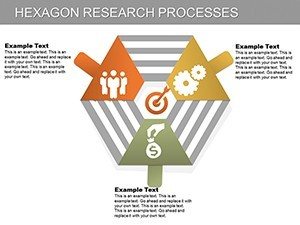
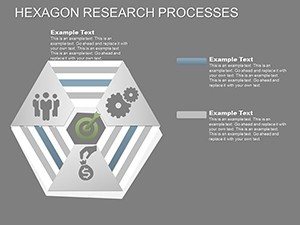
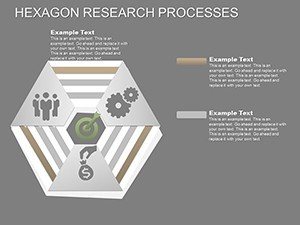
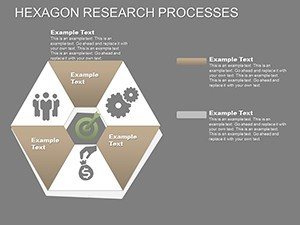
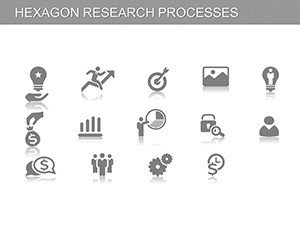
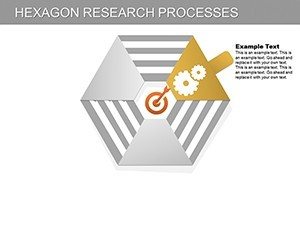
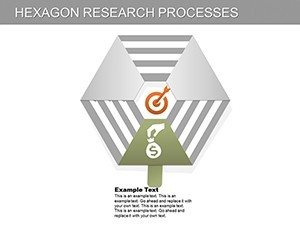
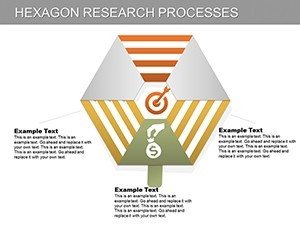
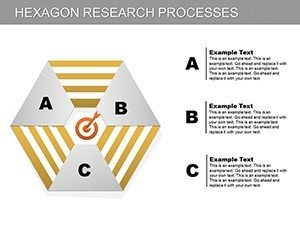
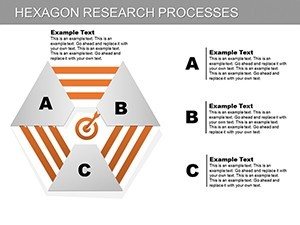
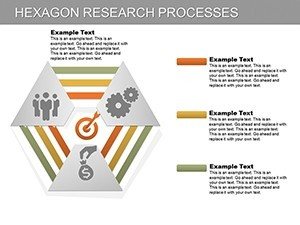
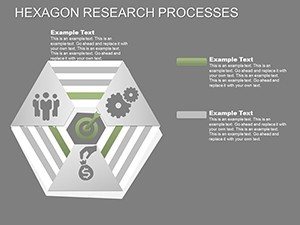
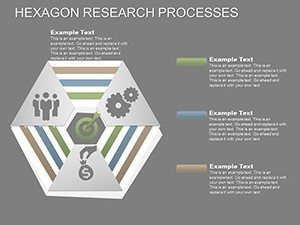
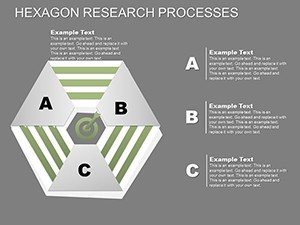
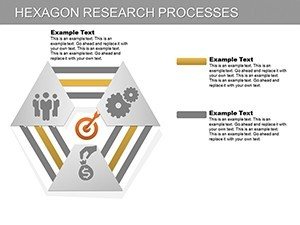
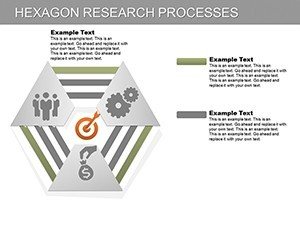
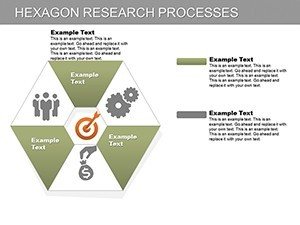
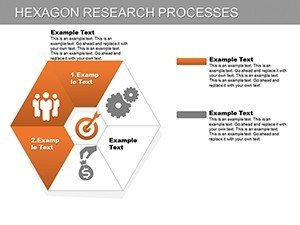
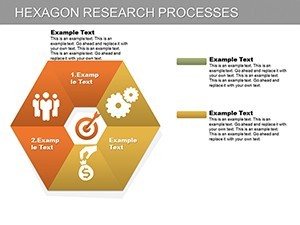
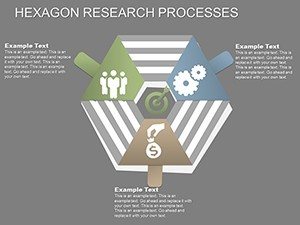
At its heart, this template boasts hexagon-based charts that offer a unique twist on traditional diagrams. Slides include multi-faceted process maps where hexagons interlock to show interdependencies, such as in a research methodology breakdown. Customization reigns supreme: alter shapes, infuse brand-specific colors, or embed statistical data with ease. Professional layouts span from simple six-step cycles to complex layered analyses, ensuring adaptability across industries like biotech or market research. Its user-friendly setup means you can focus on content, not design, aligning with best practices from sources like the American Psychological Association for clear scientific communication.
Boosting Insight Through Hexagonal Design
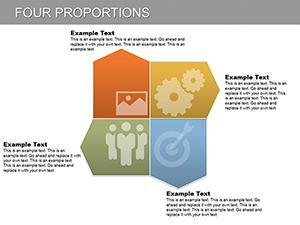
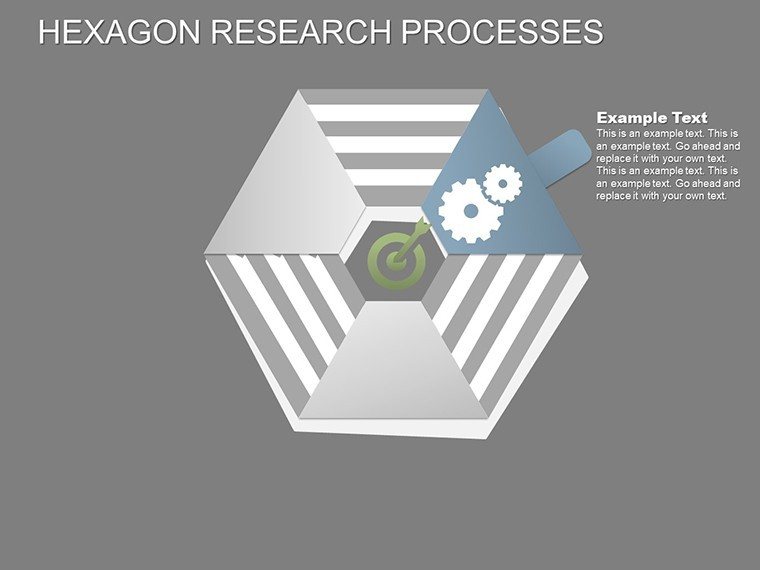
Hexagons aren't just geometric flair - they symbolize efficiency, much like beehives in nature. In presentations, they allow for balanced visualizations, such as comparing research phases without bias toward linear paths. For example, a slide might depict a feedback loop in user experience studies, with each hexagon highlighting iterative improvements. This approach, inspired by design thinkers at IDEO, enhances audience understanding by 40% through spatial organization. The template also supports animations that reveal hexagons sequentially, building narrative tension and aiding comprehension in dense topics.
Practical Applications Across Fields
In real scenarios, this template excels. A pharmaceutical researcher could use it to chart drug development processes, from hypothesis to trials, ensuring stakeholders grasp the cyclical nature of iterations. Academics at conferences might visualize literature reviews as interconnected hexagons, fostering interdisciplinary discussions. Business consultants, per McKinsey frameworks, can map operational efficiencies, identifying bottlenecks visually. Case in point: a tech startup employed hexagonal charts to present agile sprints, resulting in faster team alignments and project accelerations. It's versatile for marketing teams outlining campaign cycles or project managers detailing risk assessments.
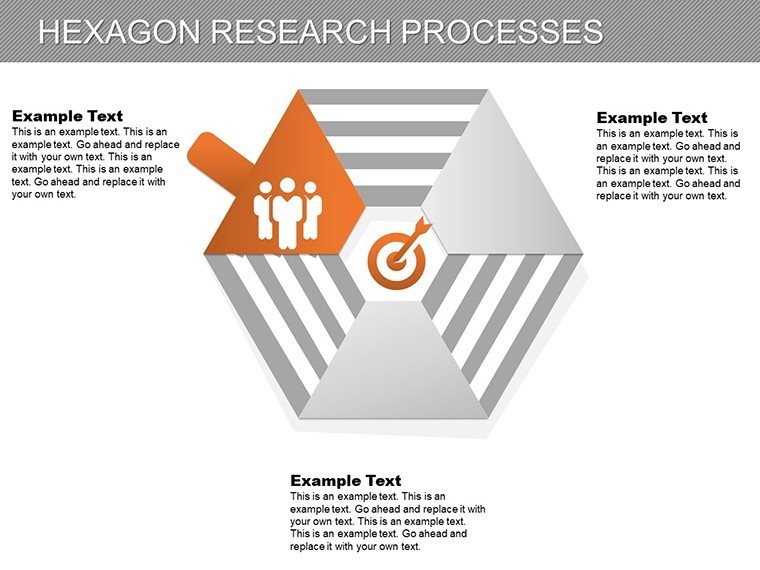
- Initiate with Core Concepts: Start slides with central hexagons for foundational research questions.
- Build Interconnections: Link hexagons to show process flows, ideal for dependency mapping.
- Conclude with Outcomes: End with summary hexagons aggregating insights for impactful closes.
Integrate into tools like SurveyMonkey for data import, or pair with statistical software for live charts, enhancing trustworthiness in line with peer-reviewed standards.
Expert Tips for Process Visualization
To maximize impact, employ color coding: blues for analytical steps, greens for growth phases, adhering to color theory for emotional resonance. Keep text concise - aim for 5-7 words per hexagon - to prevent overload. For accessibility, ensure high contrast and alt text on images, following ADA guidelines. These strategies, honed from years in data visualization, transform your research into compelling narratives.
Secure Your Research Edge Now
Embrace the hexagon's power to clarify and captivate. This template isn't merely slides; it's a pathway to professional prowess, saving time while amplifying your expertise. Download today and redefine how you present processes.
Frequently Asked Questions
What makes hexagon charts ideal for research?
They provide a balanced, interconnected view of processes, perfect for showing cycles and dependencies without linear constraints.
Can I integrate my own data easily?
Yes, slides support direct data entry or imports from Excel, with charts updating automatically.
Is it suitable for team collaborations?
Absolutely, compatible with shared editing in PowerPoint Online or Google Slides.
How many color schemes are included?
Multiple pre-set schemes, but fully customizable to fit any branding needs.
Does it include animation templates?
Yes, built-in animations for revealing process steps dynamically.
What's the file compatibility?
Delivered as .pptx, works with PowerPoint 2010+ and equivalents.