Editable Tetrahedron PowerPoint Charts for 3D Visuals


Type: PowerPoint Charts template
Category: Pyramids
Sources Available: .pptx
Product ID: PC00159
Template incl.: 32 editable slides
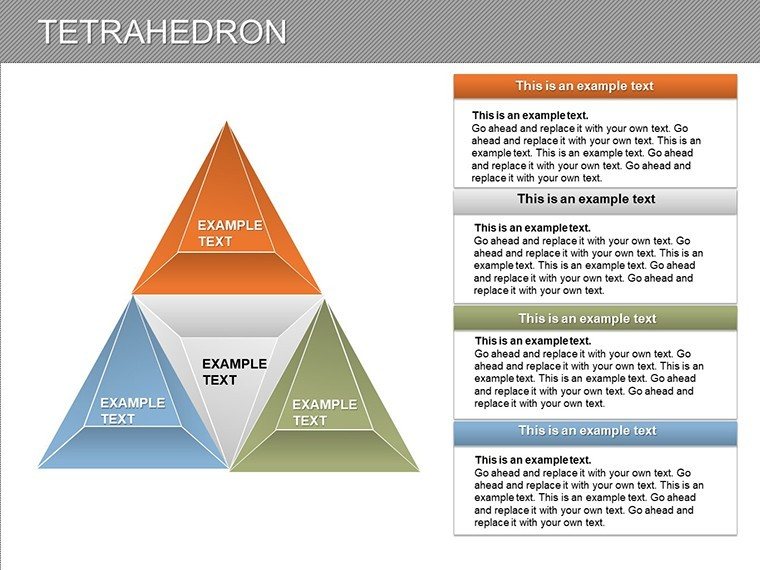
Geometry comes alive when you have the tools to visualize it beyond flat surfaces. Our Tetrahedron PowerPoint Charts Template brings the elegance of this simplest polyhedron - four triangular faces forming a spatial triangle analogue - into your presentations. Ideal for educators explaining mathematical concepts, architects modeling structures, or engineers simulating designs, this template with 32 editable slides offers a gateway to immersive 3D representations. Forget static diagrams; here, you can rotate perspectives, adjust dimensions, and integrate data to make abstract ideas tangible and engaging.
The tetrahedron's unique structure lends itself to diverse applications, from illustrating molecular bonds in chemistry to hierarchical frameworks in business strategy. This template captures that versatility, providing pre-built charts that save you from scratch-building in PowerPoint. With its focus on editability, you can tweak every facet to suit your narrative, ensuring your audience grasps the depth - literally and figuratively - of your content.
Exploring the Core Features of Tetrahedron Charts
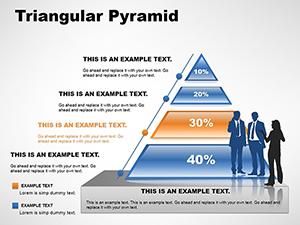
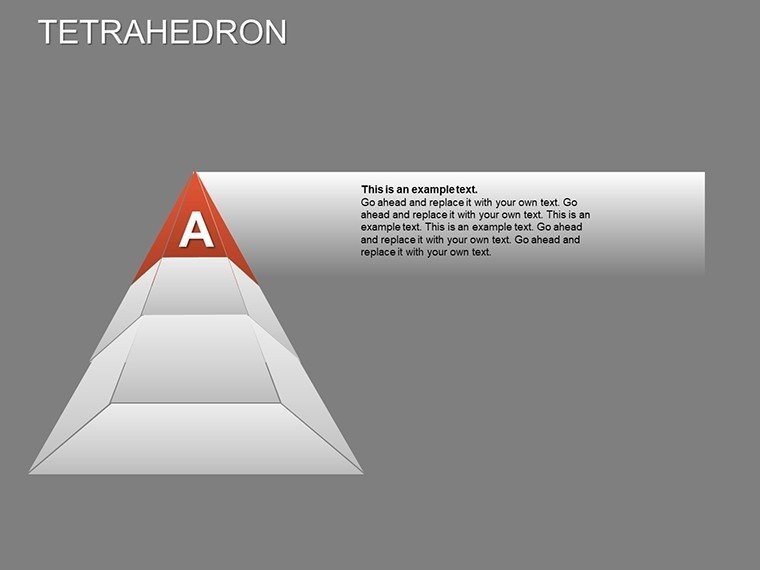
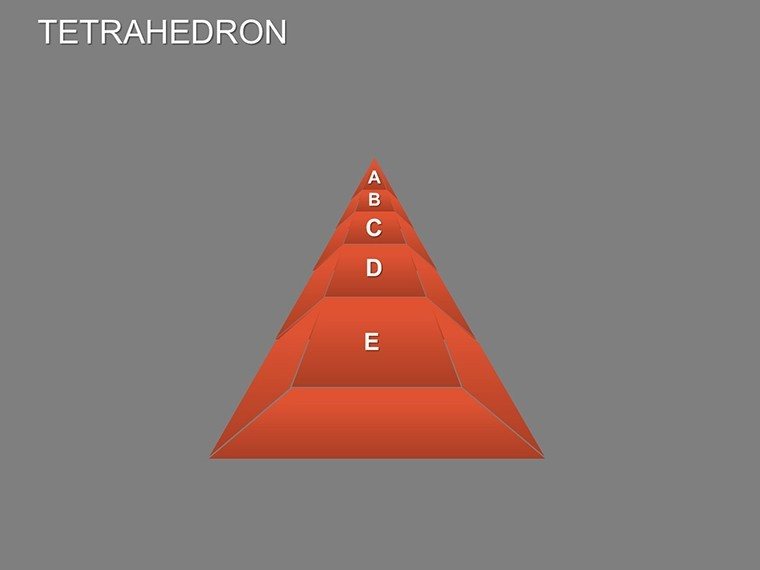
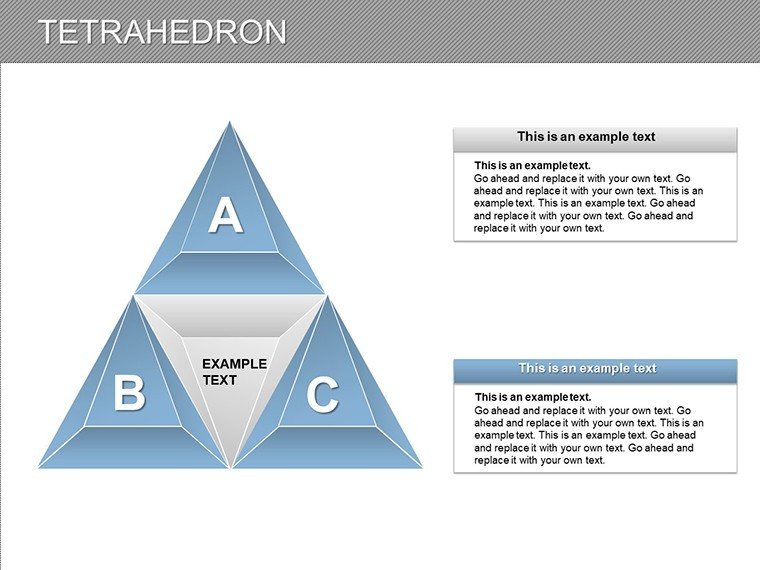
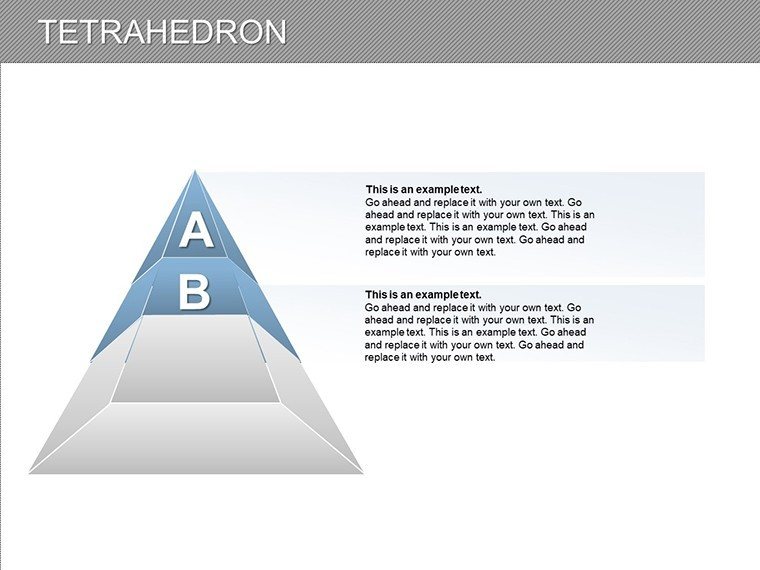
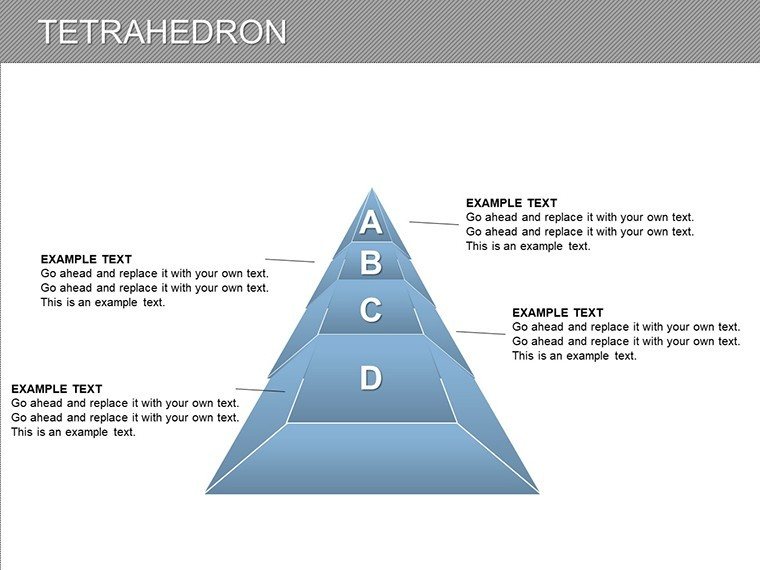
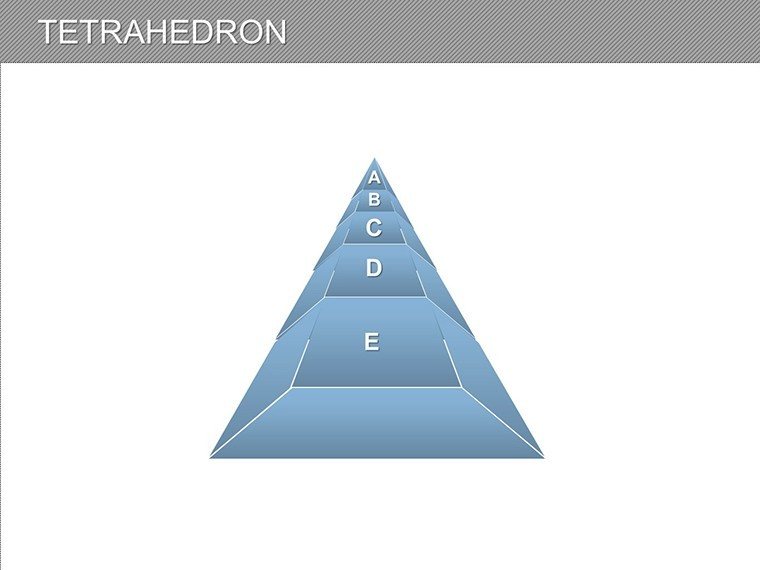
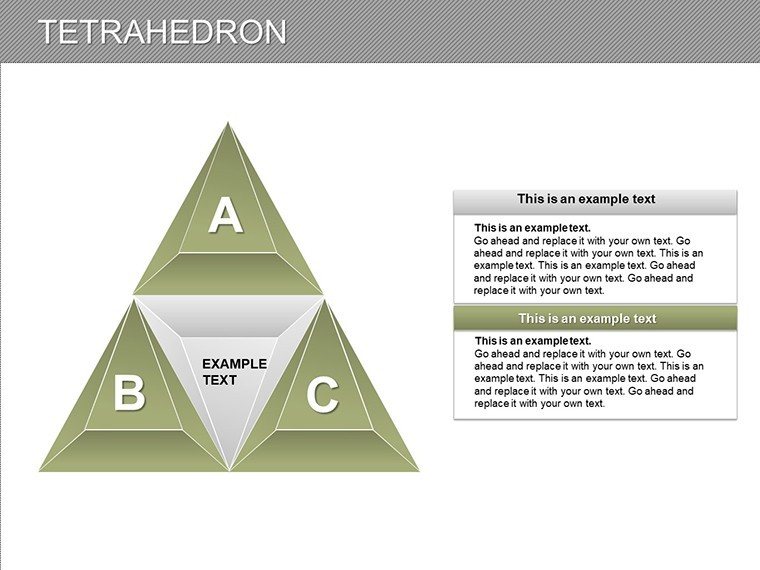
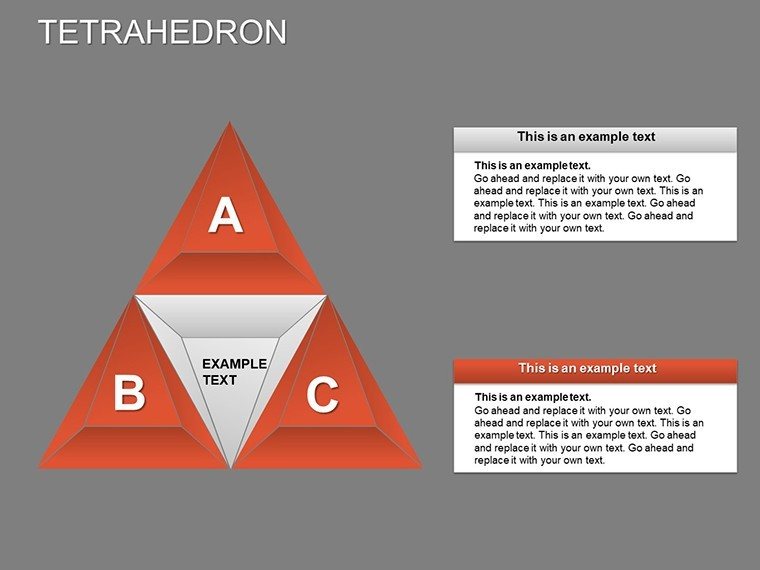
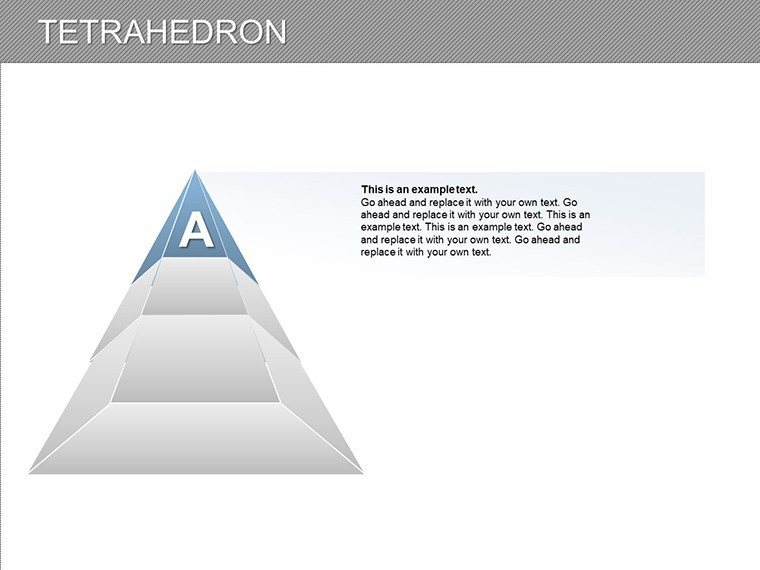
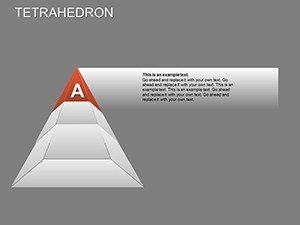
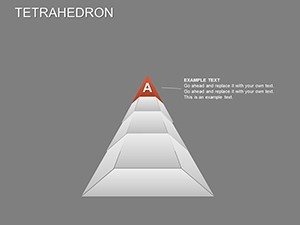
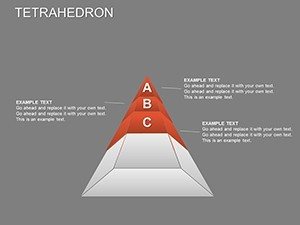
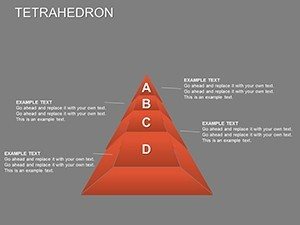
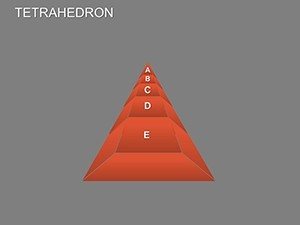
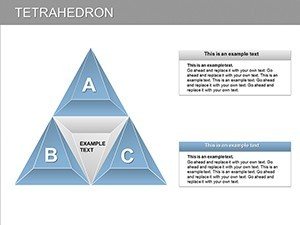
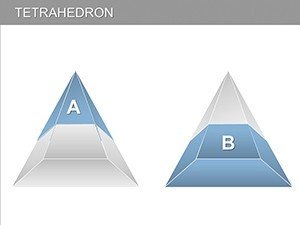
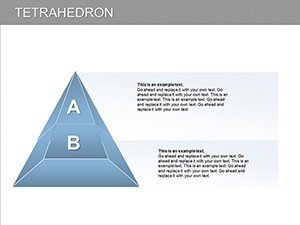
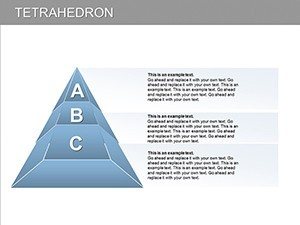
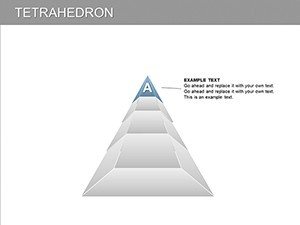
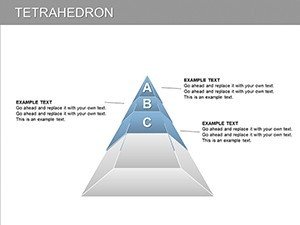
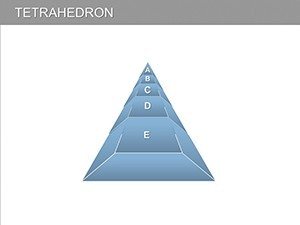
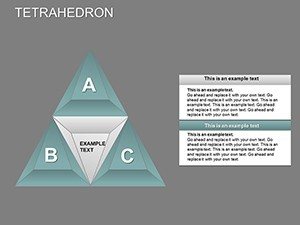
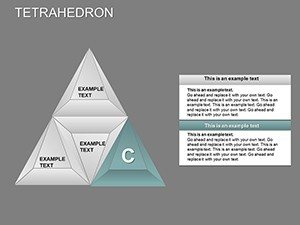
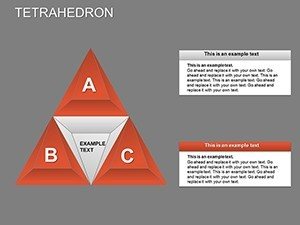
At its essence, the template includes various chart settings, from basic wireframes to shaded solids, allowing for layered visualizations. One standout slide features a rotatable tetrahedron with labeled vertices, perfect for demonstrating symmetry or volume calculations. Others incorporate data overlays, like embedding statistics on face areas or edge lengths, making it a powerhouse for STEM presentations.
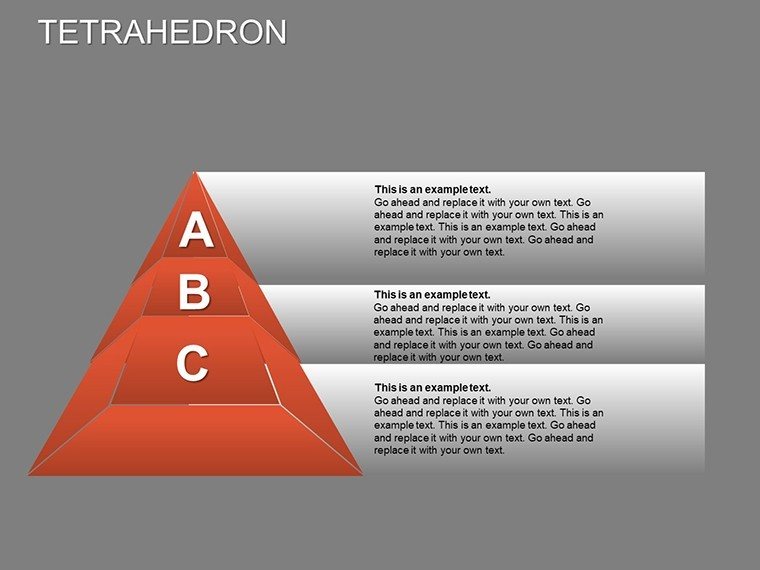
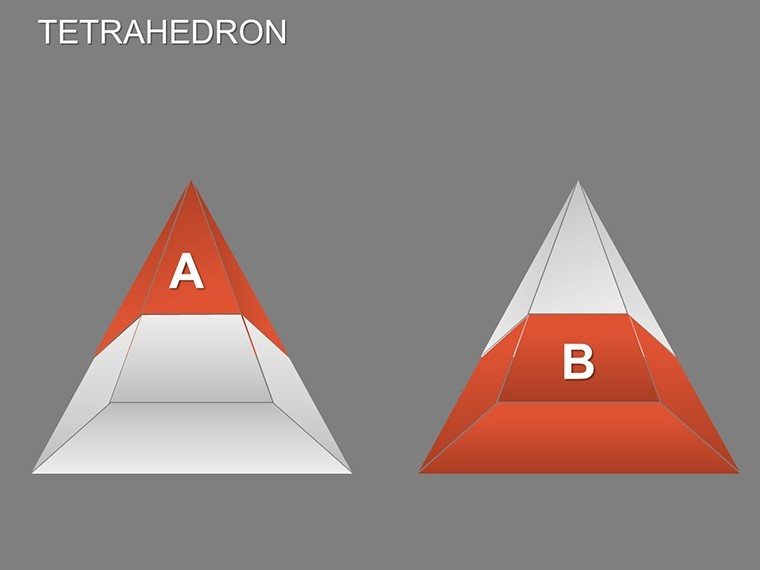
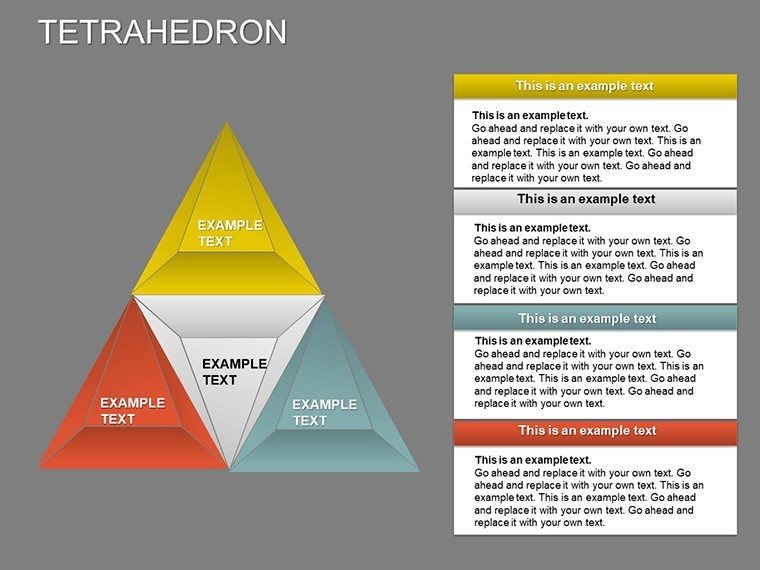
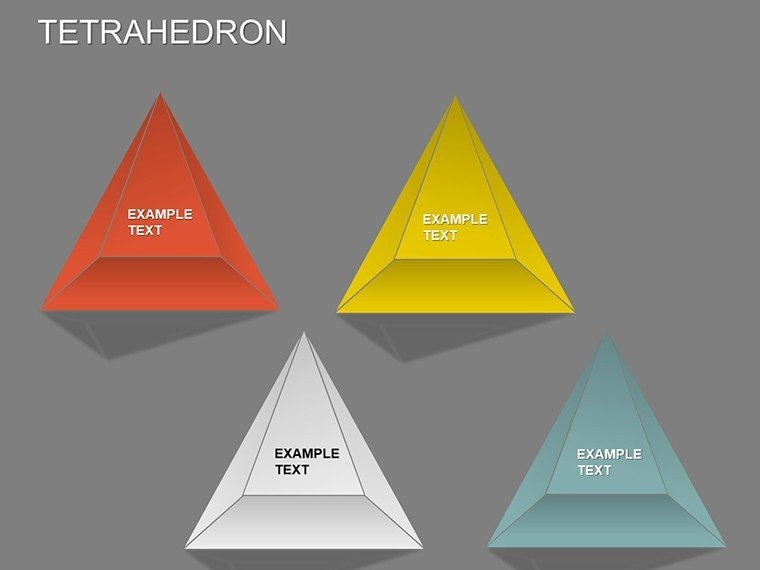
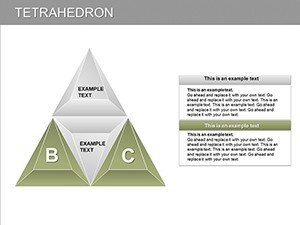
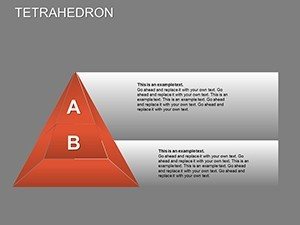
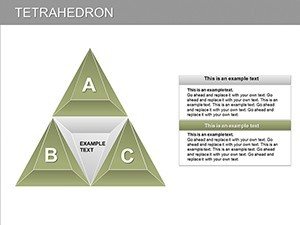
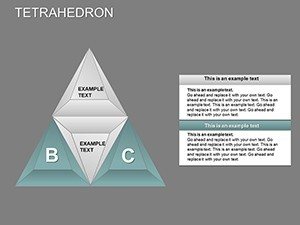
Customization options abound: alter colors to represent different materials in design mocks, resize for scale comparisons, or add textures for realism. Fonts and styles are adaptable, supporting technical notations or bold headlines. This flexibility aligns with expert practices, such as those in the American Mathematical Society's guidelines for visual aids, emphasizing clarity in complex shapes.
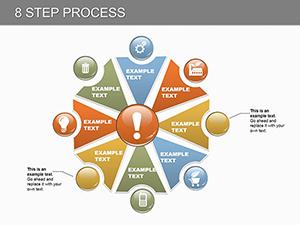
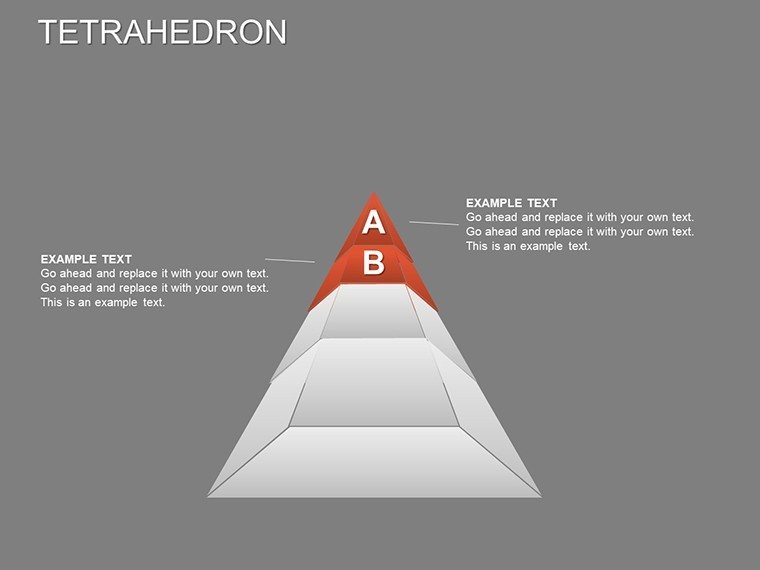
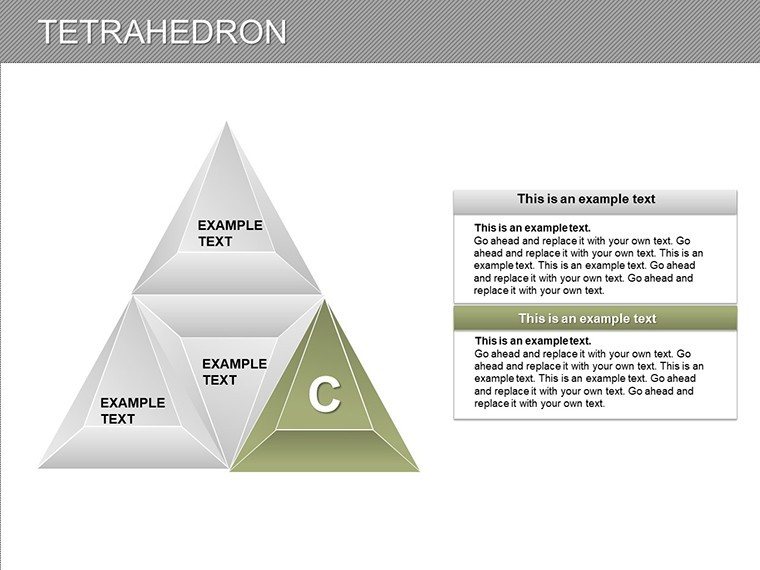
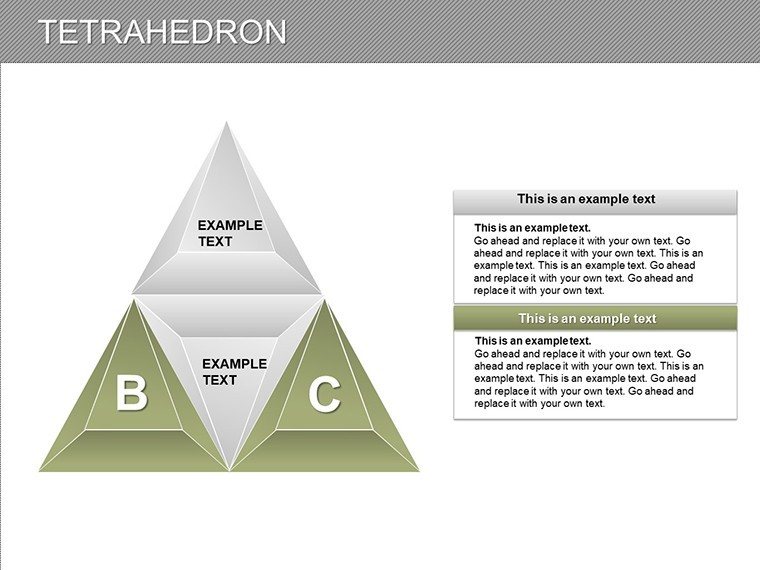
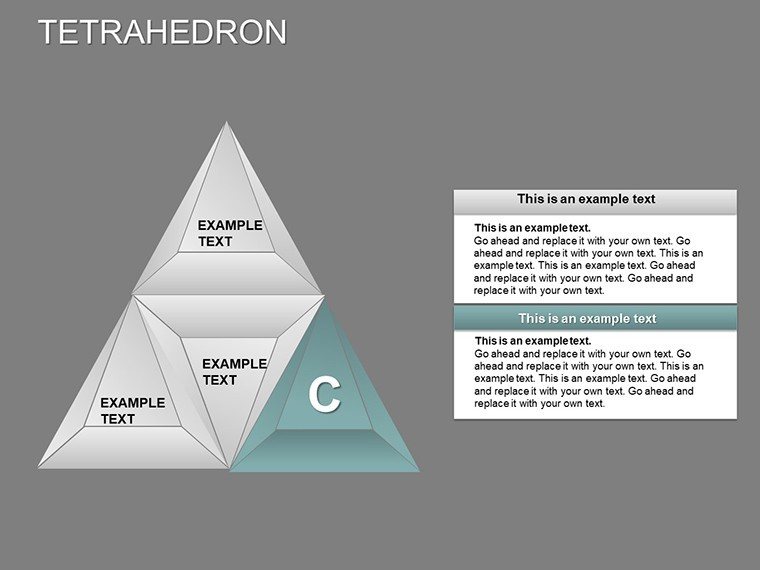
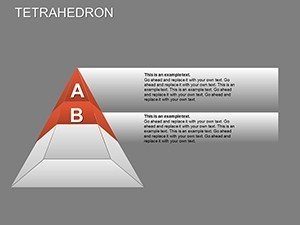
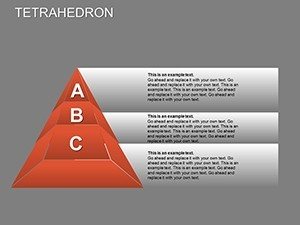
The template's strength lies in its ability to convey spatial relationships. Use exploded views to break down the tetrahedron into triangles, highlighting how each contributes to the whole - ideal for deconstructing problems in project management or biology.
Tailored Use Cases Across Disciplines
In architecture, envision using this for conceptual designs: a tetrahedron chart could model a pavilion's framework, showing stress points and material distributions, akin to Zaha Hadid's innovative structures. Educators in geometry classes can animate rotations to teach Platonic solids, enhancing student comprehension as per studies from the National Council of Teachers of Mathematics.
For engineers, integrate with CAD data to visualize prototypes, such as turbine blades or satellite components, where tetrahedral meshes are common in simulations. Consultants might apply it metaphorically, representing four-pillared strategies in business plans, with each face denoting a key area like innovation or sustainability.
Even in creative fields, like game design, these charts help map 3D environments, ensuring balanced proportions. A real-world example: NASA's use of tetrahedral models in space probe designs, where visual accuracy prevents costly errors.
Workflow Integration and Best Practices
- Start with Basics: Open in PowerPoint and select a base tetrahedron slide.
- Customize Geometry: Adjust angles and scales using built-in tools.
- Add Data Layers: Input values for dynamic updates, like volume formulas.
- Enhance with Effects: Apply shadows or gradients for 3D illusion.
- Export and Share: Compatible with collaborative platforms for team reviews.
This step-by-step approach mirrors workflows in professional software like AutoCAD, but simplified for PowerPoint users, reducing learning curves.
Superior to Standard PowerPoint Shapes
Unlike basic 3D shapes in PowerPoint, which lack depth and editability, this template provides pre-optimized tetrahedrons with mathematical accuracy. No more manual rotations or inconsistent scaling - everything is precise, boosting your by demonstrating technical prowess.
Feedback from users highlights how it simplified conference presentations, with one architect crediting it for winning a bid on a sustainable building project through clear visualizations.
Expert Tips for Tetrahedron Mastery
- Use consistent coloring for faces to denote categories.
- Incorporate animations for revealing layers sequentially.
- Pair with real data from sources like Wolfram Alpha for authenticity.
- Ensure accessibility with high-contrast elements.
- Test in slideshow mode for smooth transitions.
These insights, drawn from design pros, will amplify your template's impact.
Ultimately, our Tetrahedron PowerPoint Charts Template isn't just about shapes - it's about shaping understanding. Whether in classrooms or boardrooms, it bridges the gap between concept and comprehension. Step into 3D excellence - download and innovate today.
FAQ
How many ways can I edit the tetrahedron shapes?
Unlimited - adjust sizes, colors, rotations, and add data overlays freely in PowerPoint.
Is it suitable for non-STEM fields?
Absolutely, use metaphorically for strategies or hierarchies in business and marketing.
Does it support animations?
Yes, built-in options for rotations and reveals to make presentations dynamic.
Can I add my own images to the charts?
Sure, embed textures or photos on faces for customized visuals.
What file format is provided?
.pptx, fully compatible with Microsoft PowerPoint versions.