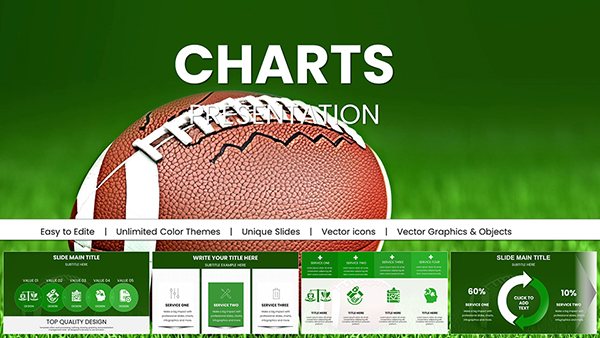
International Sports PowerPoint Charts Template for Dynamic Visuals


Type: PowerPoint Charts template
Category: Illustrations
Sources Available: .pptx
Product ID: PC00134
Template incl.: 20 editable slides
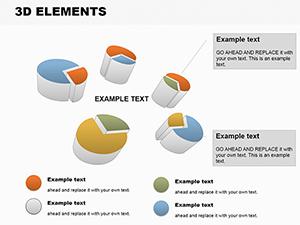
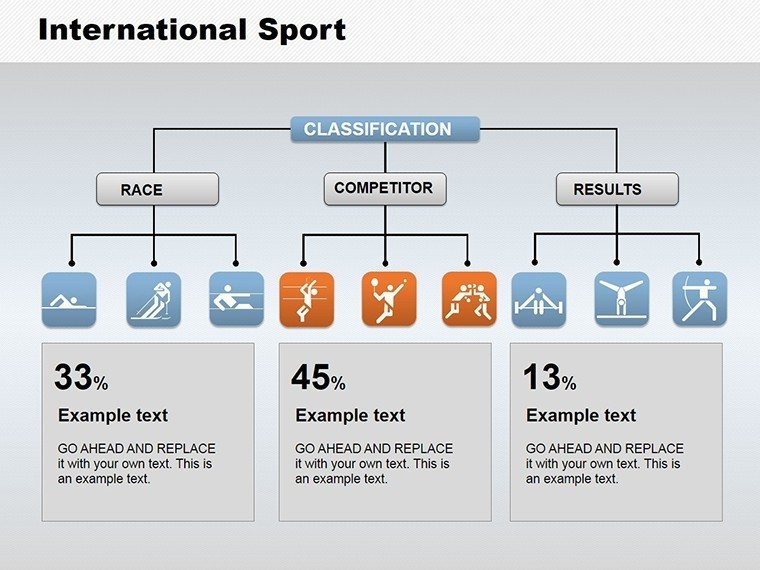
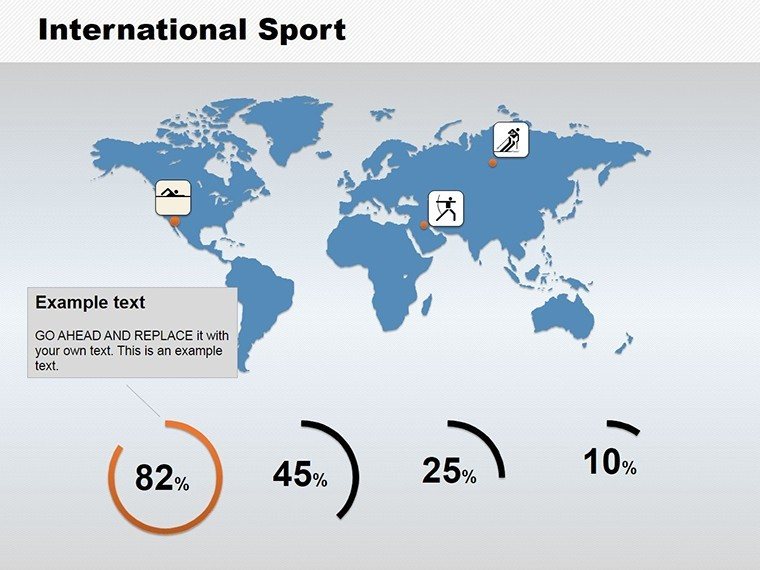
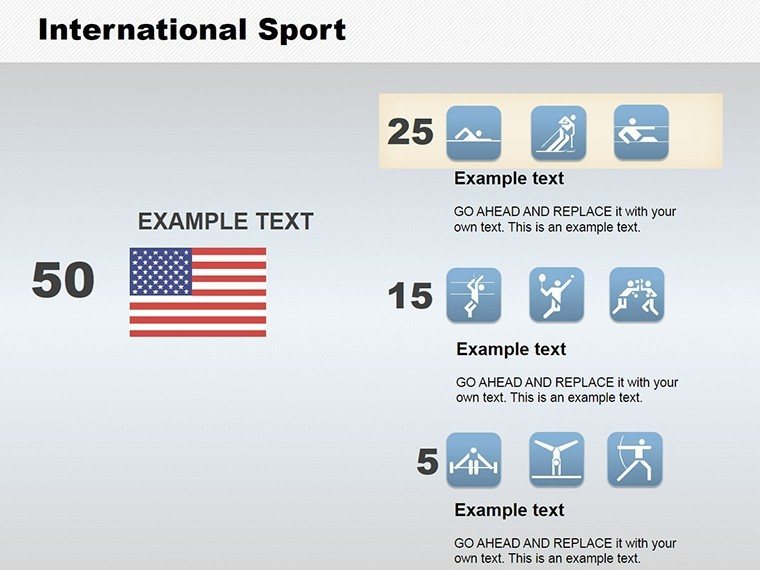
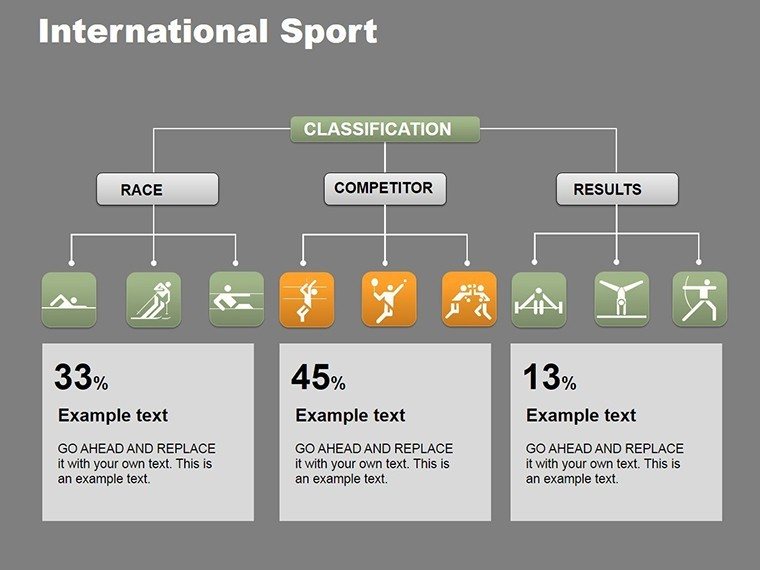
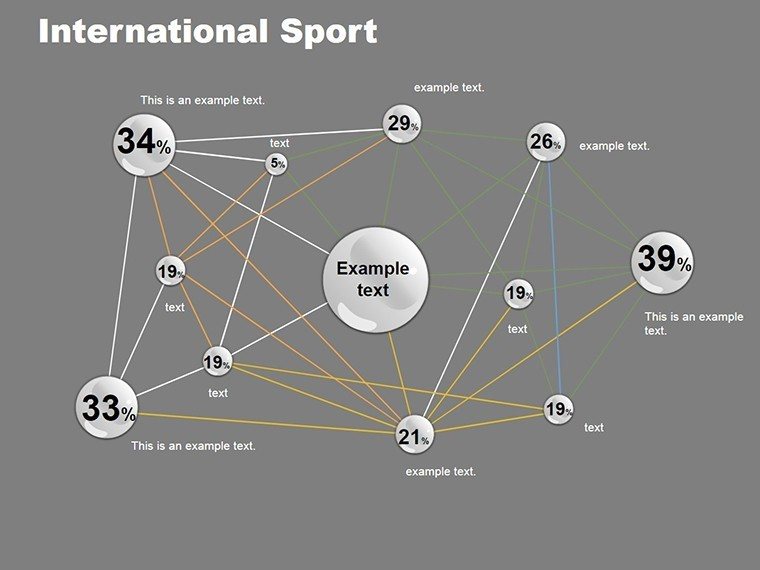
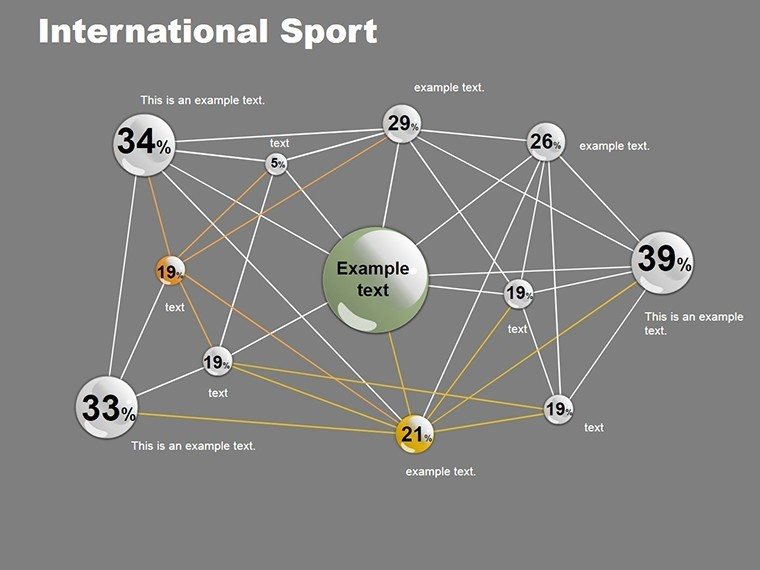
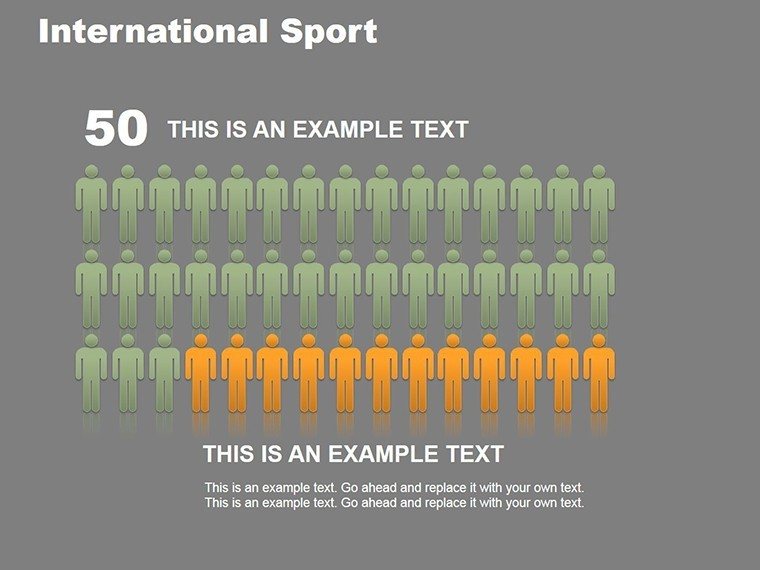
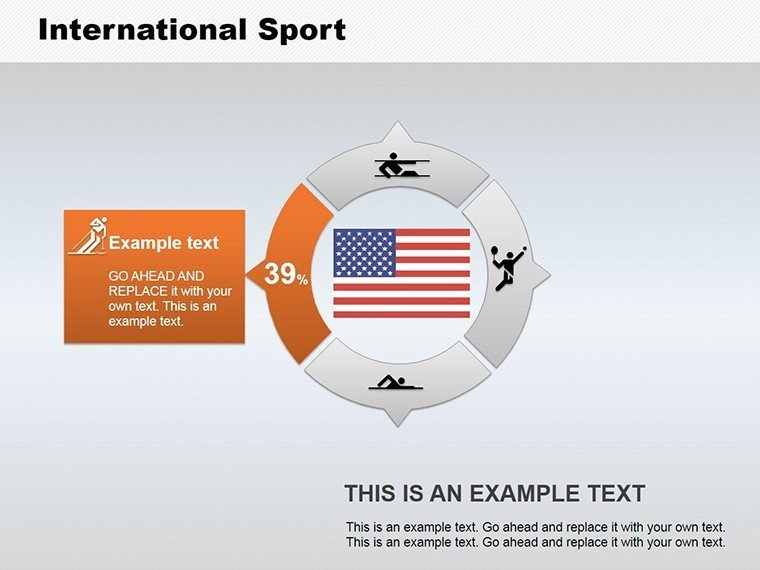
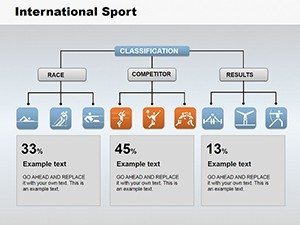
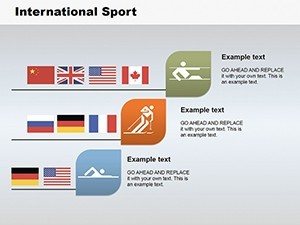
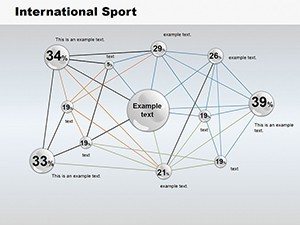
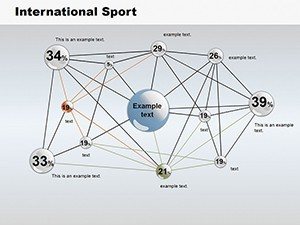
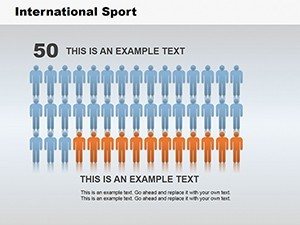
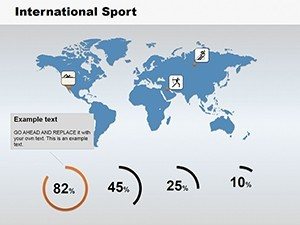
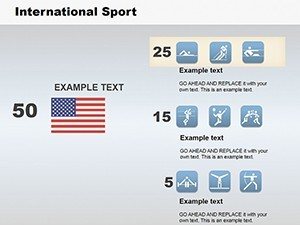
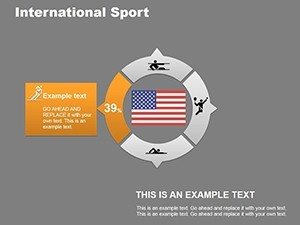
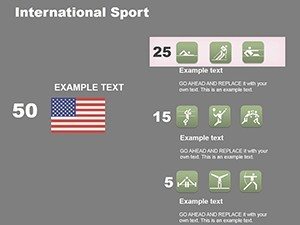
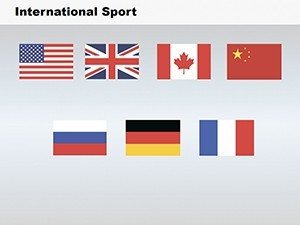
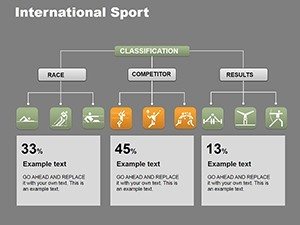
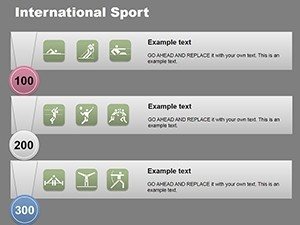
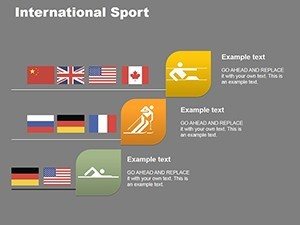
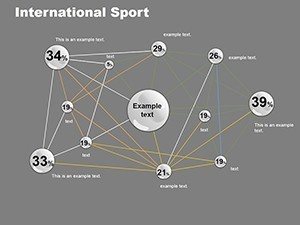
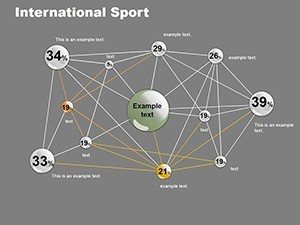
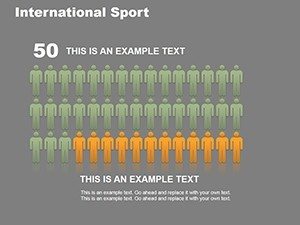
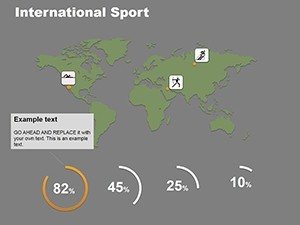
In a world where sports data tells epic stories, our International Sports PowerPoint charts template energizes your presentations with 20 editable slides blending bar graphs, pie charts, and illustrative graphics. Tailored for coaches analyzing team stats, journalists covering global events, or educators teaching Olympic histories, it infuses athletic themes to make numbers pulse with excitement. Visualize medal tallies by country in a vibrant pie or track athlete performances via bar trends - all customizable for your narrative. Compatible with PowerPoint and Google Slides, it features sport-inspired icons like runners or balls, ensuring thematic coherence. Grounded in data journalism principles from outlets like ESPN, this template not only clarifies complex stats but sparks discussions, whether in boardrooms or classrooms, turning dry figures into motivational tales.
Energizing Features for Sports Enthusiasts
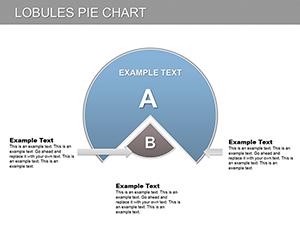
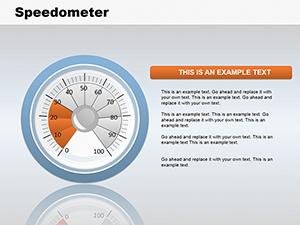
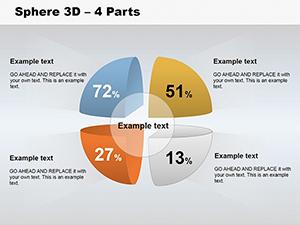
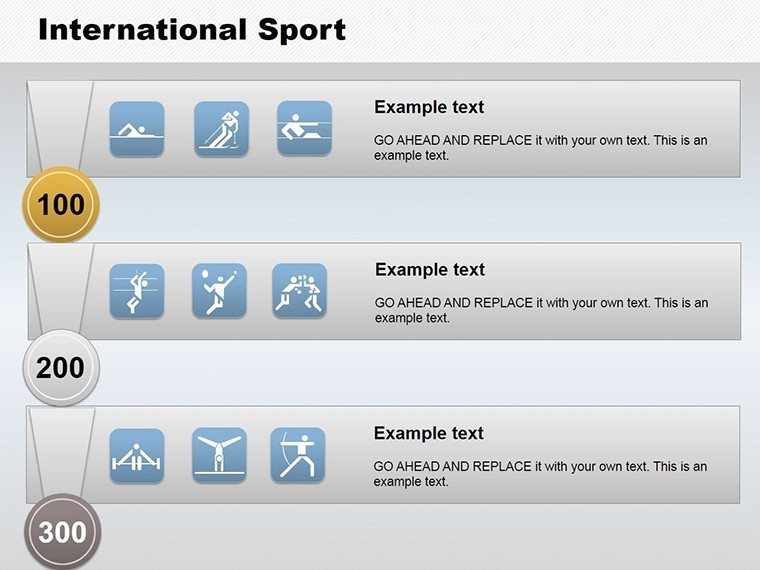
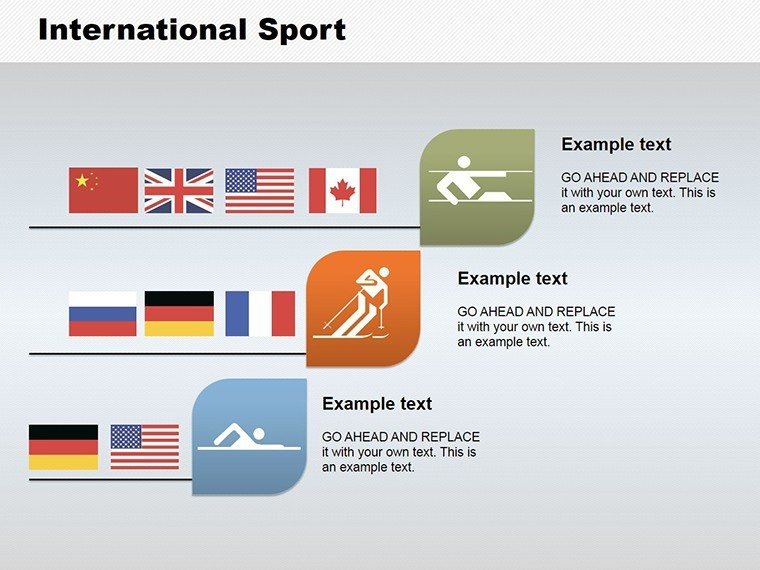
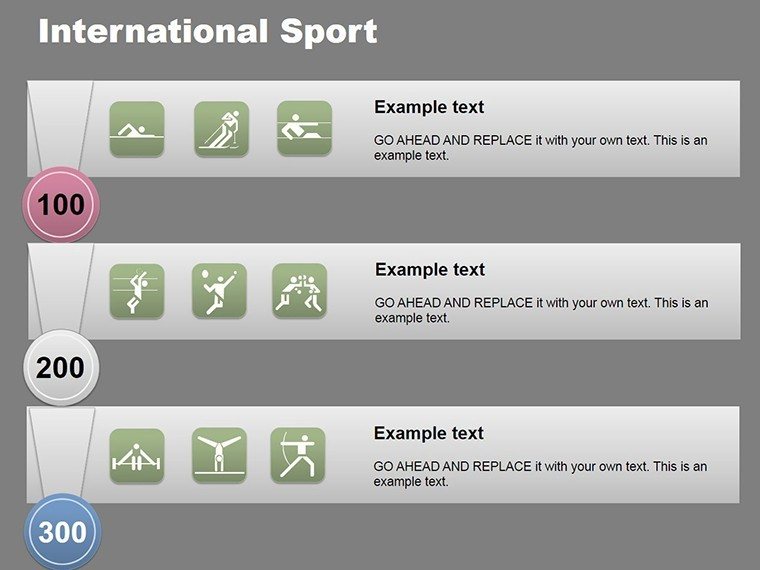
Key to its appeal are diverse chart types infused with global sports motifs, from soccer fields in backgrounds to Olympic rings accents, all scalable without distortion.
Customization with Athletic Flair
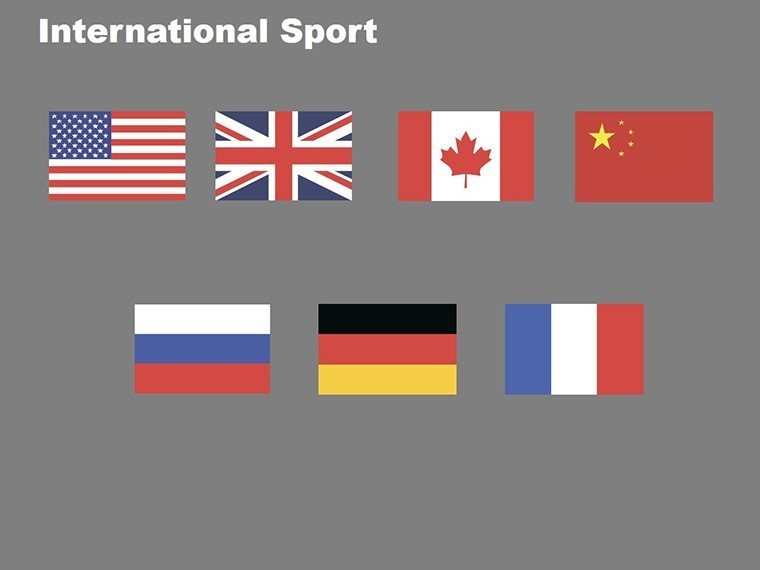
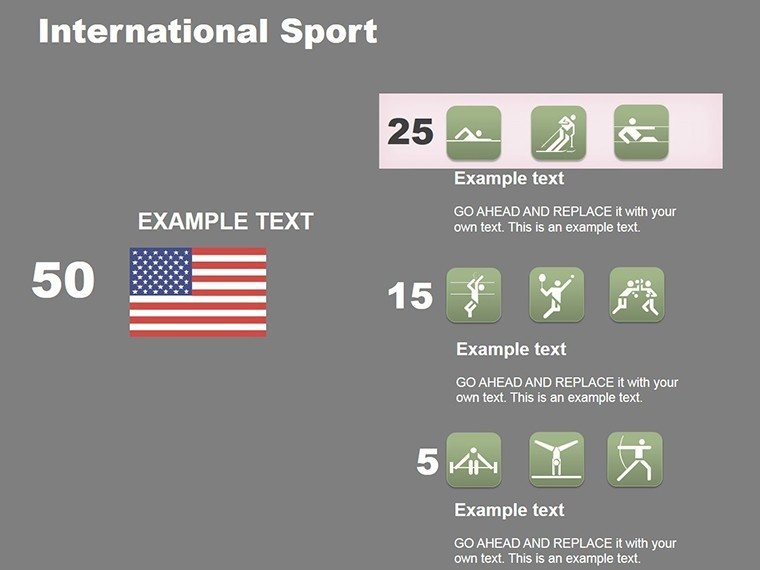
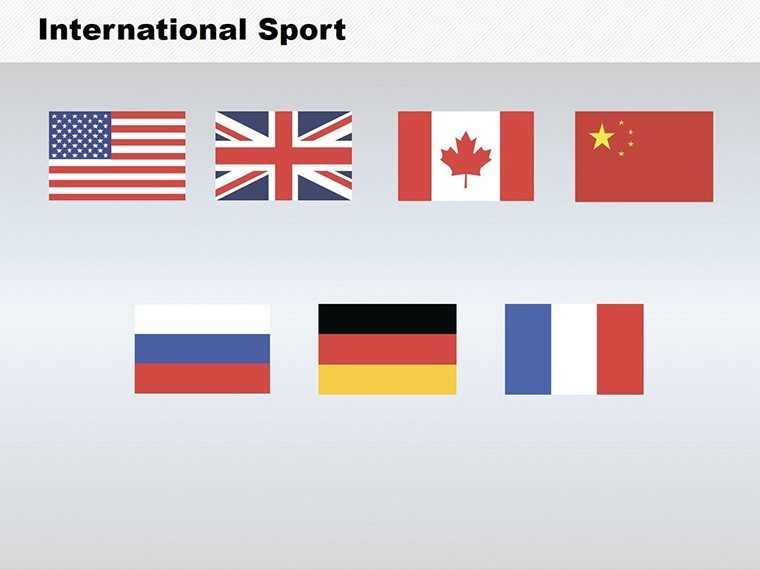
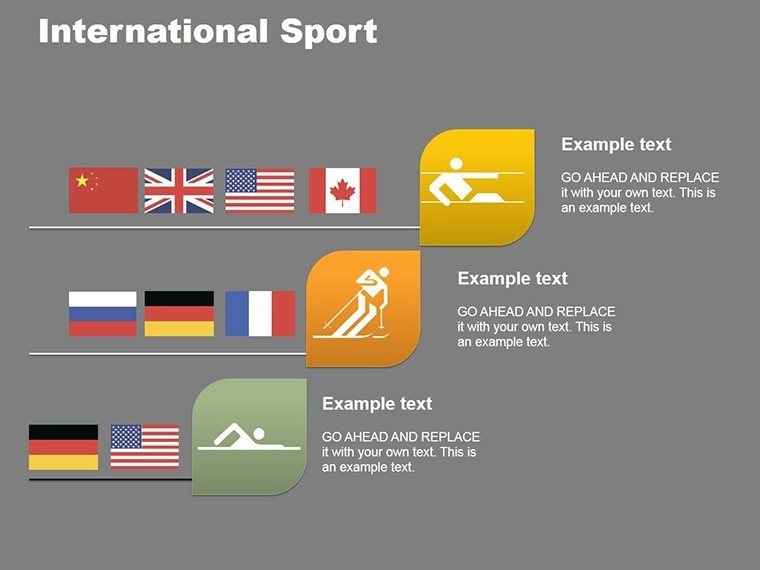
Tweak fonts to mimic jersey styles, color pies by national flags, or add animations simulating race finishes. For a sports agent, adapt a slide to show client endorsement deals across continents.
Benefits That Score Big
It boosts audience retention through thematic relevance, outperforming plain charts by weaving in cultural elements that resonate internationally.
Superior to Generic Options
Unlike basic templates, these include layered illustrations for depth, like overlaying stats on stadium images.
Applications in the Sports Arena
Professionals can pitch sponsorships with revenue breakdowns; educators illustrate doping trends in ethics classes; enthusiasts map fan demographics for club strategies, as in a FIFA World Cup analysis boosting engagement.
- Download and select a sports-themed chart.
- Populate with event data.
- Customize icons and colors.
- Animate for dramatic reveals.
- Present to inspire action.
Integrating into Sports Workflows
Sync with analytics tools like Strava for real-time athlete data or embed in apps for fan interactions.
Tips to Win with Sports Visuals
Balance excitement with accuracy; use high-contrast for outdoor views; draw from IOC guidelines for fair representation. Update seasonally for events like the Olympics.
Score your presentation goals - download this sports charts template and champion your data today.
Frequently Asked Questions
How themed are the graphics?
Highly themed with international sports icons, customizable for specific events.
Can I use it for e-sports data?
Yes, adaptable for digital sports trends and stats.
Is data linking supported?
Link to spreadsheets for auto-updates in charts.
What sports are represented?
Global variety including soccer, athletics, and team sports.
Are there timeline charts included?
Yes, for tracking historical sports achievements.