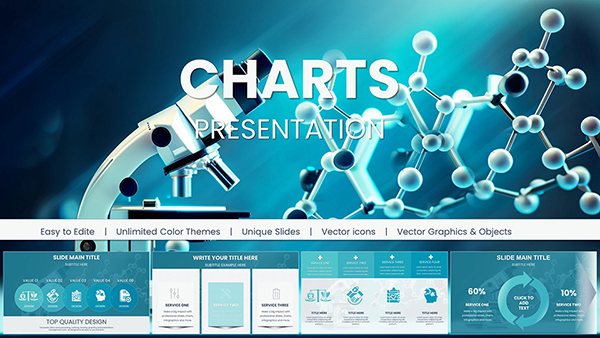
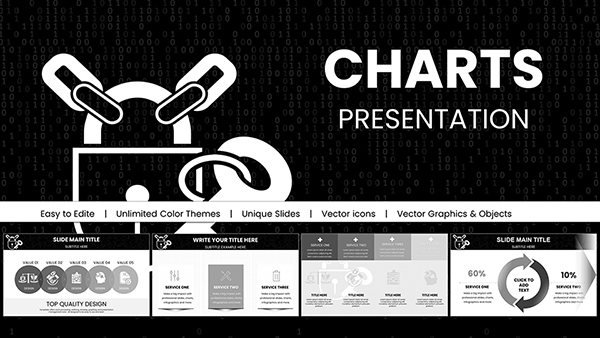
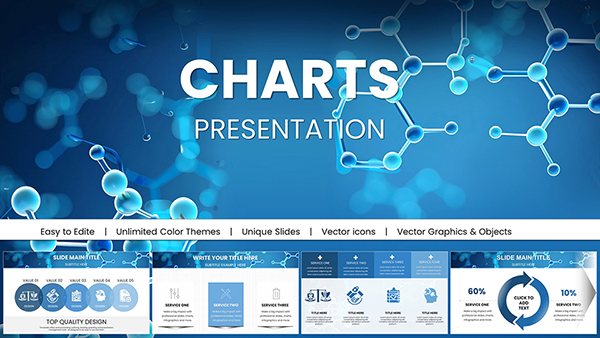
Innovative Tape Illustrations PowerPoint Charts Template


Type: PowerPoint Charts template
Category: Illustrations
Sources Available: .pptx
Product ID: PC00126
Template incl.: 8 editable slides
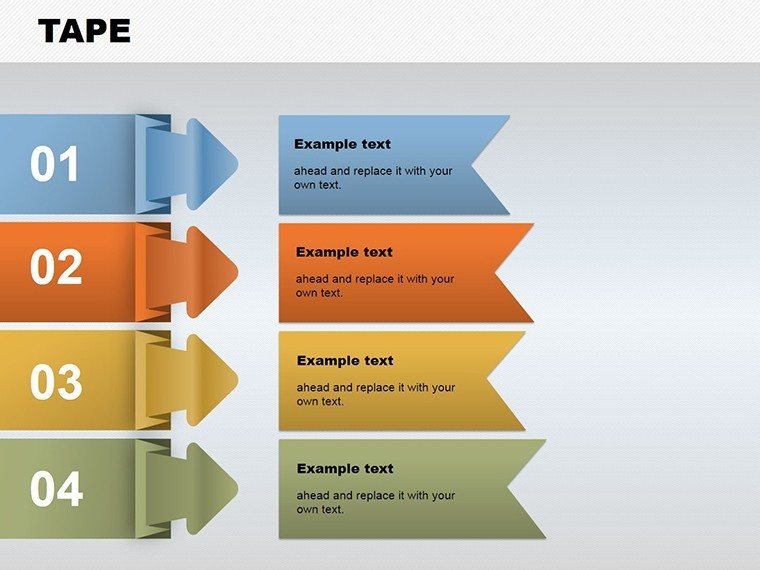
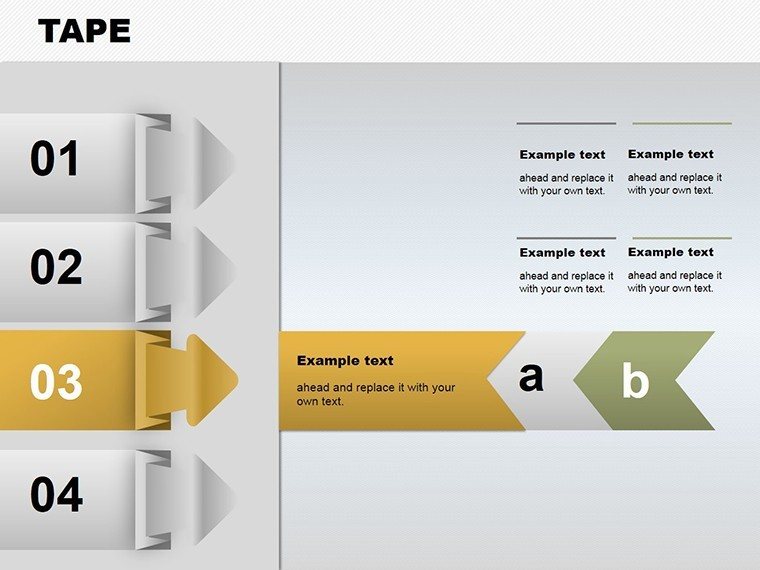
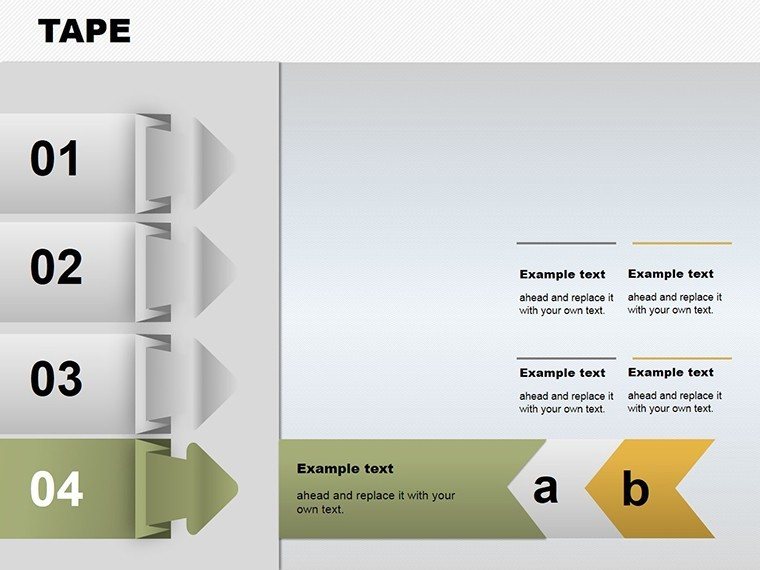
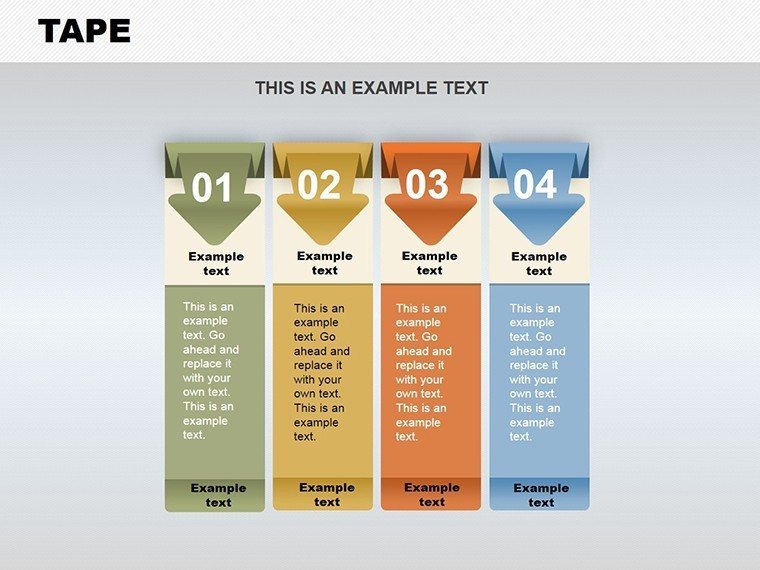
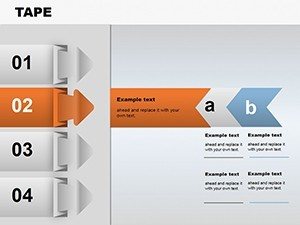
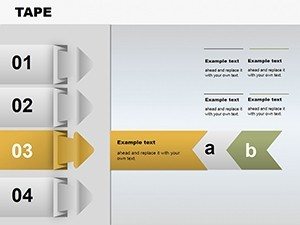
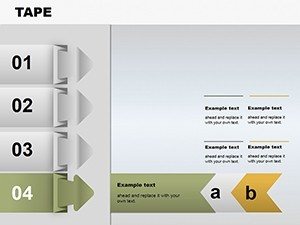
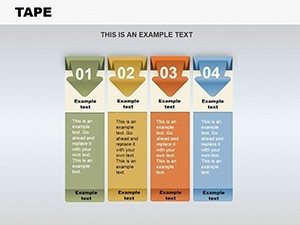
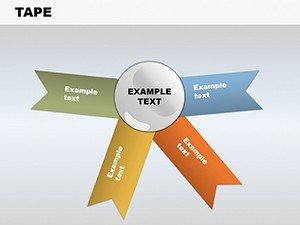
Visualizing processes doesn't have to be linear or dull - enter the Tape Illustrations PowerPoint Charts Template, a fresh take on conveying logical flows and analyses. With 8 editable slides, this template uses unique tape motifs to represent menus, workflows, or complex logical operations like conjunction and implication. Ideal for operations managers, financial analysts, or educators dissecting decision trees, it transforms abstract logic into tangible, memorable visuals that spark understanding.
Think of a logistics firm mapping supply chain decisions: using tape illustrations to depict branching paths based on variables like cost or time, akin to flowchart examples in process mapping. Fully compatible with PowerPoint and Google Slides, you can tweak designs to fit your narrative, adding a distinctive flair that sets your presentation apart. This approach not only clarifies intricate ideas but also engages audiences, making it a go-to for dynamic discussions in boardrooms or classrooms.
Standout Features for Process Mastery
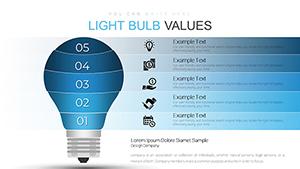
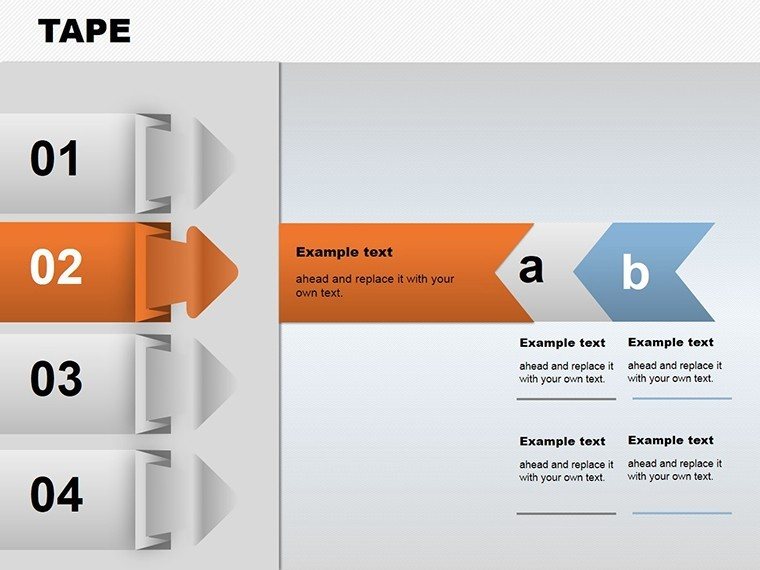
The template's strength lies in its specialized charts for logical operations - disjunction for alternatives, equivalence for balances - perfect for solving puzzles in operations or finance. Unlike generic flowcharts, the tape design adds a metaphorical layer: unrolling paths like tape, revealing steps progressively. Customize with colors to denote urgency or icons for context, such as currency symbols for financial tapes or arrows for process directions.
Benefits include streamlined communication of complex expressions, reducing misinterpretations in team settings. In education, it aids in teaching Boolean logic; in business, for risk assessment matrices disguised as tape rolls. Compared to basic PowerPoint shapes, this offers pre-configured logic gates, saving design effort while ensuring professional polish.
Diverse Applications Drawn from Practice
Real-world utility shines in scenarios like swimlane diagrams for cross-departmental processes or SIPOC for high-level overviews, as seen in operational excellence case studies. A financial advisor might use tape charts to illustrate investment logic: if-then implications for market scenarios. Educators can break down algorithms, fostering interactive learning. The template's adaptability extends to comparisons, like train lengths for rolling stock analysis, providing creative metaphors that resonate.
To weave it into your workflow, begin by outlining your process - identify key operations and branches. Populate the tape slides with text or data, using animations to "unroll" information. Enhance with real examples: in architecture, tape for sequencing construction phases, aligning with project management standards. This not only enriches content but adheres to best practices in visual process mapping.
Guided Steps to Craft Compelling Narratives
- Map Your Logic: Define operations like inversion or conjunction central to your analysis.
- Design the Tape: Choose layouts that flow like unspooling tape, adding branches for decisions.
- Infuse Creativity: Incorporate metaphors - stacks of coins for finance, trains for logistics.
- Animate for Impact: Reveal elements sequentially to build suspense and clarity.
- Validate Flow: Test for logical coherence, refining for audience comprehension.
Inspired by tools like value stream maps, these steps ensure your presentations deliver value, much like in consulting where logic models clarify strategies.
Elevating Ideas Through Visual Innovation
This template fosters trust by grounding abstracts in visuals, essential for fields demanding precision. In operations, it means better process adherence; in finance, sharper insights. With in mind, designs reflect expert methodologies, boosting your authoritative voice.
Unroll new possibilities with the Tape Illustrations PowerPoint Charts Template. Innovate your processes - grab it now and tape together success!
FAQ
- What logical operations are covered?
- Includes conjunction, disjunction, inversion, implication, and equivalence for comprehensive analysis.
- Suitable for financial presentations?
- Yes, great for depicting monetary flows or decision trees with creative metaphors.
- How customizable is the design?
- Fully - edit tapes, colors, and layouts to match your theme.
- Can it handle complex processes?
- Absolutely, ideal for branching logics in operations or education.
- Compatible with Google Slides?
- Yes, seamless integration for collaborative work.