Analytic Flower PowerPoint Charts Template Presentation


Data presentation doesn't have to be stark and sterile; it can bloom with creativity. Our Analytic Flower PowerPoint Charts Template merges analytical rigor with floral motifs across 14 editable slides, making it ideal for financial analysts, market researchers, or corporate trainers who want to infuse warmth into numbers. Inspired by biophilic design trends from sources like the American Society of Interior Designers, this template uses petal structures to frame graphs, turning market trends into visually soothing narratives. Whether depicting quarterly earnings in a petal-chart or forecasting growth with blooming infographics, it helps audiences grasp complex data intuitively, enhancing retention and appeal in settings from small team huddles to large conferences.
The Blooming Fusion of Aesthetics and Analytics
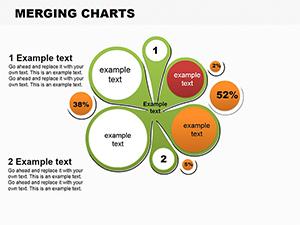
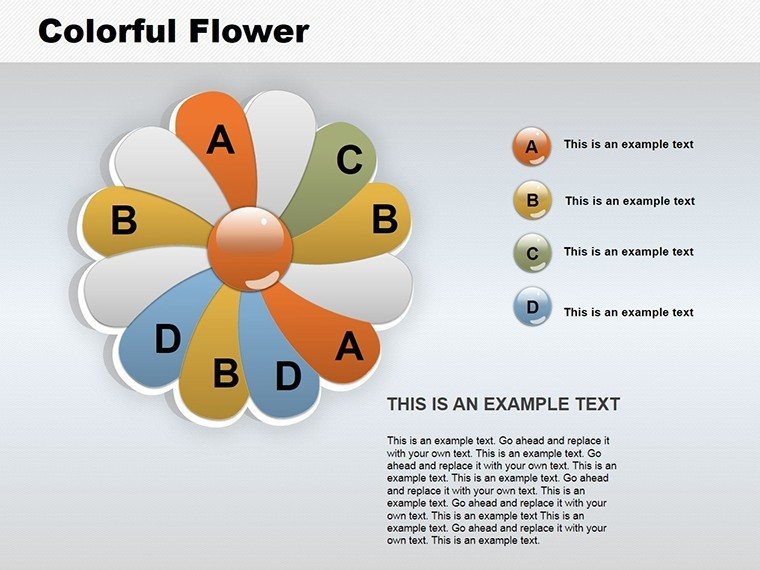
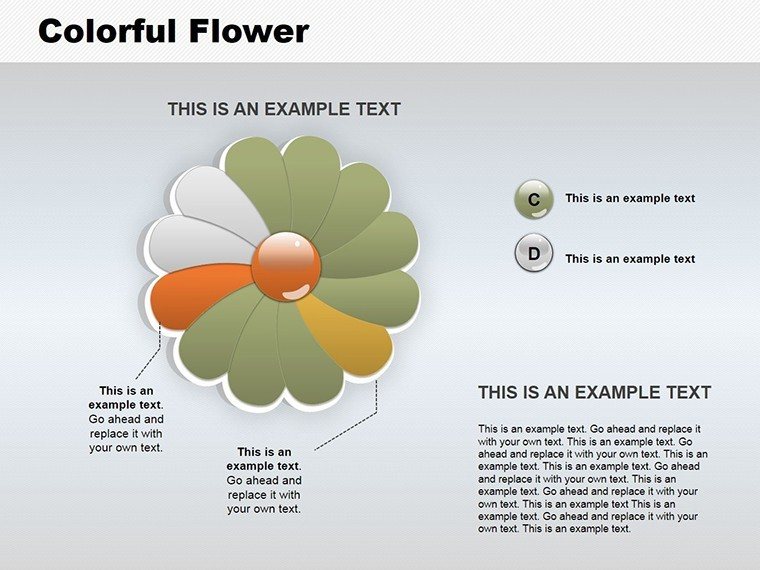
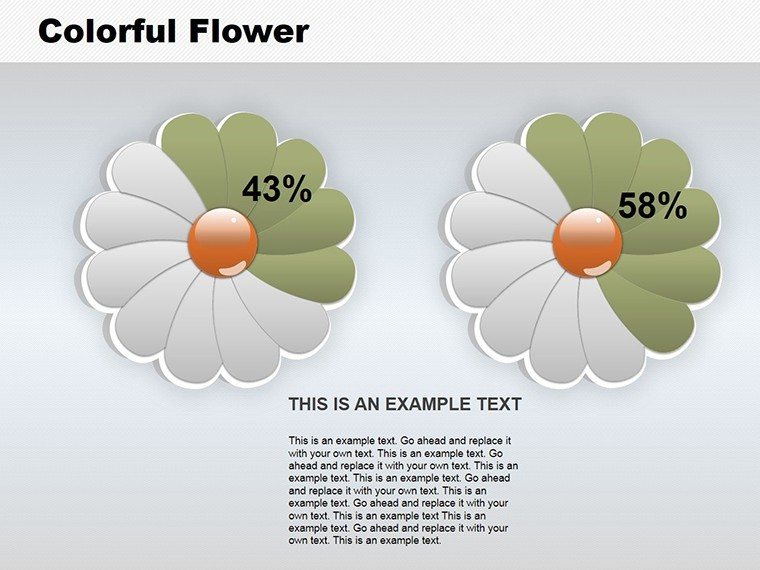
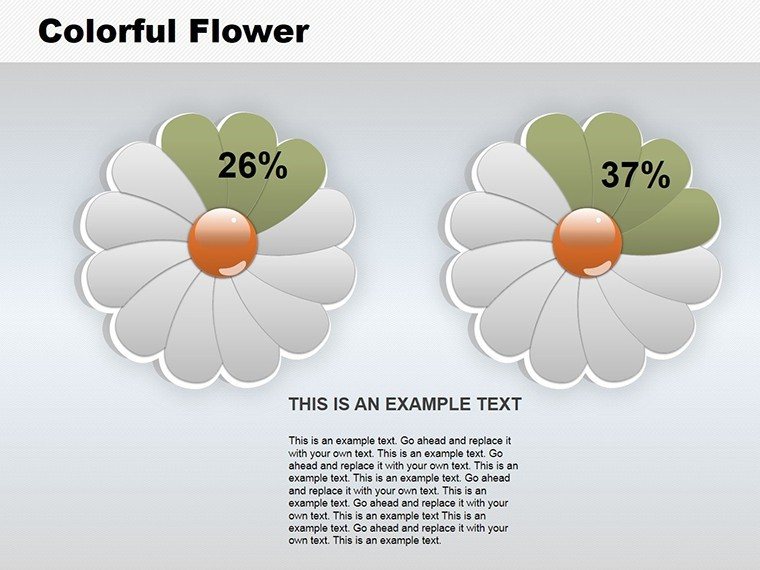
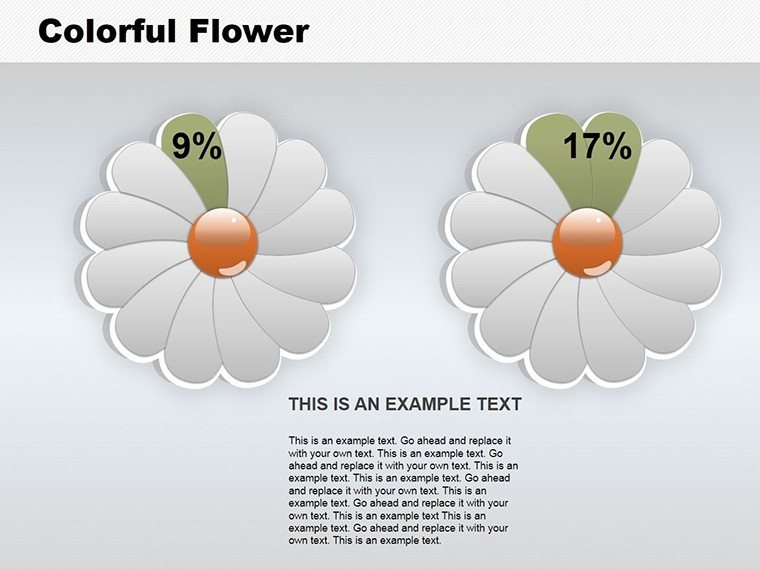
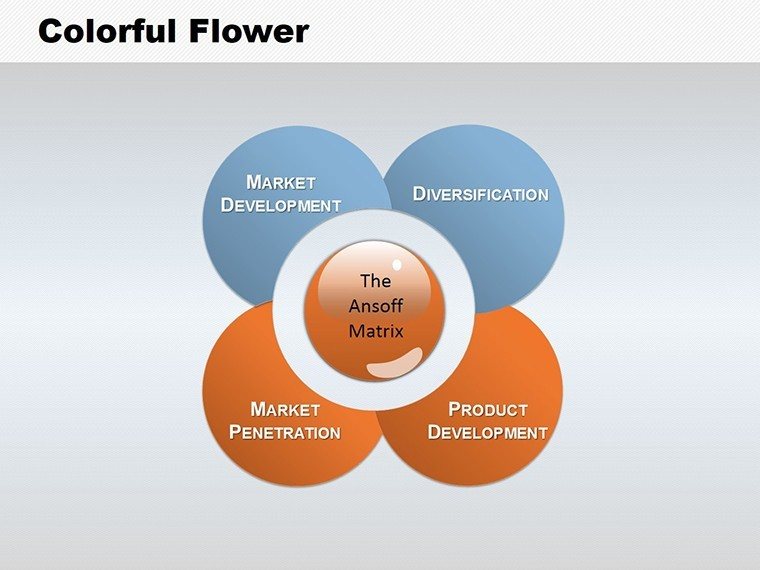
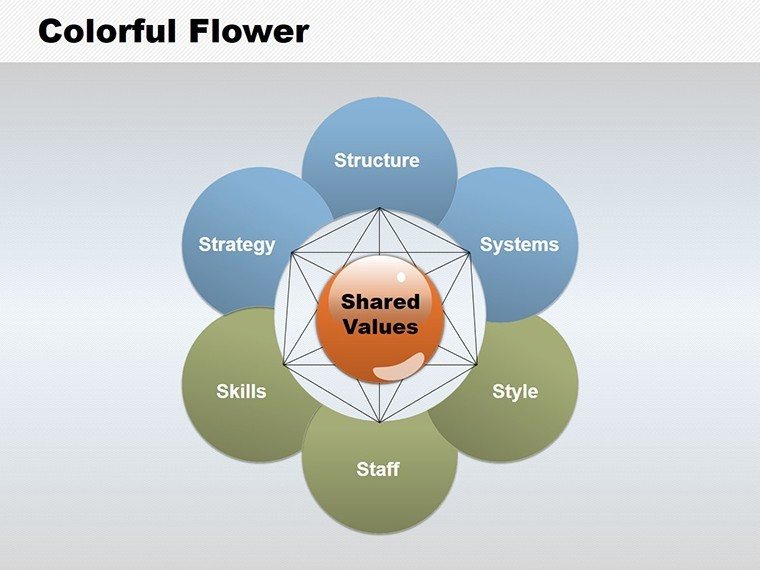
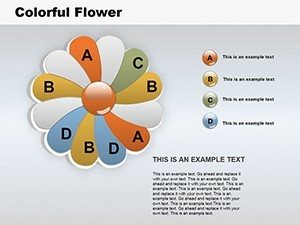
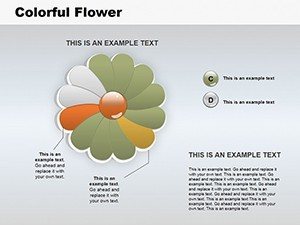
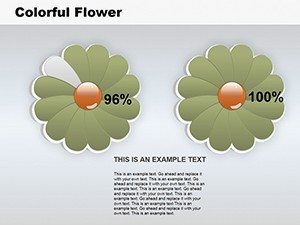
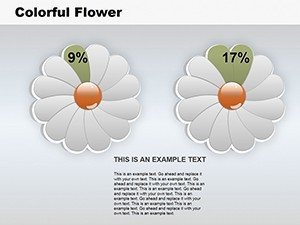
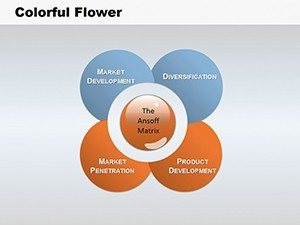
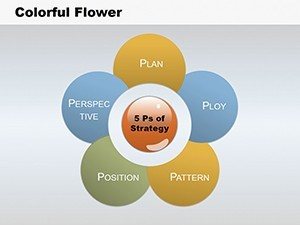
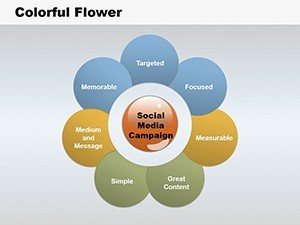
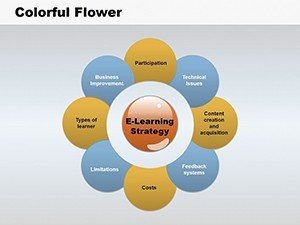
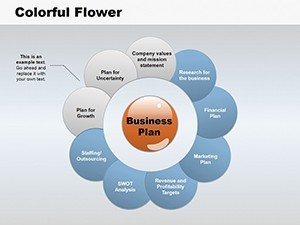
This template's unique floral framework sets it apart, with slides progressing from simple overviews to detailed analyses. Initial slides feature basic flower charts where petals represent data segments, perfect for pie-like distributions. Deeper in, you'll find layered blooms integrating line graphs for trend lines emerging from stems, symbolizing growth. Drawing from nature-inspired visualization techniques, like those in Edward Tufte's data art principles, these designs reduce visual clutter while adding thematic coherence. For a market trend report, use a flower matrix to petal-out consumer segments, perhaps echoing Unilever's sustainability reports for eco-friendly branding.
Customization is effortless, with options to alter petal colors, add multimedia like videos of blooming animations, or adjust scales for precise data fitting. The user-friendly setup allows quick insertions of images or audio, enriching presentations. For corporate use, match the color scheme to your brand, ensuring a polished, trustworthy look that aligns with professional standards.
Core Features for Vibrant Data Stories
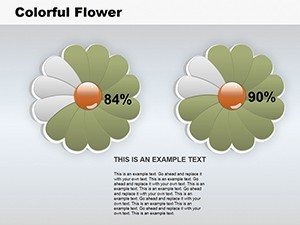
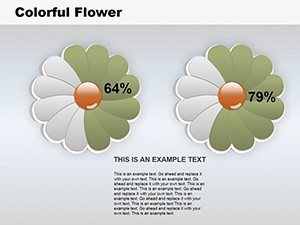
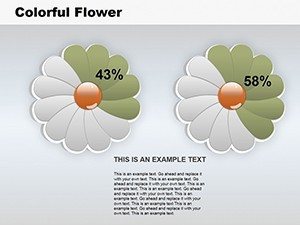
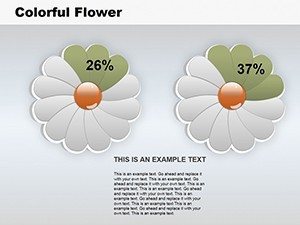
- Floral Chart Designs: Elegant petal-based visuals for intuitive data representation.
- Multimedia Integration: Embed images, videos, and audio to enhance engagement.
- Custom Color Palettes: Adapt schemes to fit themes or branding seamlessly.
- Pre-Designed Efficiency: Ready slides speed up creation without compromising quality.
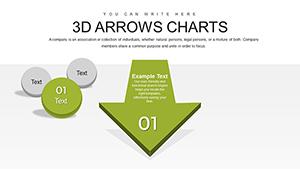
- Versatile Graphs: Includes matrices and pies within floral frames.
These elements, combined with subtle icons like leaves for growth, position the template as an expert choice for aesthetically driven analytics.
Applications That Let Your Data Flourish
In action, this template thrives in financial reviews, using flower pies to allocate budgets visually. Process: Select a slide, input data, customize petals, and add animations for dynamic reveals. Small businesses can present sales trends with blooming graphs, while corporations analyze global markets with multi-petal matrices.
Tips: Pair soft pastels for calming effects and limit data points per flower for clarity. Superior to basic charts, the floral theme adds emotional resonance, improving persuasion. Integrate into workflows via cloud sharing for collaborative edits.
Expert Advice for Blooming Presentations
- Choose thematic relevance: Use flower motifs for growth-oriented topics like expansion plans.
- Balance elements: Ensure data dominates while aesthetics support.
- Incorporate multimedia: Add subtle sounds for immersive experiences.
- Reference trends: Cite sources like Bloomberg for data credibility.
- Review for harmony: Test color schemes for accessibility.
These strategies ensure your presentations not only inform but enchant.
Let Your Ideas Bloom Today
Embrace the fusion of beauty and brains with this template. Customize now and watch your data presentations flourish. Download for inspired analytics!
Frequently Asked Questions
How do I add multimedia to slides?
Easily insert images, videos, or audio via PowerPoint's insert menu within the floral frames.
Is the floral theme editable?
Yes, fully - change designs, colors, or remove elements as needed.
Suitable for non-business uses?
Certainly, adaptable for educational or personal data visuals.
What PowerPoint versions work?
Compatible with 2010 and later versions.
Can I expand the slide count?
Yes, duplicate and modify for larger sets.