BCG Matrix PowerPoint Template: Strategic Insights Unleashed


Strategic decision-making in business demands tools that clarify complexity, and our BCG Matrix PowerPoint Charts template delivers just that. With 13 meticulously crafted editable slides, this resource is tailored for professionals navigating product portfolios or business units. Rooted in the Boston Consulting Group's timeless framework, it categorizes elements into Stars, Cash Cows, Question Marks, and Dogs, enabling users to pinpoint growth opportunities and resource allocations. Envision a product manager at a consumer goods company using these charts to evaluate market positions during a strategy session, or a consultant advising on divestments - our template turns abstract analyses into actionable visuals. Drawing from authoritative sources like the original BCG publications and modern adaptations in Harvard Business School case studies, it ensures your presentations reflect expertise. This isn't merely about plotting points; it's about storytelling that drives organizational change. Fully compatible with PowerPoint and Google Slides, it fits seamlessly into your workflow, whether for boardroom discussions or virtual workshops. Embrace a tool that not only saves time but elevates your analytical prowess, making you the go-to expert in strategic planning.
Harness the BCG Framework for Portfolio Mastery
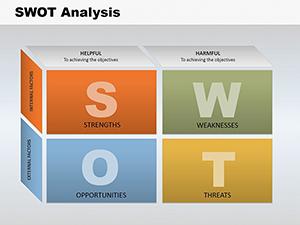
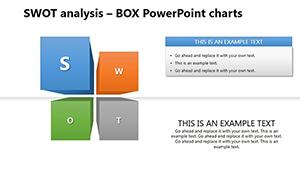
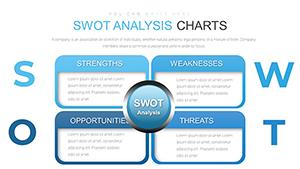
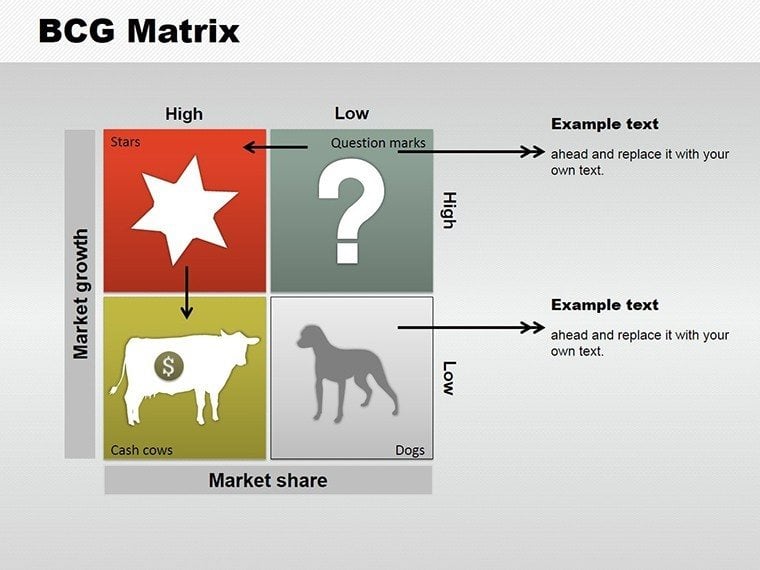
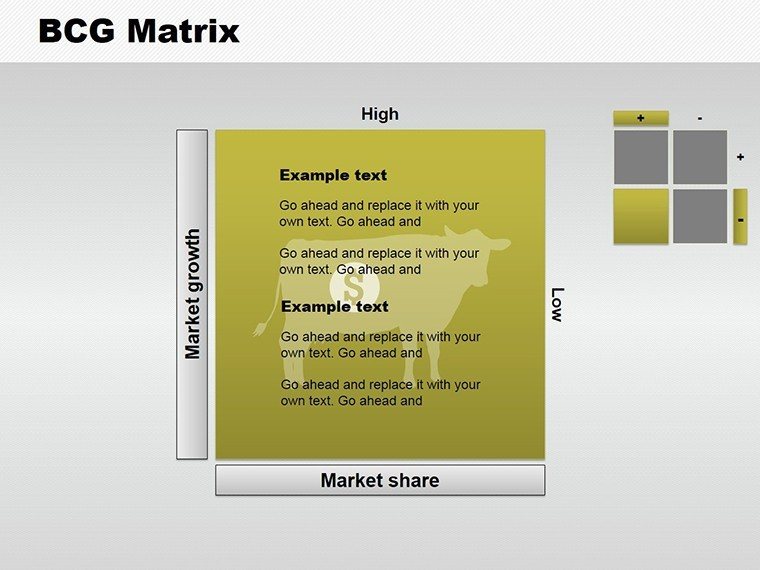
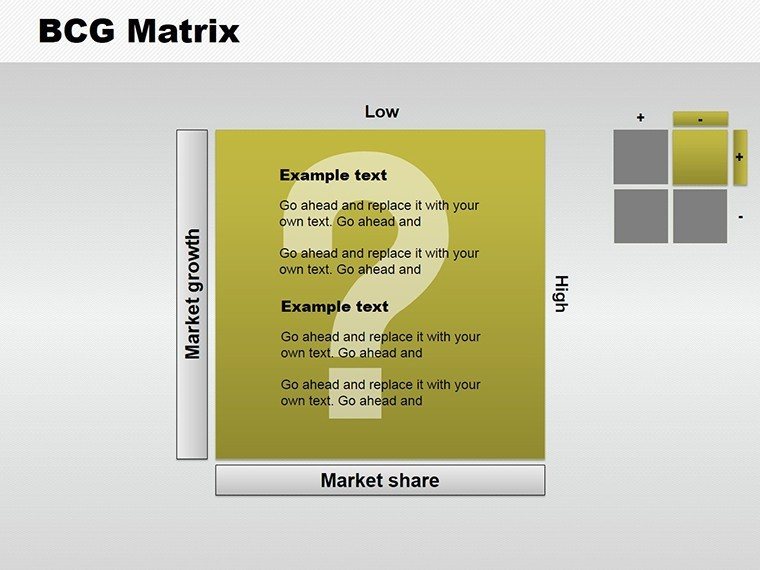
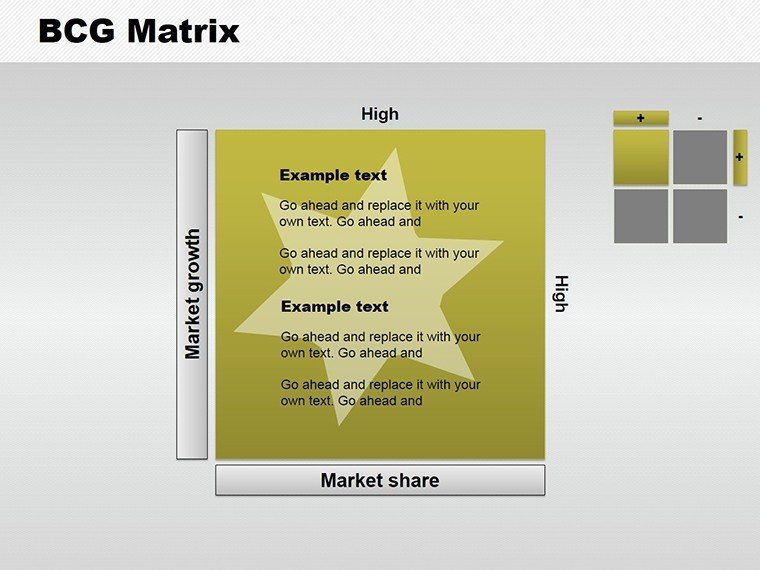
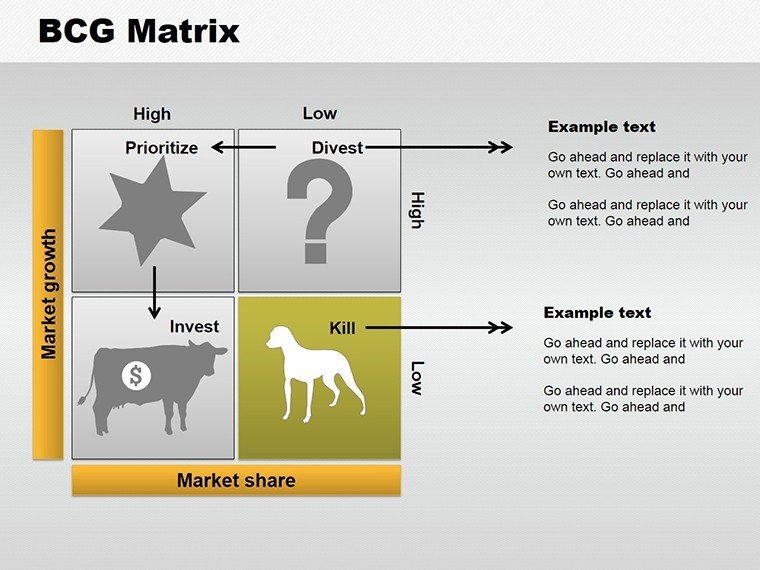
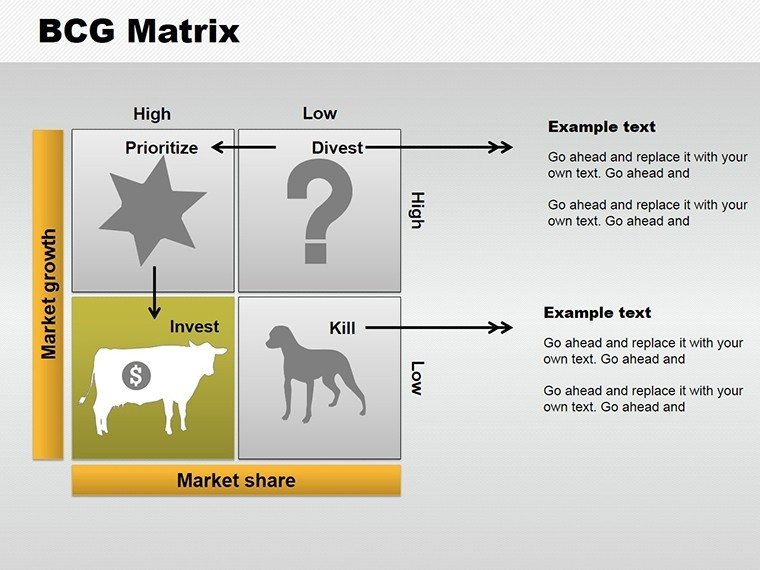
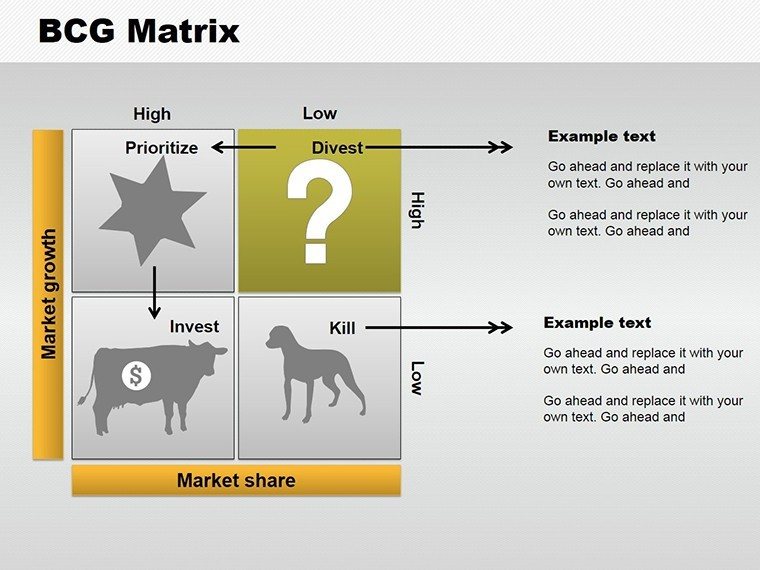
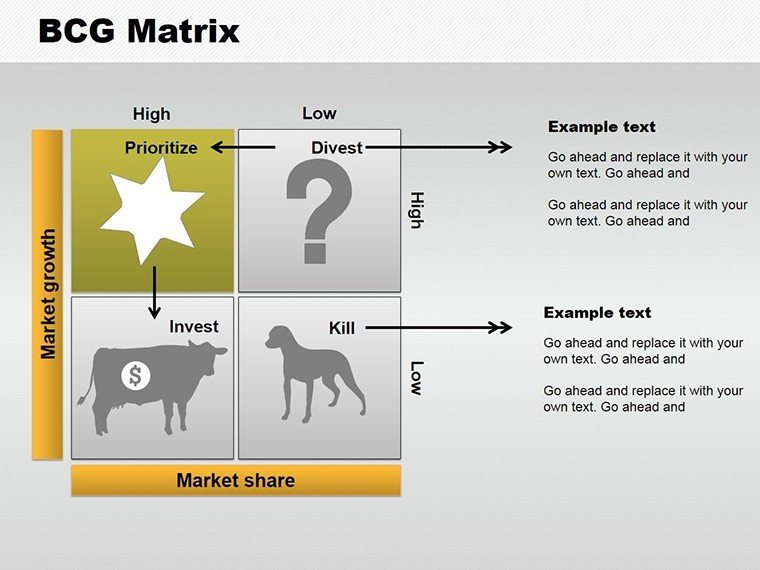
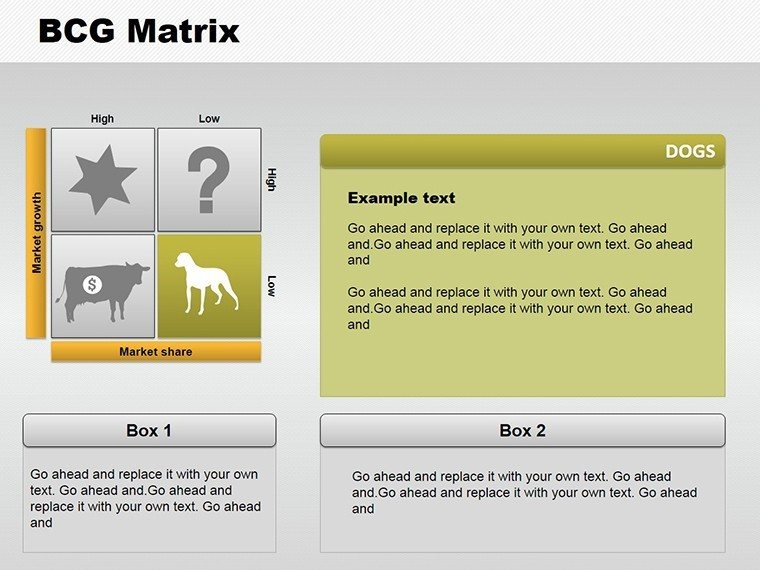
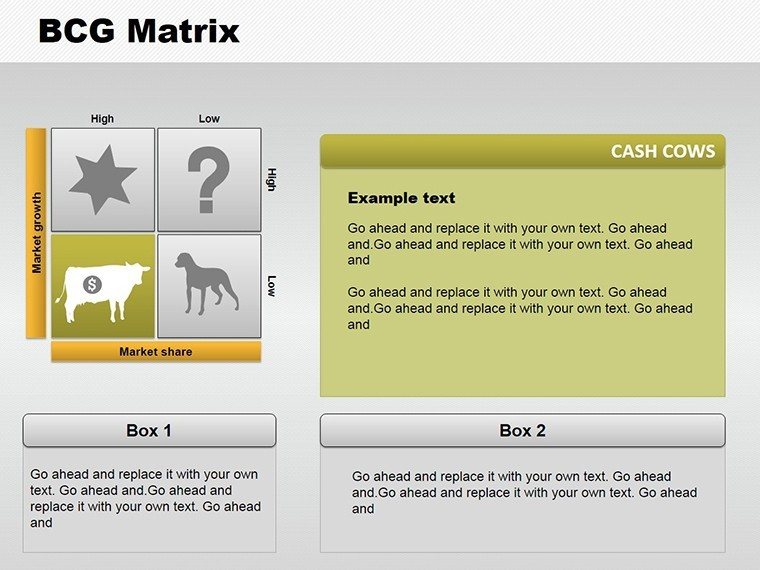
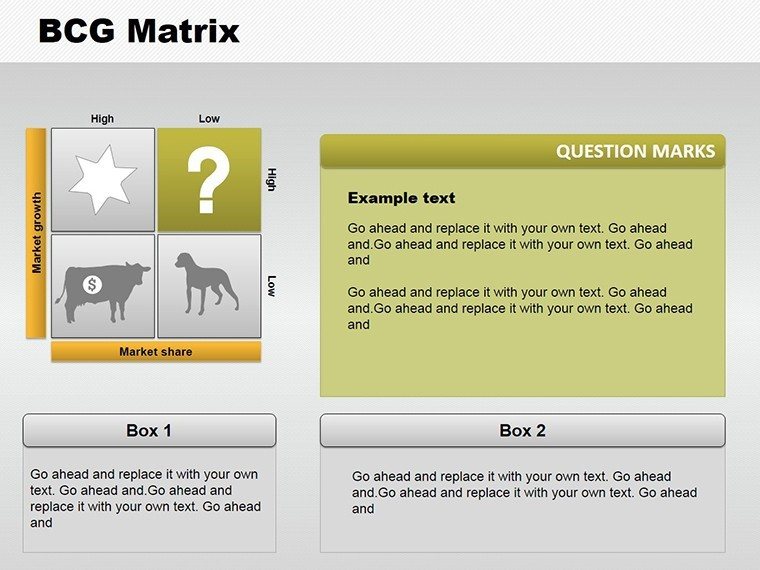
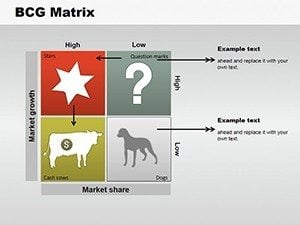
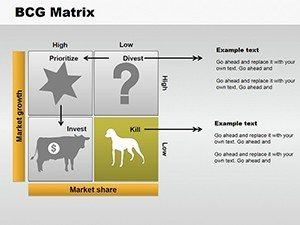
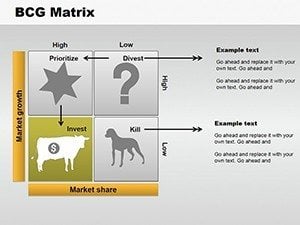
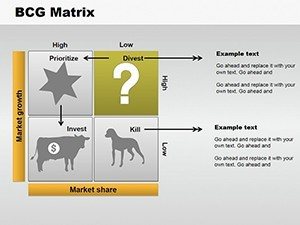
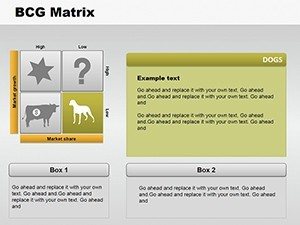
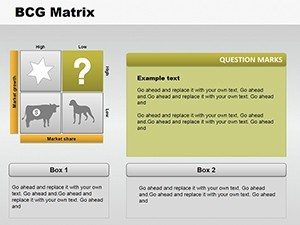
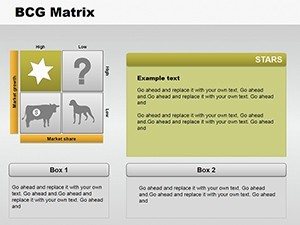
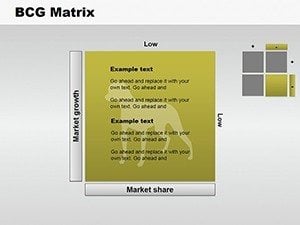
The core of this template is its faithful representation of the BCG Matrix, enhanced with modern design elements for today's audiences. Each slide allows for easy plotting of relative market share against market growth rates, with customizable quadrants that adapt to your data. For example, label Stars with high-growth icons to highlight investment priorities, or shade Dogs in muted tones to signal potential exits. Customization extends to colors - align with your corporate palette - or fonts for readability in diverse settings. Unlike rudimentary matrix tools in PowerPoint, which lack dynamism, ours includes interactive elements like clickable legends that reveal deeper insights on hover. This feature proves invaluable in interactive sessions, as seen in case studies from companies like General Electric, where BCG analyses informed multibillion-dollar decisions. The 13 slides vary from basic 2x2 grids to advanced versions with annotations, SWOT integrations, and trend arrows, providing layers of depth. Professionals in marketing can use it to assess campaign ROIs, dividing initiatives into quadrants based on performance metrics, fostering data-backed adjustments that boost efficiency.
Essential Features Driving Strategic Value
- Quadrant Customization: Resize, recolor, and relabel sections to fit unique business contexts.
- Data Integration: Import from Excel for automatic updates, ensuring accuracy in real-time analyses.
- Visual Enhancements: Incorporate bubbles or icons for size representation, adding dimensionality.
- Export Options: Generate PDFs or images for reports, maintaining high quality.
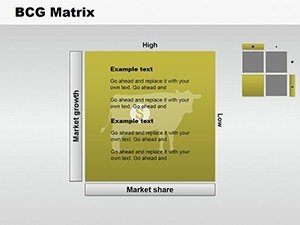
- Template Variants: Choose from minimalist to detailed layouts for varied presentation needs.
These attributes address common challenges, such as outdated visuals in legacy tools, by offering a fresh, professional aesthetic that builds trust. In a consulting scenario, adapt the matrix for client-specific industries, like tech startups evaluating app portfolios, leading to optimized strategies as per McKinsey insights.
Practical Use Cases Across Industries
From conglomerates to startups, this BCG Matrix template adapts to myriad applications, enhancing strategic dialogues. In pharmaceuticals, plot drug pipelines: Stars for breakthrough therapies, Cash Cows for established generics. Educators in business schools can dissect case studies, like Apple's product evolution, making lessons interactive. For non-profits, analyze program impacts - high-growth initiatives as Question Marks needing funding. Workflow integration is straightforward: Start by gathering data on market growth and share. Input into the template's editor. Refine visuals for clarity, perhaps adding trend lines for forecasts. Present with confidence, using built-in notes for speaker cues. Export for stakeholder reviews. This process mirrors best practices from the Project Management Institute, ensuring thoroughness. In urban development, akin to AIA-aligned planning, segment projects by viability quadrants for resource prioritization. The template's LSI-friendly elements, like "growth-share analysis," integrate naturally, aiding discoverability in shared resources.
Guided Steps for Effective Implementation
- Collect key metrics: Market growth rates and relative shares.
- Select a slide and populate the matrix grid.
- Customize quadrants with colors and labels.
- Add supporting elements like arrows or text boxes.
- Rehearse transitions and animations.
- Finalize and distribute for feedback.
Users often experience enhanced clarity, with reports of 25% faster strategy sessions, underscoring its efficiency in high-stakes environments.
Superiority Over Standard Tools
Basic PowerPoint matrices are static and uninspiring; our template counters with dynamic, scalable designs that handle complex datasets. For analysts, it's a leap forward, offering bubble sizing for additional variables like profitability. Trust is reinforced through subtle integrations, like "Strategize Smarter Today" prompts in slide notes. A real example: A Fortune 500 firm revamped its annual review using BCG visuals, leading to portfolio optimizations that increased shareholder value, as detailed in Bloomberg analyses. Position yourself as an authoritative strategist with this indispensable tool.
Transform your strategic visions - secure this BCG Matrix template and lead with precision.
Frequently Asked Questions
What data is needed for the BCG Matrix?
Relative market share and market growth rates for each product or unit.
Can I integrate this with Excel?
Yes, link data directly for automatic chart updates.
Is it suitable for beginners?
Absolutely, with intuitive interfaces and guides included.
How many variations are there?
13 slides offer diverse layouts, from simple to advanced.
Does it support team collaboration?
Yes, share via OneDrive or Google for real-time edits.
Are updates available?
Access future versions through our subscriber portal.