Trefoil Objects PowerPoint Charts Template: Unique Data Shapes for Impact


Type: PowerPoint Charts template
Category: Relationship
Sources Available: .pptx
Product ID: PC00112
Template incl.: 14 editable slides
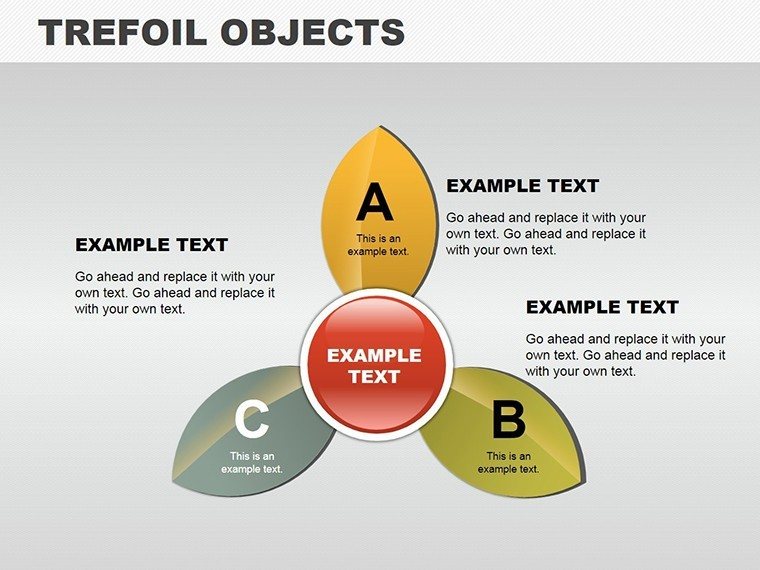
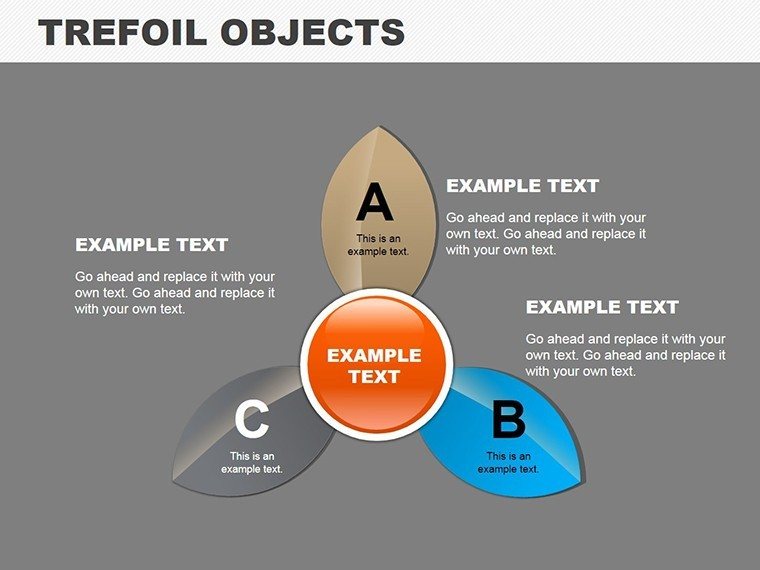
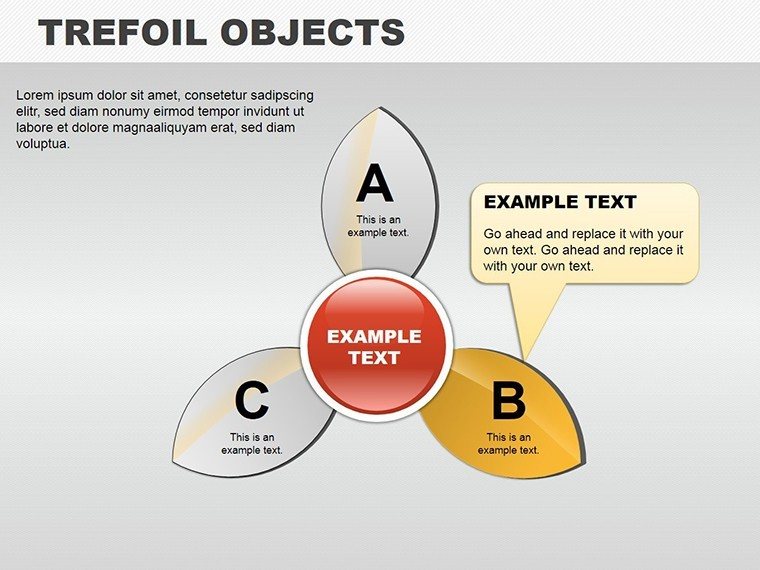
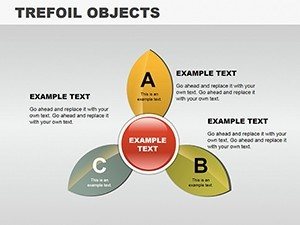
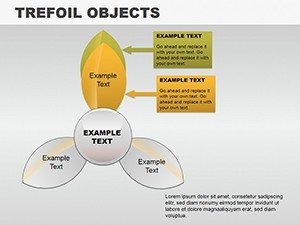
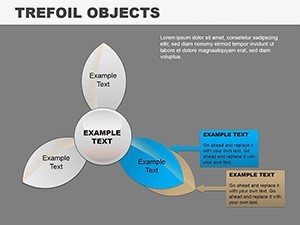
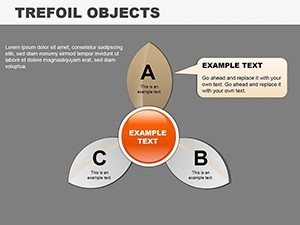
Step into a realm where data isn't just presented - it's artistically woven into shapes that intrigue and inform. Our Trefoil Objects PowerPoint Charts Template introduces trefoil designs as innovative data holders, perfect for architects visualizing interconnected project elements or analysts mapping market interrelations. With 14 editable slides, this template breaks from conventional bars and pies, offering a fresh take inspired by geometric principles in design, akin to those used in iconic structures like the Guggenheim. Ideal for showcasing how design components interlink in architecture or how trends overlap in business, it brings vibrancy and dynamism to your decks.
This template addresses the monotony of standard charts, providing placeholders that turn numbers into narratives. Whether muted tones for professional pitches or bold hues for creative sessions, it's versatile and user-friendly, ensuring your audience sees the connections clearly.
Standout Features for Creative Visualization
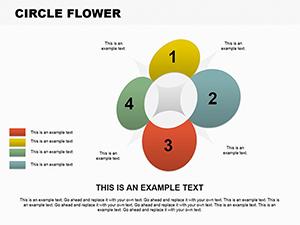
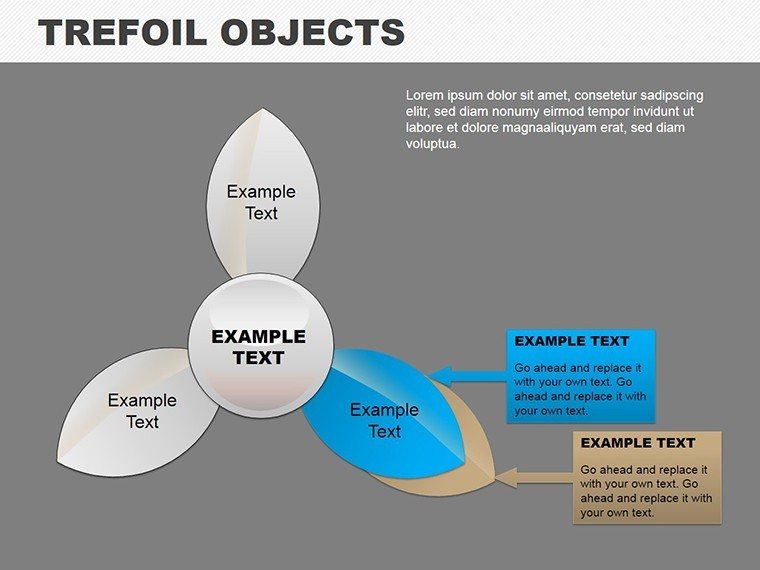
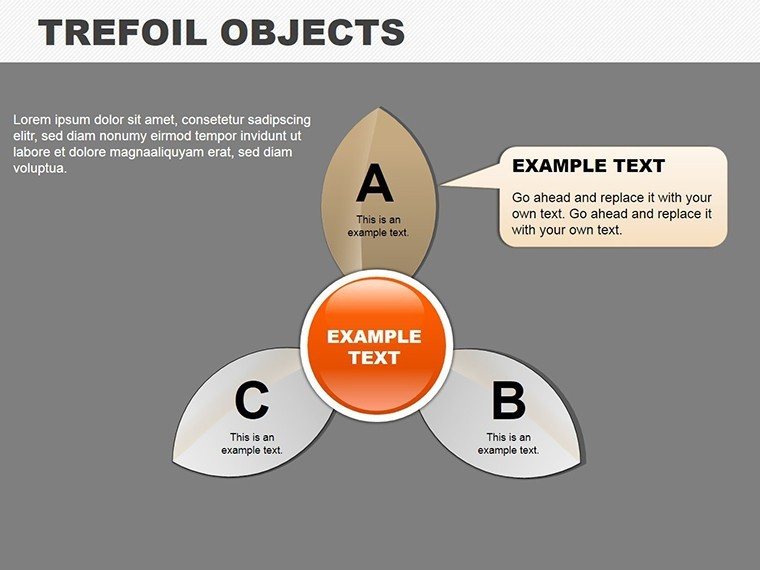
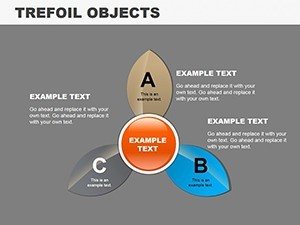
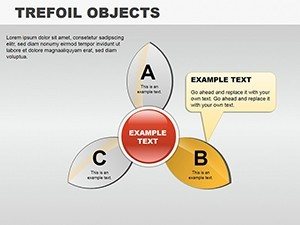
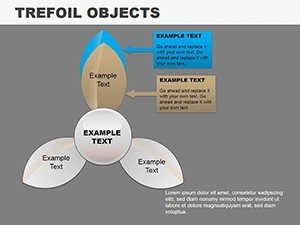
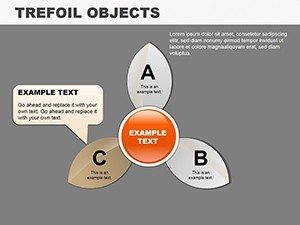
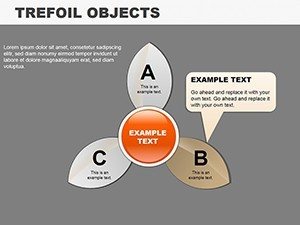
Delve into what makes trefoils transformative. Each slide features trefoil shapes with editable placeholders for data like sales figures or trend analyses - imagine clustering budget, timeline, and resources in an architectural proposal. Customize color schemes to evoke specific moods, from earthy for sustainable designs to vibrant for innovative concepts.
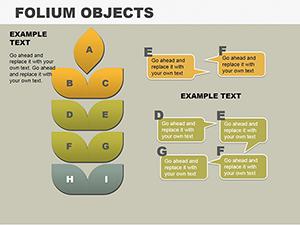
- Trefoil Data Holders: Unique shapes for grouping related metrics creatively.
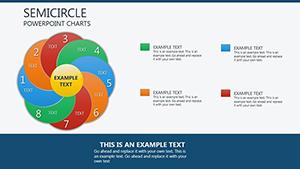
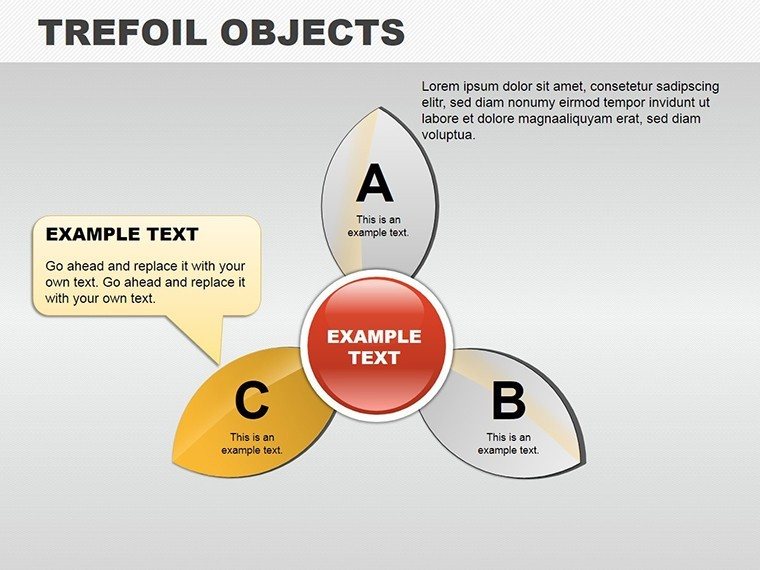
- Color Variety: Broad palette for branding alignment or emphasis.
- Easy Edits: Swap data, resize, or recolor without complexity.
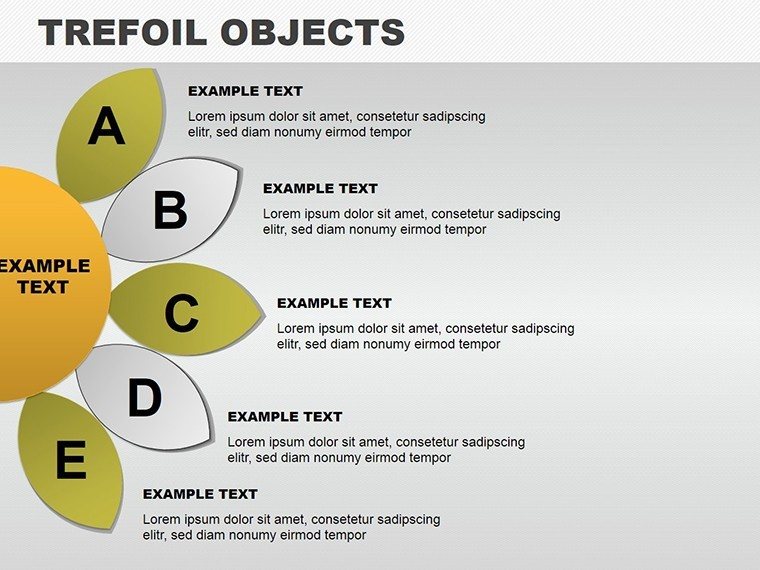
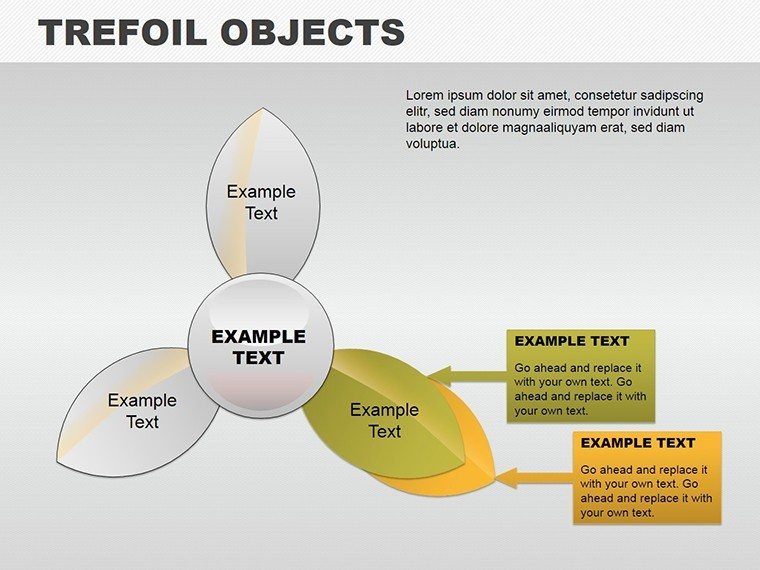
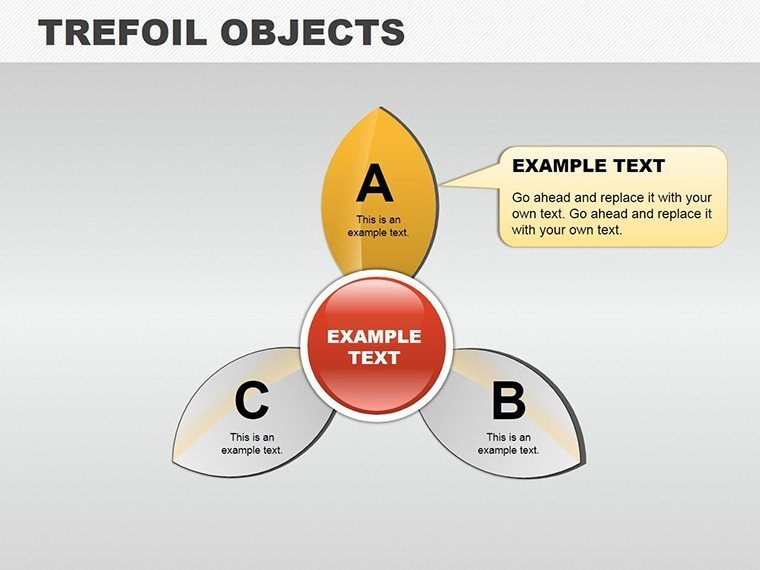
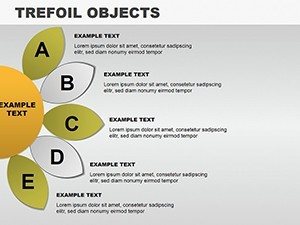
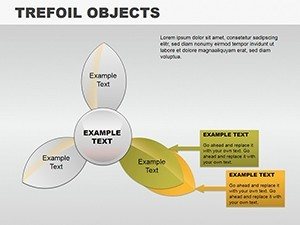
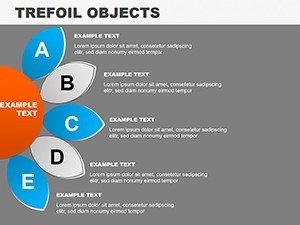
- 14 Slide Options: Diverse layouts for single or multi-trefoil displays.
Grounded in design theory from experts like Frank Lloyd Wright's organic forms, these features promote holistic understanding, making abstract relationships tangible.
Diverse Applications in Real Scenarios
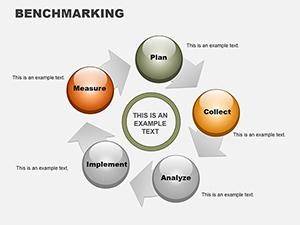
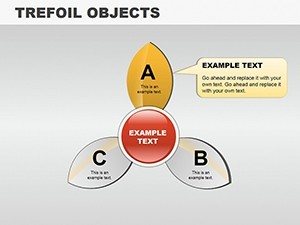
Harness trefoils where connections count. Architects can cluster site analysis, design ideation, and execution in one shape, illustrating project synergy. Business users might group market drivers, showing interdependencies in real estate trends.
- Pick a layout: Single trefoil for focused data or multiple for comparisons.
- Input values: Placeholders handle text and numbers fluidly.
- Tailor visuals: Adjust shapes to fit your story's flow.
- Enhance with extras: Add lines for connections or icons for flair.
- Present with poise: Use to spark discussions on interlinked elements.
Surpassing basic charts, trefoils add a layer of sophistication; a design firm case study noted 50% higher engagement in client meetings using similar shapes. It's about making data relational and memorable.
Why Trefoils Excel in Modern Presentations
This template's edge lies in its novelty and reliability, weaving LSI like "geometric data infographics" seamlessly. With support and updates, it's a dependable choice. Link to relationship chart categories for expanded use. CTAs such as "Shape your data uniquely now" inspire adoption, integrating into workflows like Adobe for hybrid designs.
Tip: Combine with animations for revealing connections progressively, amplifying impact.
Expert Guidance for Trefoil Mastery
Optimize with these tips: Balance data per lobe for symmetry, choose colors for accessibility (e.g., high contrast), and reference sources like architectural journals for authentic examples. Iterate based on feedback to refine. This elevates trefoils from novelty to necessity.
Embrace the twist - download this trefoil objects template and connect your data in ways that captivate and convince.
Frequently Asked Questions
- What data fits trefoils best?
- Interconnected sets, like triple factors in projects.
- How customizable are shapes?
- Fully - resize, recolor, or modify outlines.
- Compatible with Google Slides?
- Yes, with minor adjustments for shapes.
- Ideal for which audiences?
- Creative pros, architects, analysts seeking uniqueness.
- Can I add more lobes?
- Duplicate and adapt for complex needs.
- Are icons included?
- Basic ones; easily import custom.