Benchmarking PowerPoint Charts Template: Master Comparisons Effortlessly


Navigating competitive landscapes requires more than data - it demands clear comparisons that highlight strengths and gaps. Enter our Benchmarking PowerPoint Charts Template, with 12 editable slides engineered to make benchmarking a breeze. Suited for entrepreneurs charting startup growth or professionals evaluating industry standards, this template turns metrics into meaningful visuals. Think of it as your secret weapon for turning raw numbers into actionable strategies.
Aligned with benchmarking frameworks from organizations like the American Productivity & Quality Center (APQC), these charts facilitate best-practice comparisons without complexity. Work seamlessly in PowerPoint or Google Slides, tweaking arrows for directional insights or pies for share breakdowns. For instance, in urban planning pitches, benchmark infrastructure efficiencies against peers, drawing from case studies like Singapore's smart city initiatives.
Core Features Driving Value
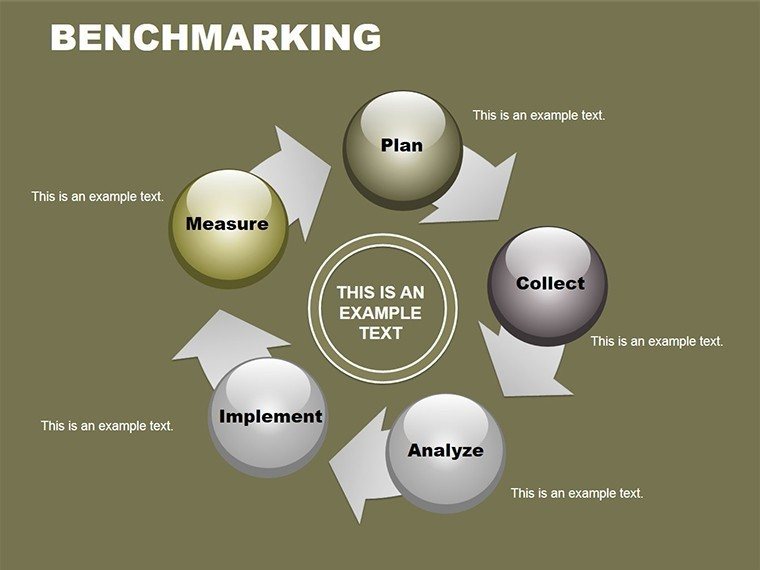
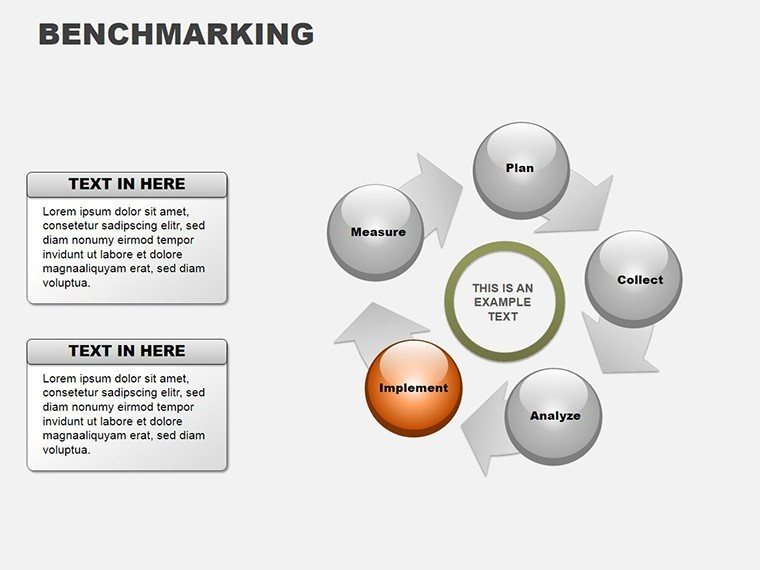
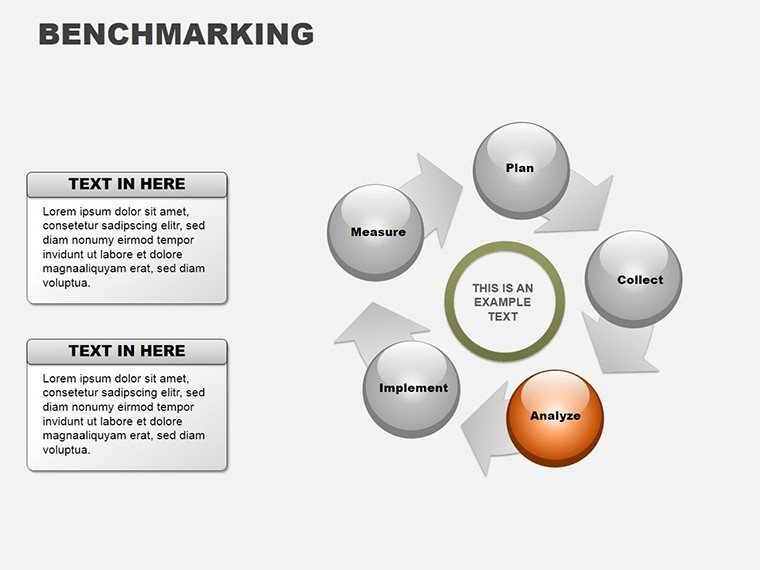
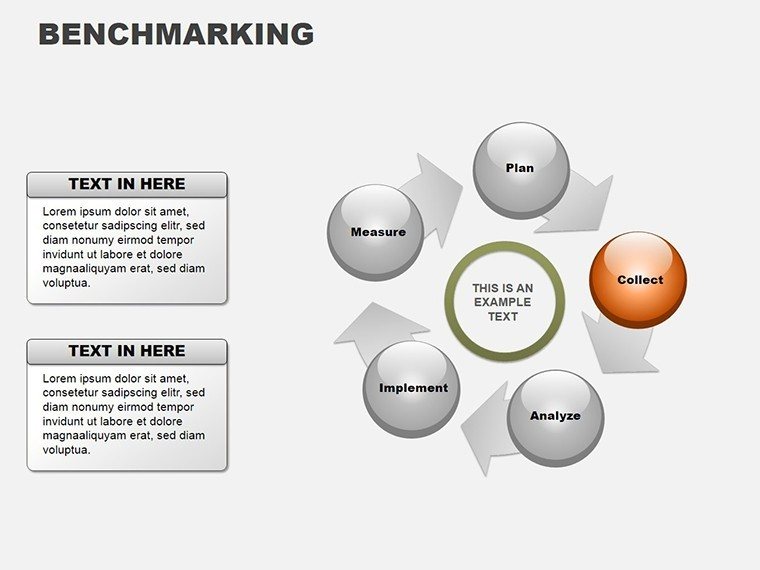
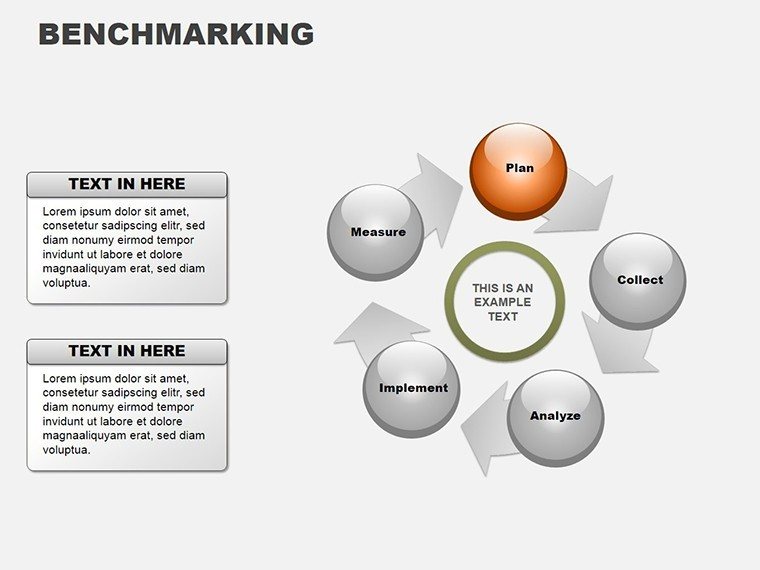
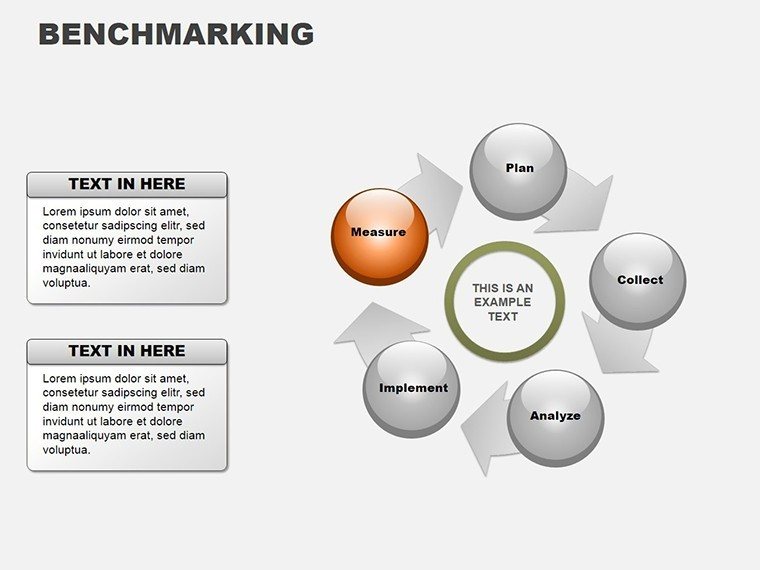
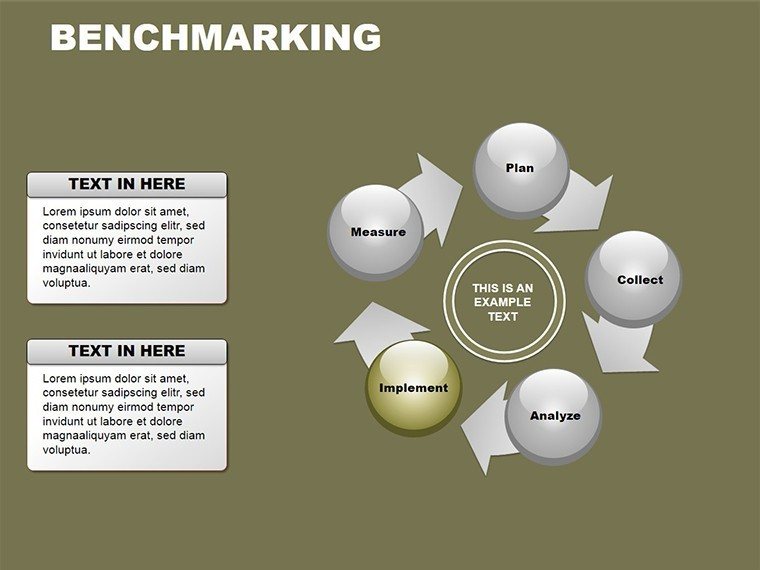
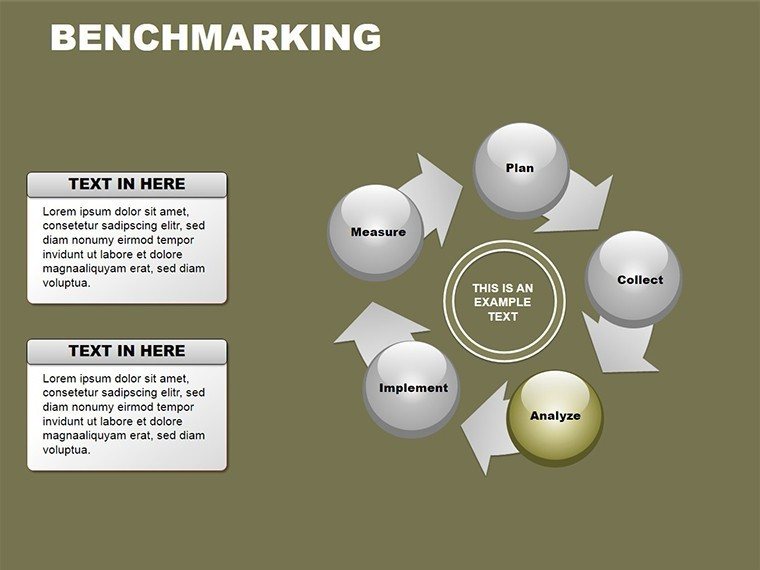
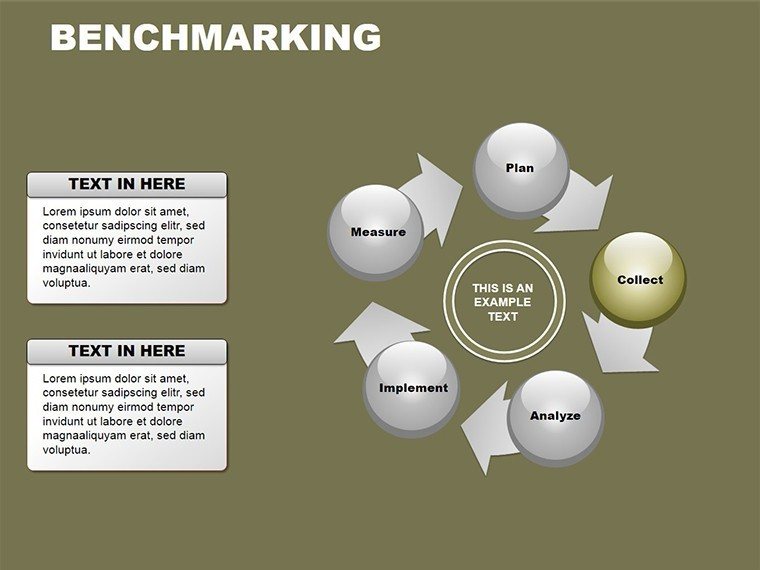
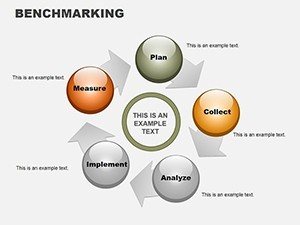
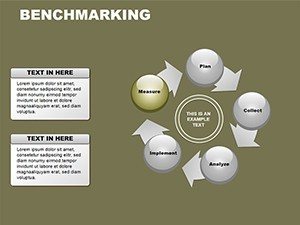
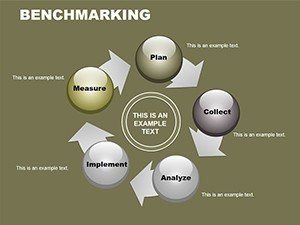
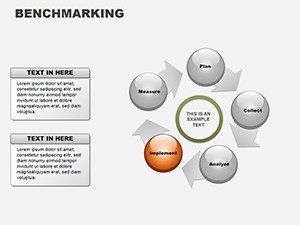
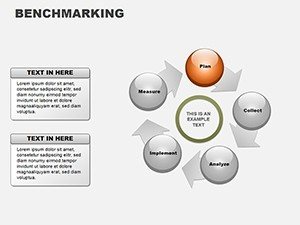
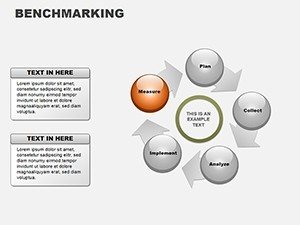
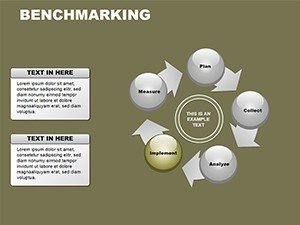
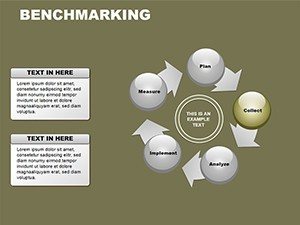
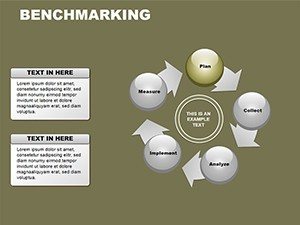
At its heart, the template blends cycle, pie, and arrow elements for versatile benchmarking. Designs are clean yet informative, with built-in scalability for detailed or high-level views.
- Comparative Arrows: Show progress trajectories, like KPI advancements over quarters.
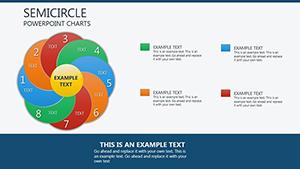
- Pie Integrations: Embed within benchmarks for proportional analyses.
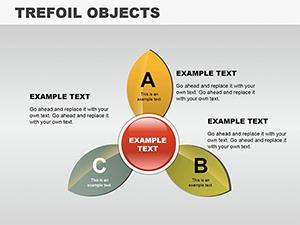
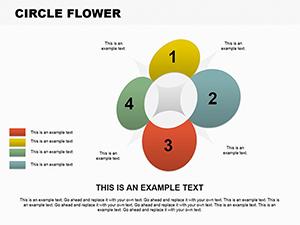
- Cycle Loops: Illustrate iterative improvements, essential for continuous benchmarking.
- Customization Suite: Fonts, colors, and layouts adapt to your narrative.
Outshining basic tools, it provides pre-linked elements that update holistically, unlike manual adjustments that risk errors.
Slide-by-Slide Insights
Slide 1: Overview benchmark dashboard. Slides 3-6: Arrow-based comparisons for linear metrics. Slides 8-10: Cycle-pie hybrids for multifaceted views.
Final slides focus on summary charts, aggregating data with visuals like radar plots for multi-criteria benchmarks. Input your benchmarks via tables, seeing instant graphical representations.
Diverse Use Cases for Real Impact
Leverage for business intelligence. Entrepreneurs benchmark funding rounds against industry averages; educators compare student outcomes.
- Performance Reviews: Align team metrics with top performers.
- Proposal Building: Demonstrate value by benchmarking proposals.
- Innovation Tracking: Measure R&D against competitors.
Per a Gartner study, effective benchmarking boosts efficiency by 20%; integrate with analytics software for robust data flows.
Expert Strategies for Success
Choose benchmarks wisely - focus on relevant peers. Use animations for phased reveals. Maintain consistency in scales for fair comparisons.
Tip: Layer with icons for thematic reinforcement, like targets for goals.
Begin Benchmarking Brilliance Right Away
Elevate from guesswork to precision. Acquire this template and set new standards in your field.
Frequently Asked Questions
How flexible are the comparisons? Fully editable to add/remove metrics as needed.
Supports team collaboration? Yes, via Google Slides sharing.
Includes data examples? Pre-filled with samples for quick starts.
Any format limitations? .pptx ensures broad compatibility.
Suitable for non-profits? Absolutely, for impact benchmarking.
How to update charts? Edit linked tables for automatic refreshes.