Billiards PowerPoint Charts Template


Who says data has to be dull? Our Billiards PowerPoint Charts Template infuses a playful yet professional twist, drawing from the precision of billiards to frame your information. With 9 editable slides, this template is ideal for those looking to break away from conventional designs, offering pyramid and sphere-based charts that symbolize strategy and momentum. Tailored for business pitches or educational sessions, it solves the challenge of keeping audiences hooked by incorporating thematic elements like cue balls and pockets into visuals. Compatible with PowerPoint and adaptable to Google Slides, it's a cue to elevate your game - customize effortlessly and pocket the applause. Whether explaining processes or hierarchies, this template turns presentations into an entertaining match where your ideas always win.
Features that Set Us Apart
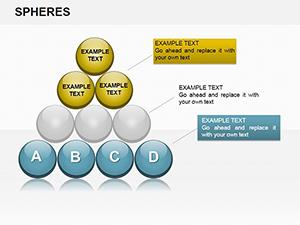
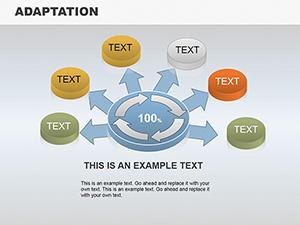
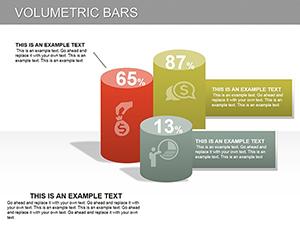
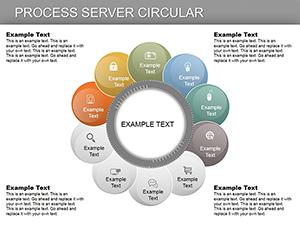
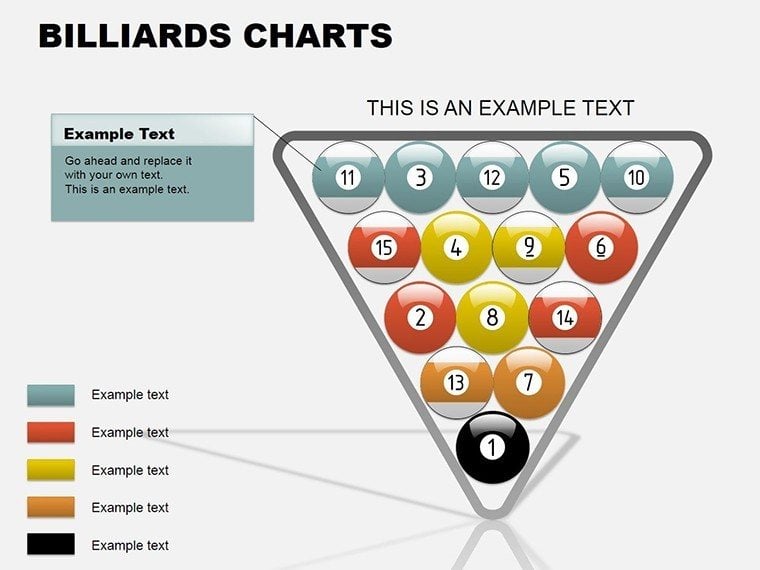
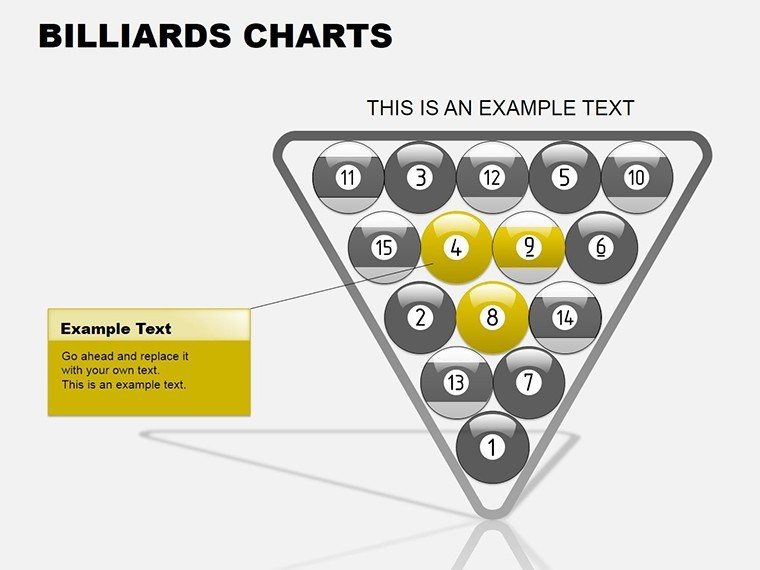
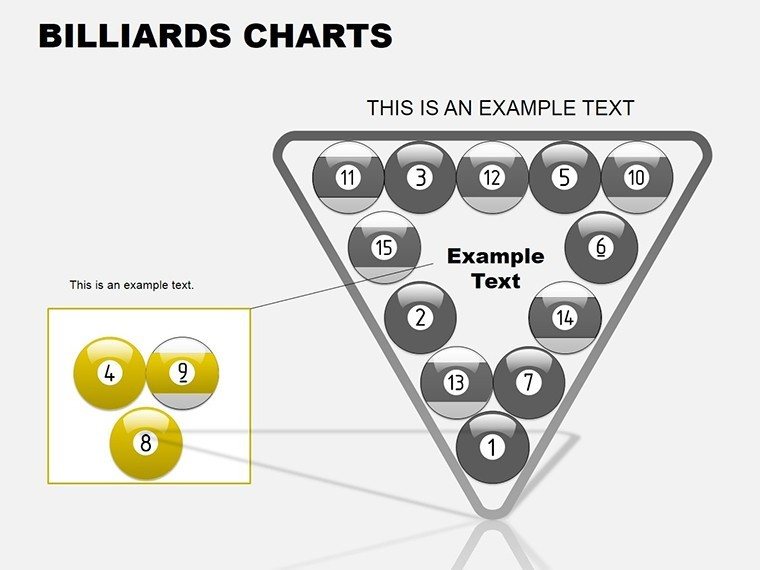
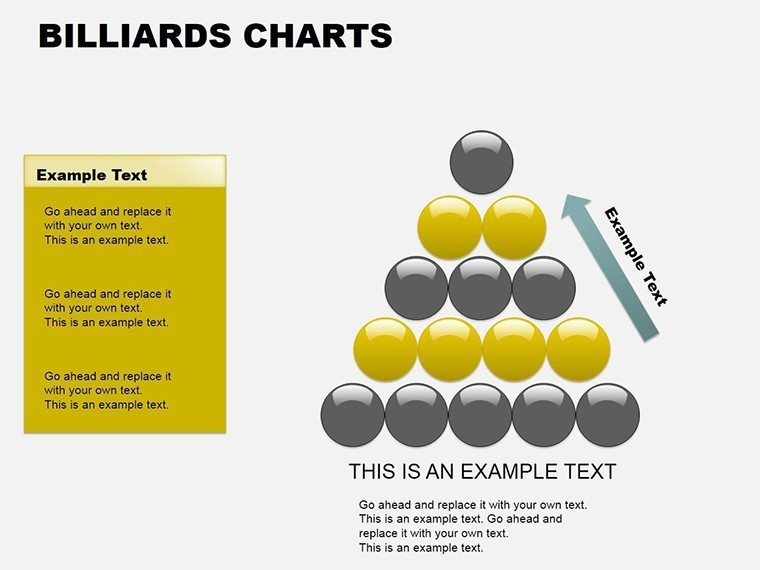
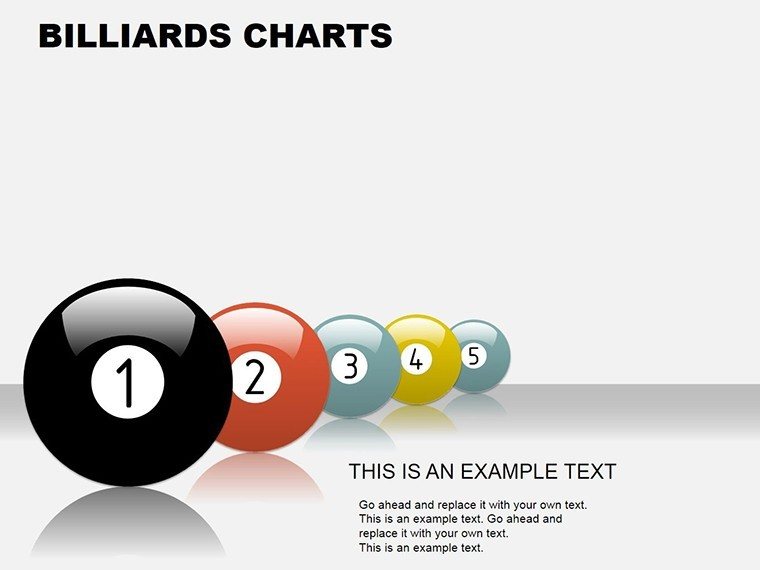
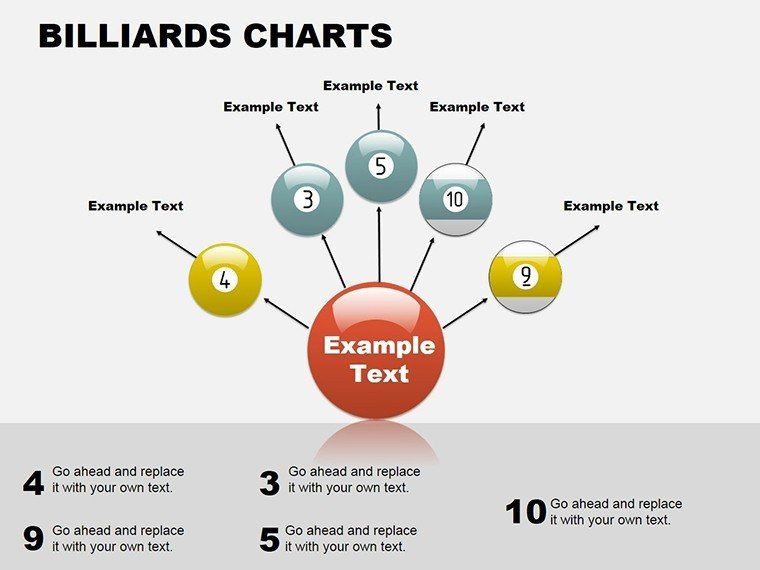
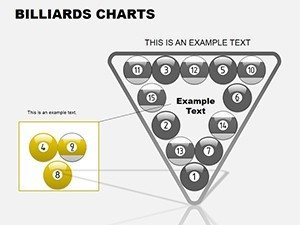
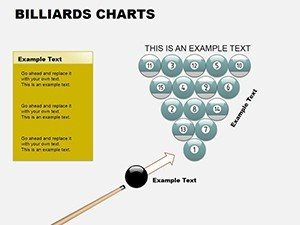
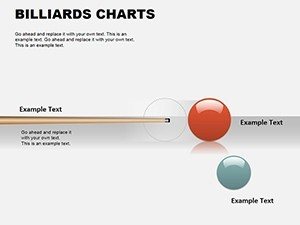
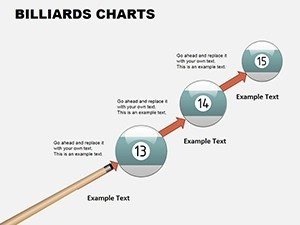
Stand out with billiards-inspired aesthetics that add a layer of intrigue. Slides feature pyramid charts for layered data and sphere graphs for rounded insights, all with interactive touches like animations simulating ball movement.
- Stunning Visuals: Billiards-themed graphics that capture attention without overwhelming.
- Seamless Customization: Tweak colors and fonts to fit your brand, like adjusting a cue shot.
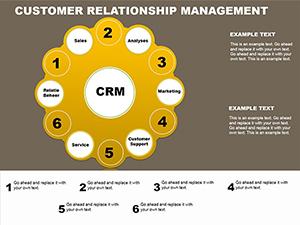
- Data-Driven Charts: Bar and pie variants with thematic overlays for clear storytelling.
- Interactive Elements: Hyperlinks and clicks for dynamic engagement.
This surpasses basic templates by blending theme with utility, ideal for creative industries.
Who Can Benefit
Versatile for:
- Business Pros: Pitch strategies with pyramid hierarchies.
- Educators: Teach concepts using fun analogies.
- Creatives: Showcase portfolios with flair.
For architects, use sphere charts to represent modular designs, per AIA modular building trends.
Experience Matters
Real users report higher retention; one educator noted students grasping probability faster via billiards metaphors.
Why Choose Our Billiards PowerPoint Charts Template
It's unique, engaging, and effective - perfect for turning data into a game-changer.
Download Our Template Today
Line up your next presentation for success. Customize, present, impress.
Frequently Asked Questions
- How thematic are the charts?
- Billiards elements enhance without distracting, fully editable for balance.
- Compatible with animations?
- Yes, built for smooth transitions mimicking game dynamics.
- Suitable for serious topics?
- Absolutely - theme adds memorability to corporate or educational content.
- File formats?
- .ppt and .pptx for easy access.