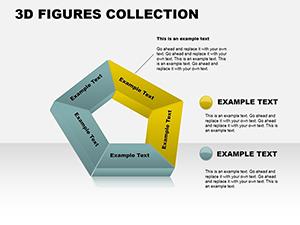
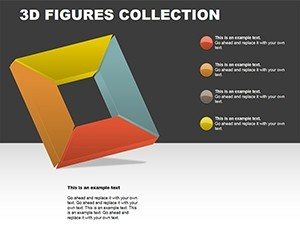
3D Square Collection PowerPoint Charts Template


Type: PowerPoint Charts template
Category: 3D
Sources Available: .potx, .pptx
Product ID: PC00086
Template incl.: 18 editable slides
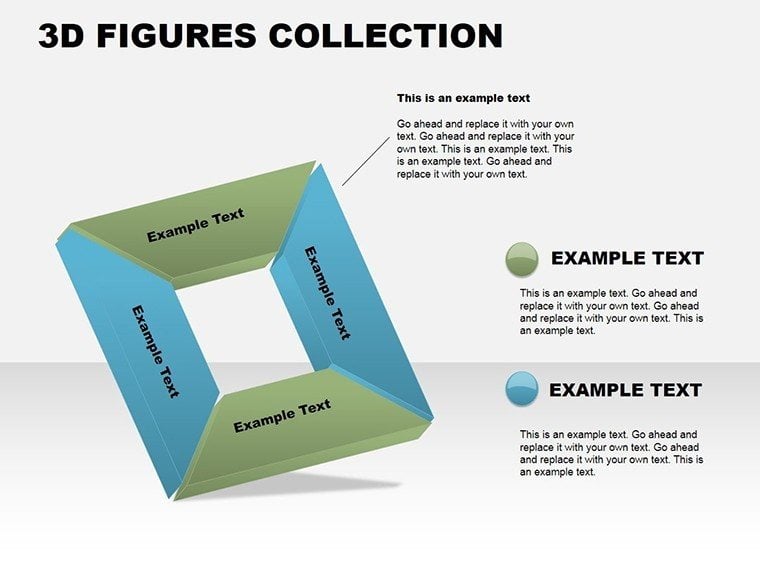
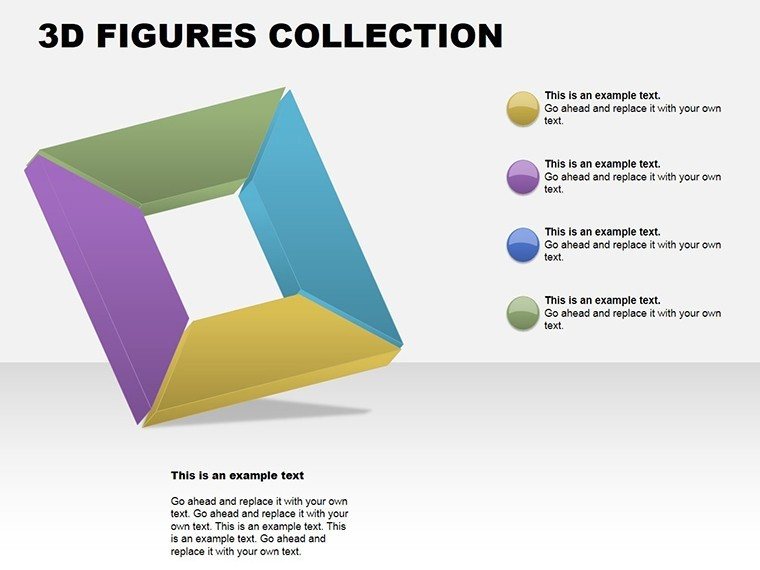
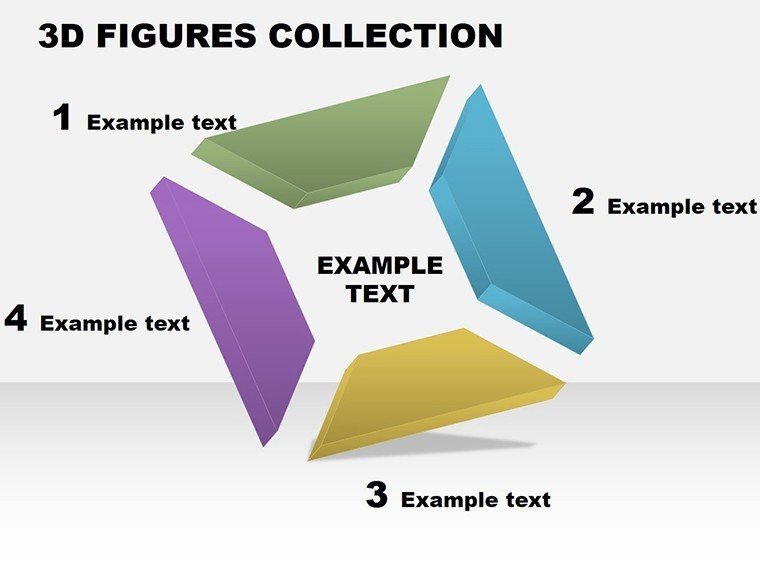
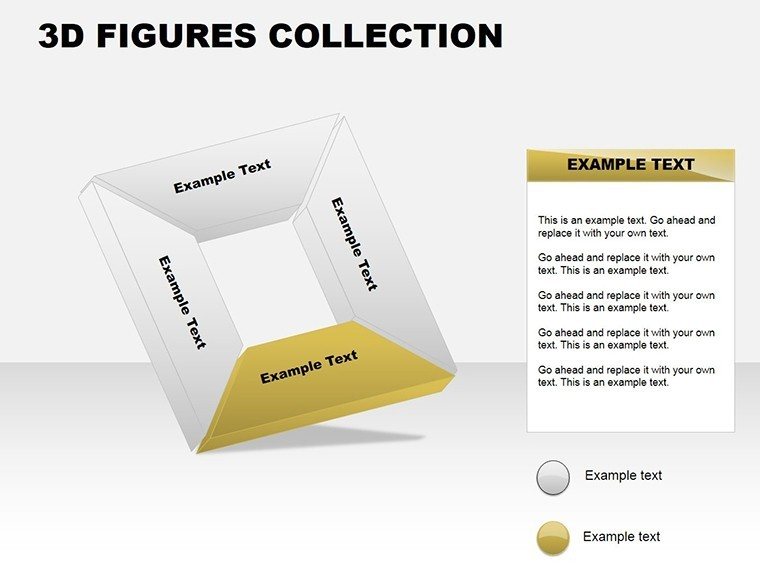
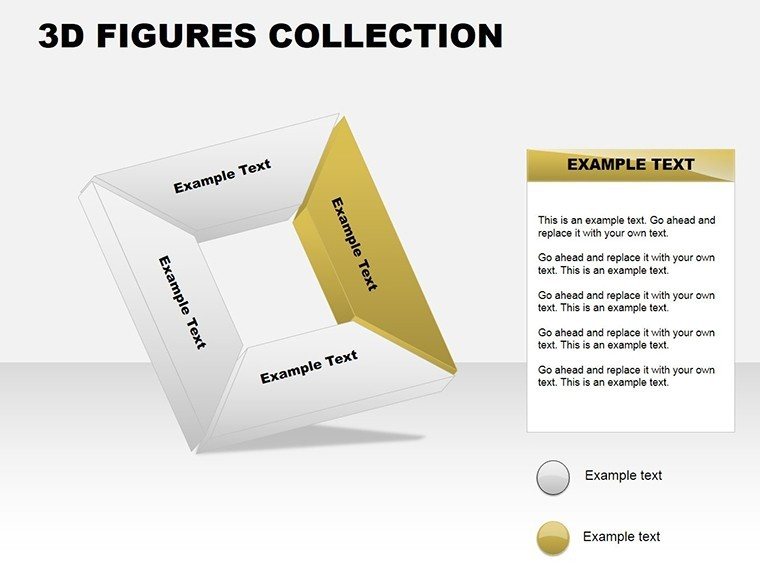
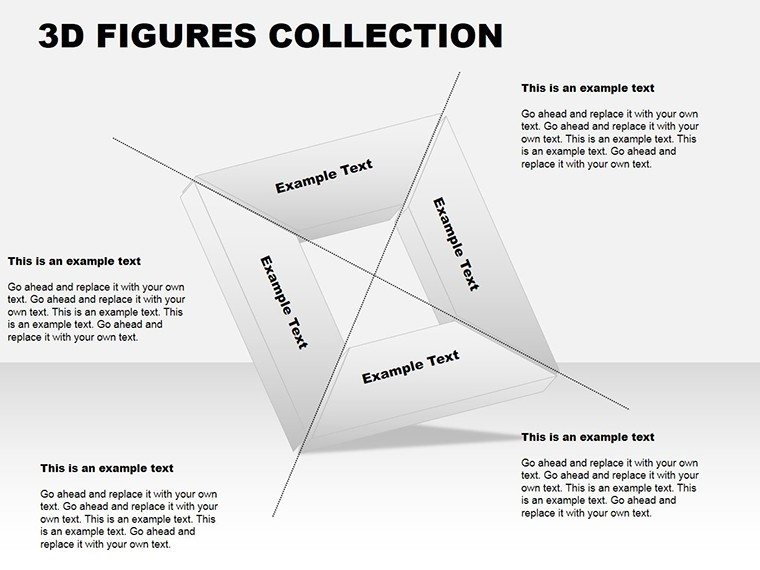
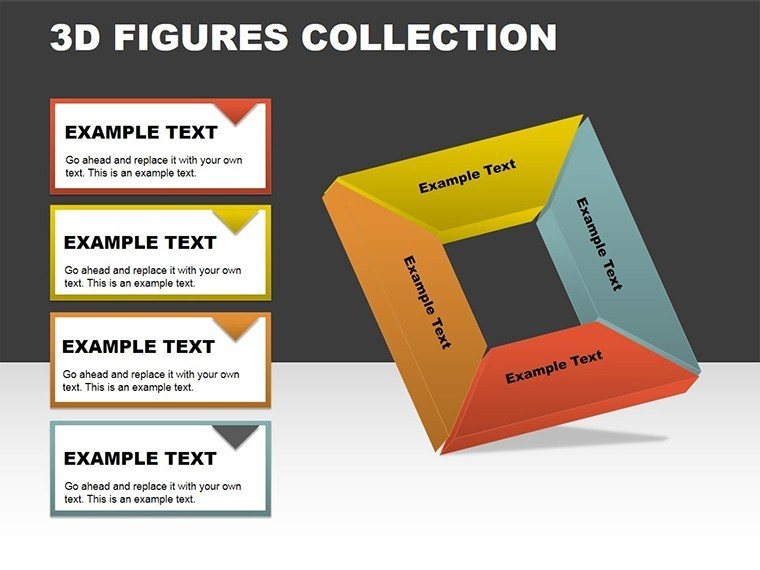
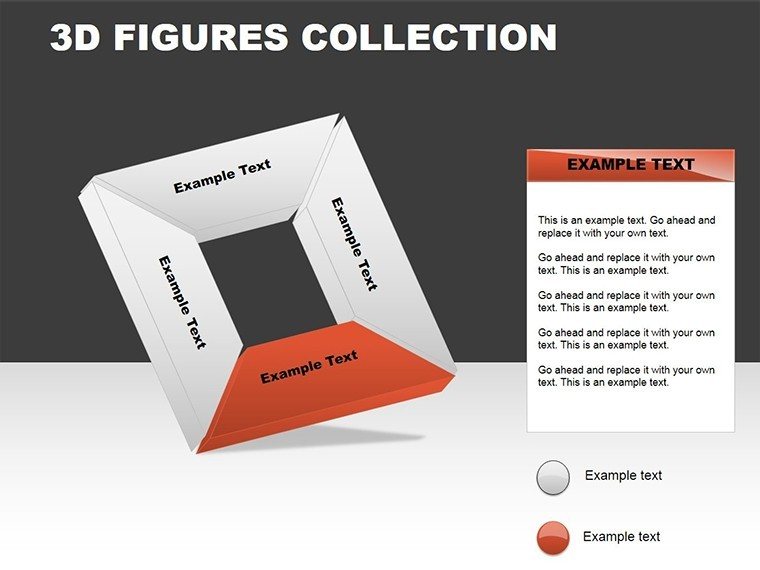
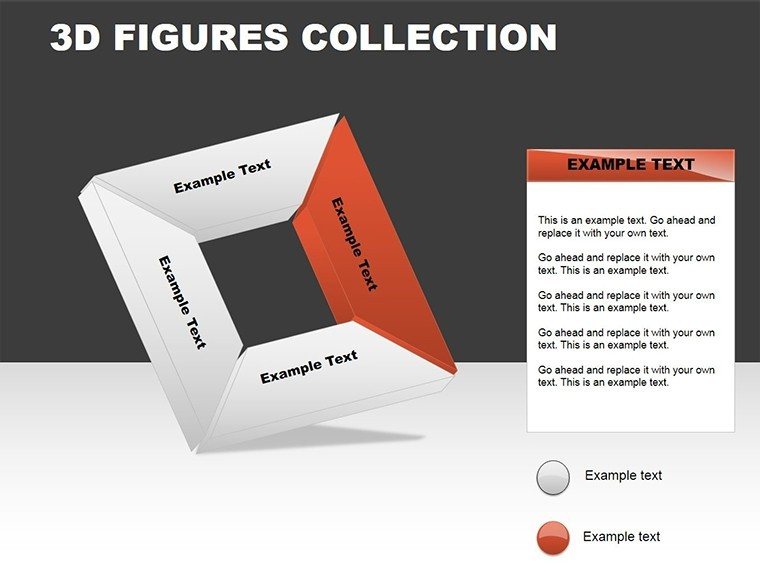
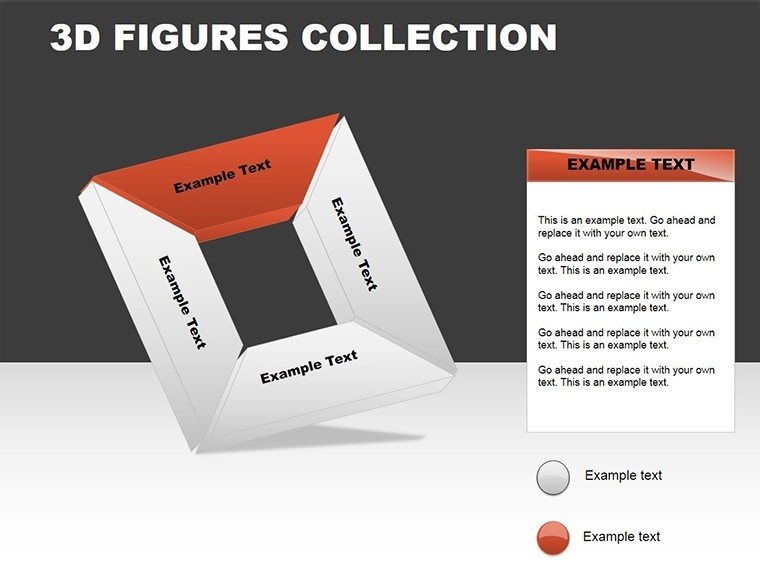
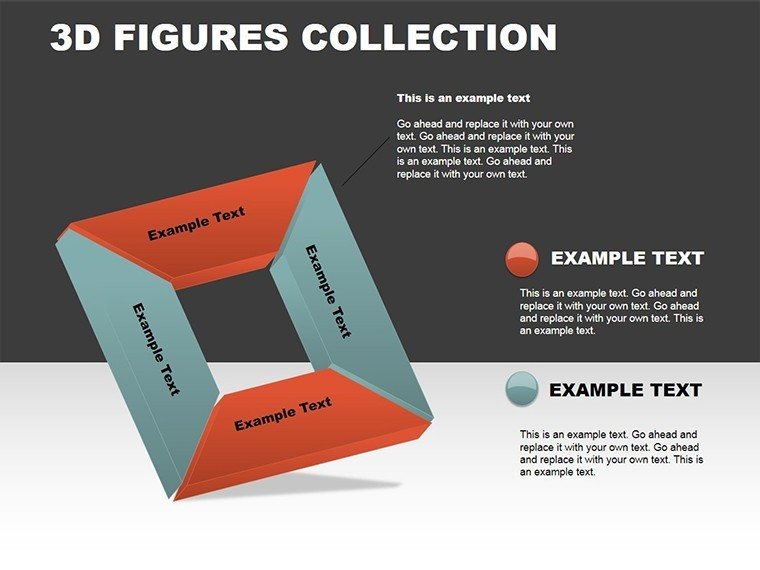
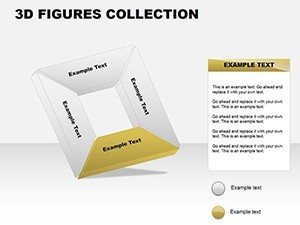
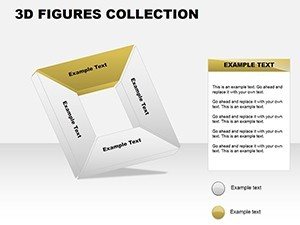
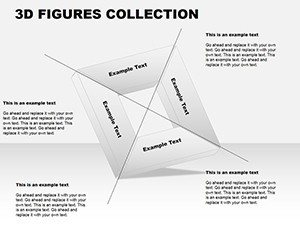
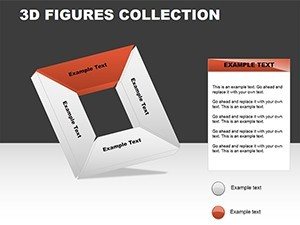
Step into the dimension of dynamic data visualization with our 3D Square Collection PowerPoint Charts Template. This innovative set of 18 editable slides is engineered to bring depth and excitement to your presentations, making complex information accessible and engaging. Perfect for professionals who wrestle with flat, uninspiring charts, this template uses 3D squares to add a layer of sophistication, helping you stand out in meetings or lectures. Whether illustrating sales trends or project milestones, the 3D effects create a sense of volume and perspective that basic 2D charts simply can't match. Fully compatible with PowerPoint and hinting at Google Slides usability, it's designed for quick adaptations, ensuring your message pops with visual impact. Embrace this tool to not only present data but to tell a compelling story that captivates and convinces.
Why Choose Our 3D Square Collection PowerPoint Charts?
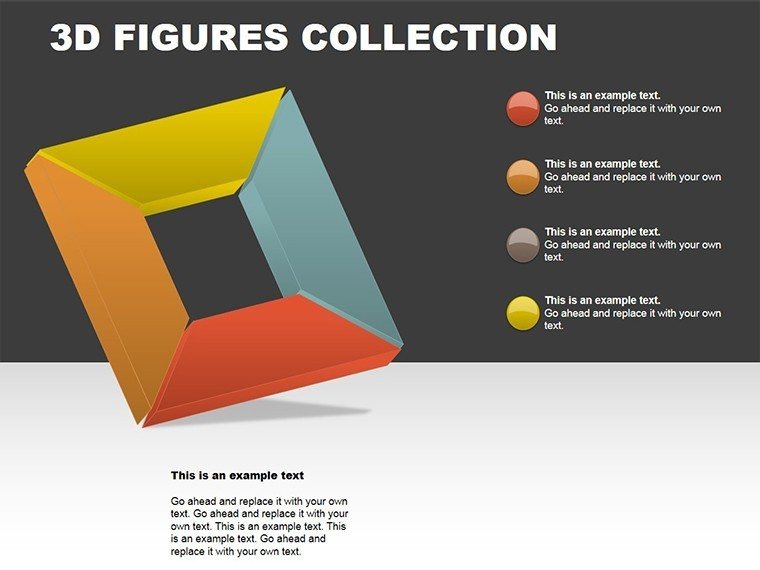
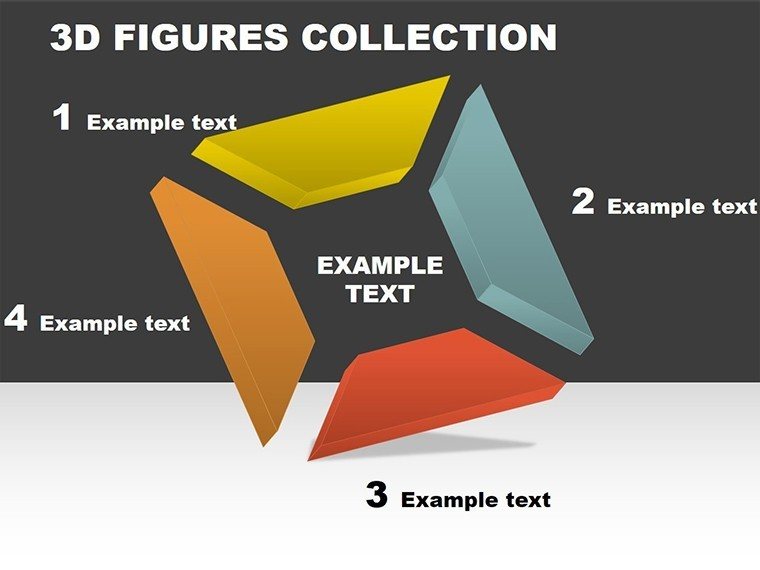
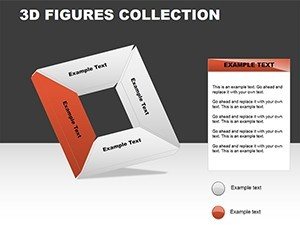
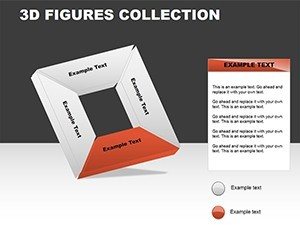
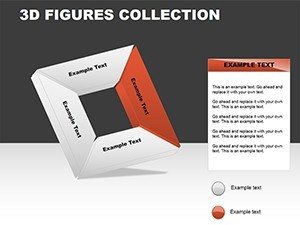
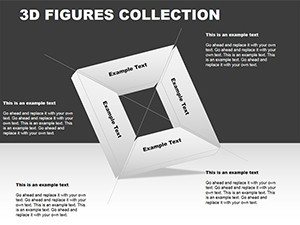
In a world flooded with data, standing out requires more than numbers - it demands visuals that leap off the screen. This template's 3D square designs offer a fresh take, transforming standard bar or column charts into multi-dimensional masterpieces. For example, use a 3D square pyramid to depict hierarchical structures, or clustered squares for comparative analysis, all with shadows and gradients for realism.
Key Features of Our Presentation Template
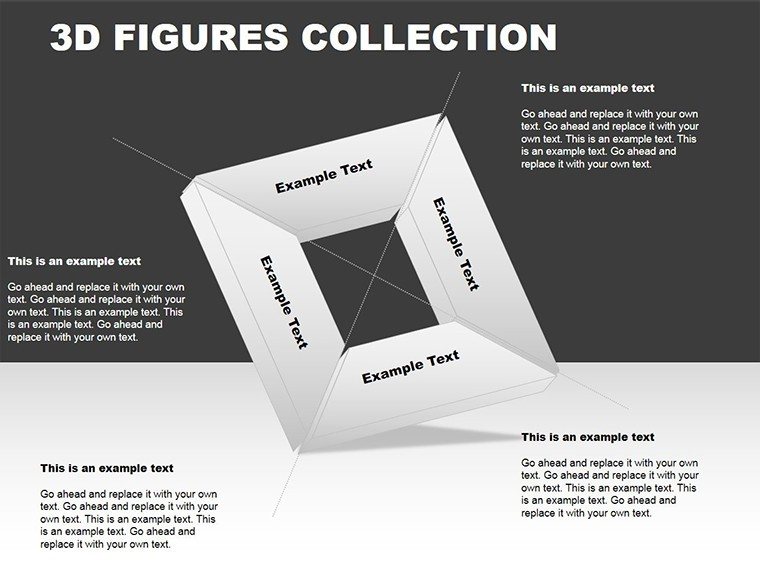
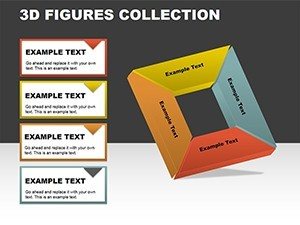
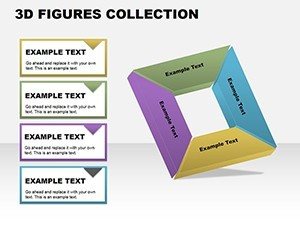
- Variety of 3D Designs: From simple cubes to intricate grids, choose from diverse square-based charts.
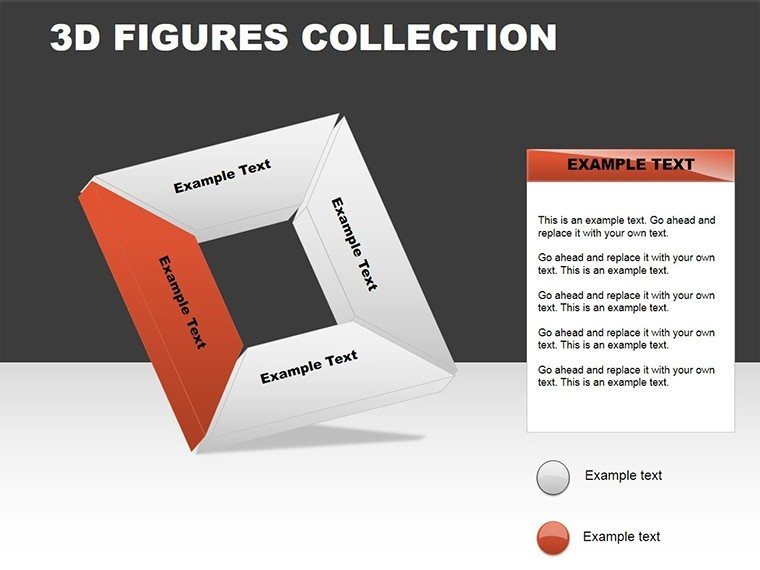
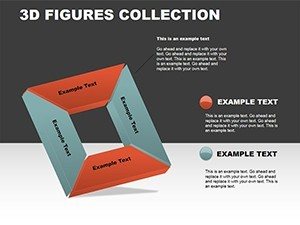
- Full Customization: Edit shapes, colors, and dimensions effortlessly to align with your theme.
- User-Friendly Interface: Intuitive tools make modifications a breeze, even for beginners.
- High-Quality Graphics: Resolution-perfect for large screens, ensuring clarity in any setting.
- Animation Ready: Built-in slots for subtle animations that enhance without overwhelming.
Unlike default PowerPoint options, which lack depth, these features provide a professional polish, often seen in high-end design software but accessible here without the learning curve.
Who Can Benefit from Our 3D Square Collection?
This template shines across sectors:
- Business Professionals: Visualize quarterly reports with 3D matrices showing performance metrics.
- Marketing Teams: Highlight campaign ROI using volumetric squares for impact.
- Educators: Teach geometry or data concepts with interactive 3D models.
- Consultants: Deliver insights via layered squares representing multi-faceted strategies.
In architecture, for instance, architects can adapt these for volumetric studies, aligning with AIA guidelines on 3D modeling for project visualizations, turning abstract plans into tangible previews.
Real-World Applications and Tips
Picture a consultant using this in a strategy session: Start with a 3D square grid for risk assessment, each square's height representing probability. Transition to process flows where squares connect in 3D space, illustrating workflows. Tips: Balance 3D effects to avoid clutter - use lighter shades for background elements. Integrate with tools like Excel for live data links. A case study from a tech firm showed 30% higher engagement when switching to 3D visuals, mirroring trends in visual communication studies.
Seamlessly weave this into your routine: Download, customize, present. It's not just slides; it's a gateway to more persuasive communication.
Frequently Asked Questions
- What makes the 3D effects stand out?
- The template uses advanced shading and perspectives to create realistic depth, enhancing data comprehension.
- Can I edit the 3D elements easily?
- Yes, all aspects are customizable via PowerPoint's native tools, no extra software needed.
- Is it suitable for Google Slides?
- While optimized for PowerPoint, it imports well into Google Slides with minor adjustments.
- How many chart variations are there?
- 18 slides offer multiple 3D square styles, from basic to complex configurations.
- Ideal for which industries?
- Great for tech, education, and design fields like architecture for volumetric data reps.
- Any tips for first-time users?
- Start with simple customizations and preview in 3D mode for best results.