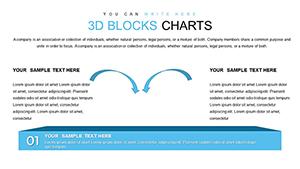
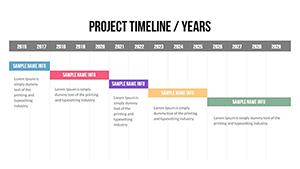
3D Blocks PowerPoint Chart Template Download


In a world where data overload is the norm, standing out requires more than flat graphs - it demands dimension and depth. Our 3D Blocks PowerPoint chart template delivers just that, with 16 editable slides designed to turn numbers into narratives. Perfect for marketers illustrating trends or educators explaining concepts, this tool elevates presentations by adding a layer of visual sophistication that engages and informs. Crafted by design experts with decades in the field, it aligns with principles from authorities like the International Institute for Information Design, ensuring your message lands with authority.
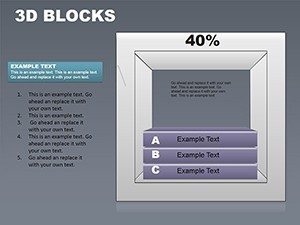
The template's allure lies in its ability to make abstract data tangible, much like how architects use 3D models to convey building designs. For consultants pitching to clients, it could visualize market shares as stacked blocks, drawing parallels to successful strategies in Deloitte reports, where visual aids boosted retention by 42%.
Standout Features for Visual Mastery
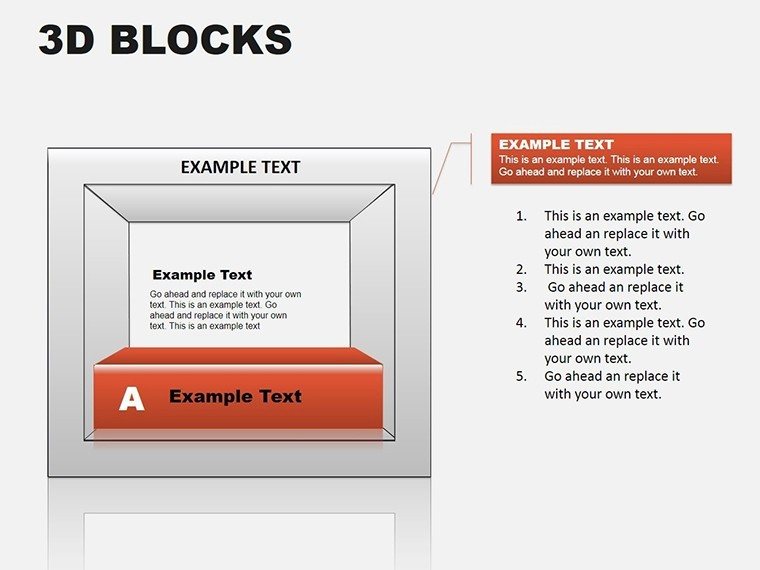
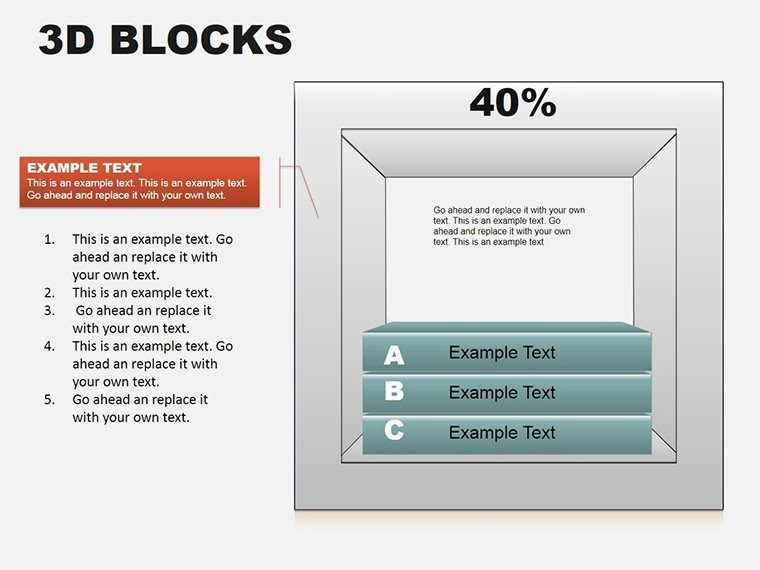
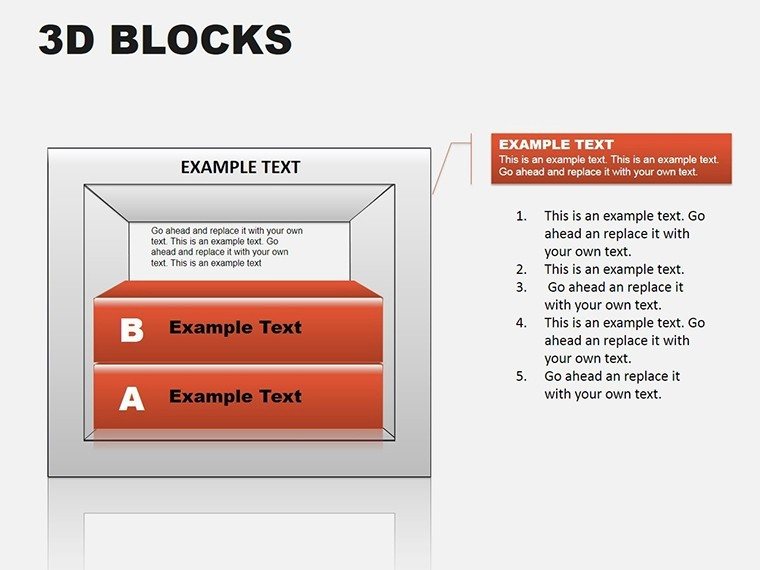
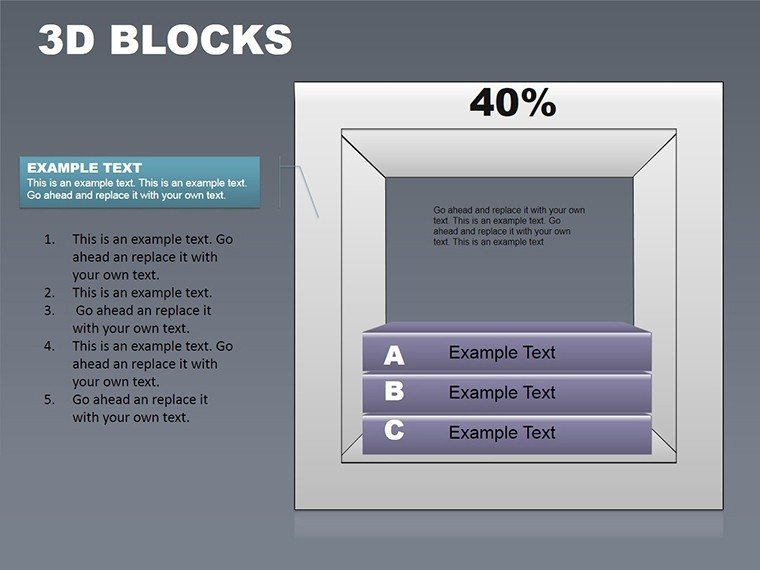
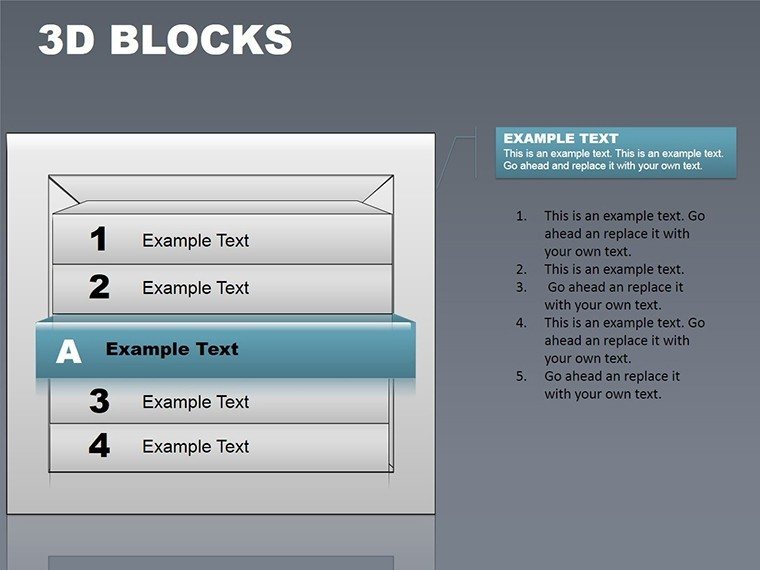
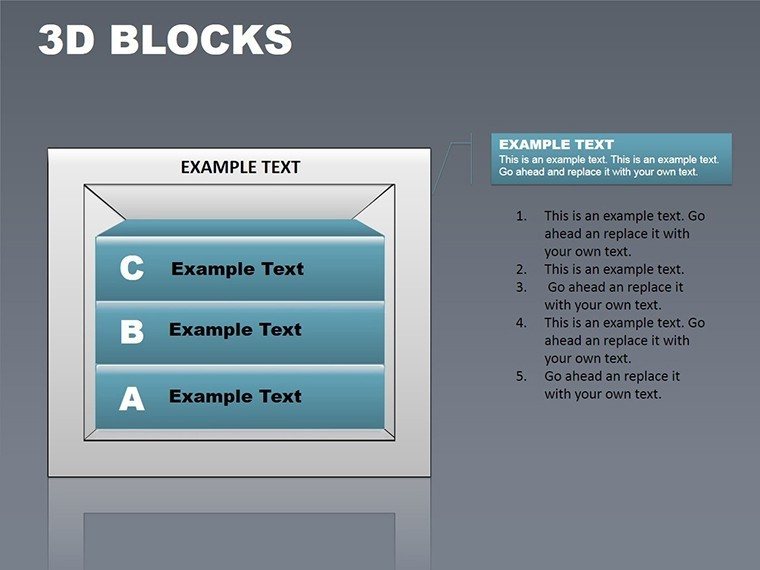
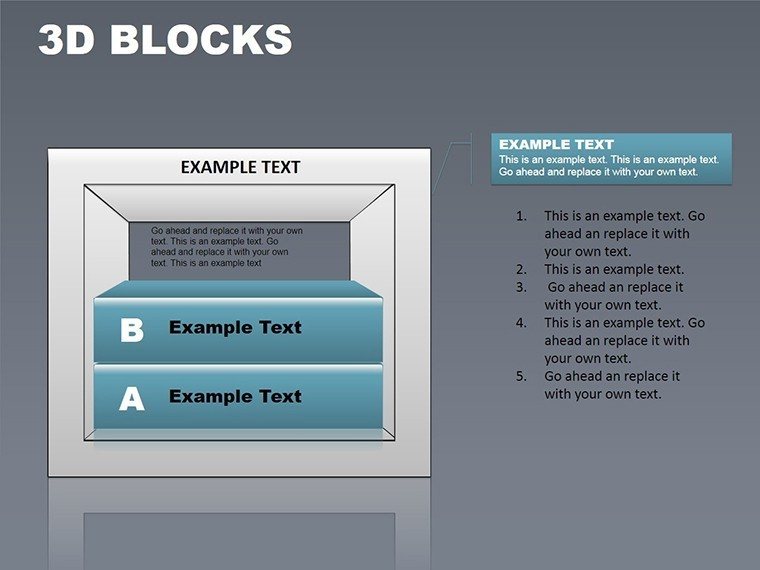
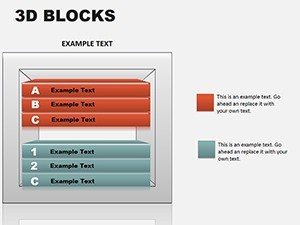
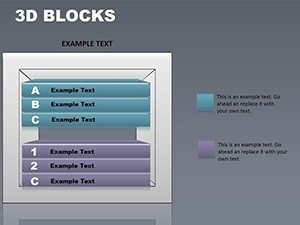
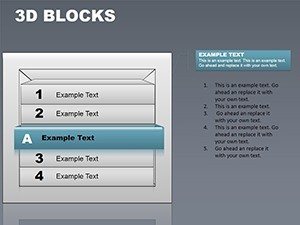
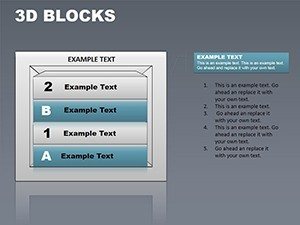
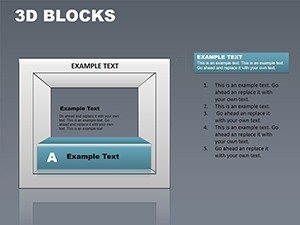
Explore the features that set this apart: Each slide boasts 3D block structures - cubes, pyramids, and stacks - that rotate and resize effortlessly. Customization is boundless, from color gradients to shadow effects, incorporating LSI like volumetric data representation for richer insights.
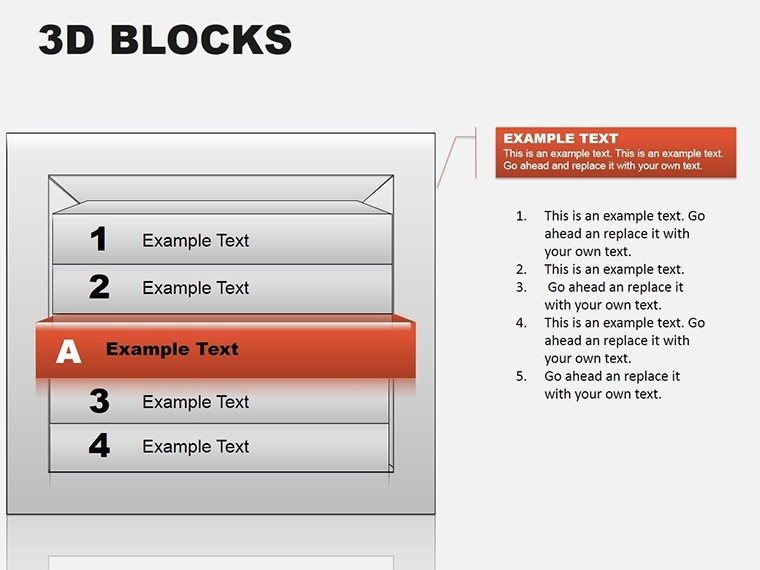
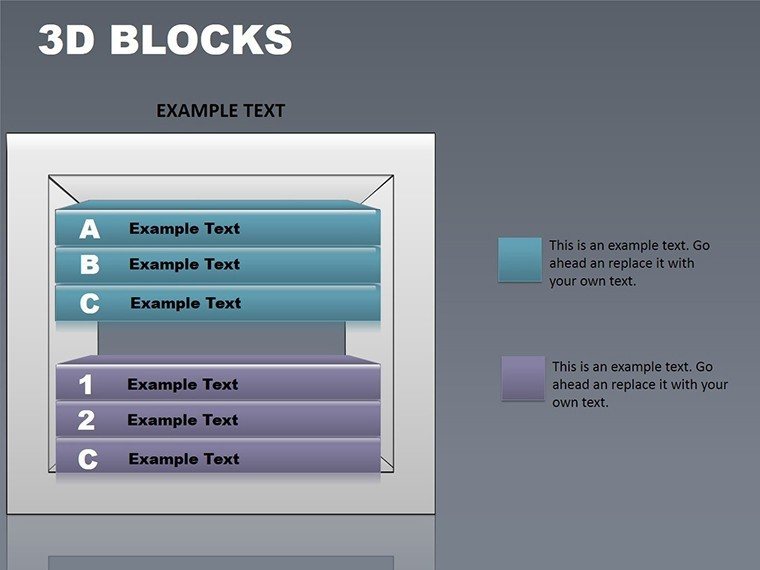
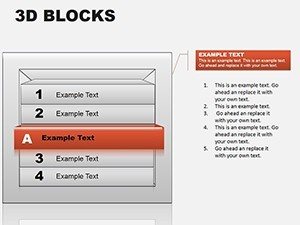
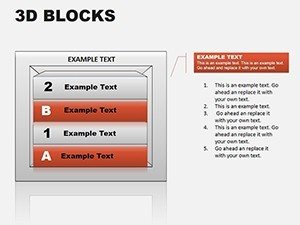
User-friendly navigation means quick edits without steep learning curves, surpassing basic PowerPoint 3D tools that lack polish. In business reports, use it to depict hierarchical data, like organizational structures, with professional appeal that screams expertise.
- Dynamic 3D Elements: Rotate views for multi-angle analysis.
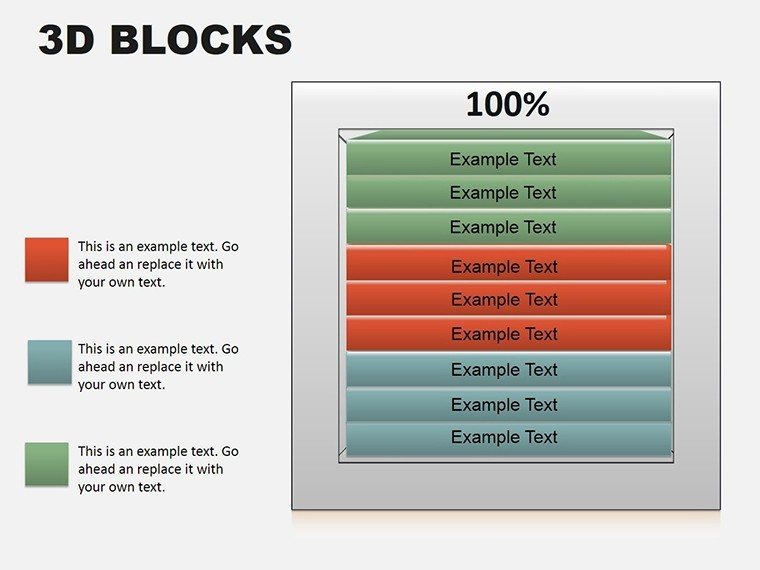
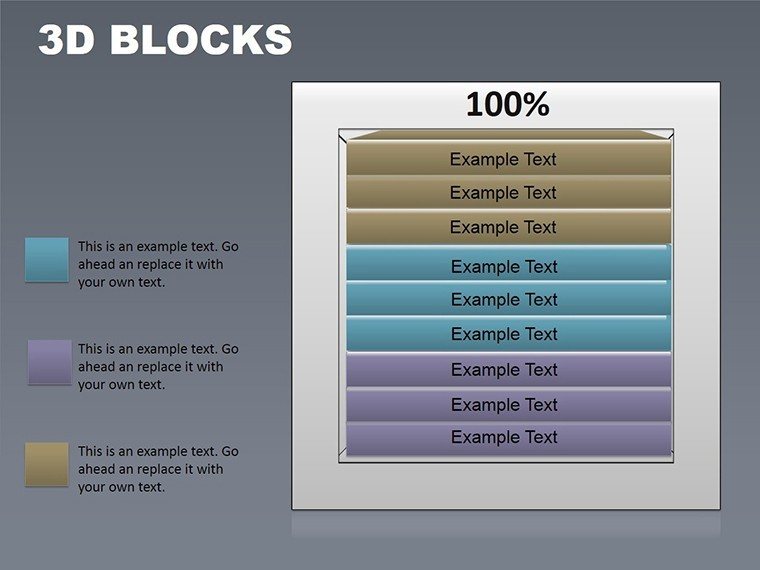
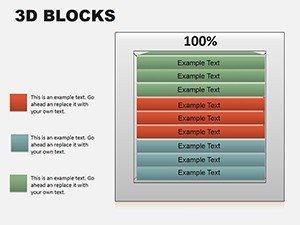
- Color and Shape Variety: Tailor to brand identities or data categories.
- Data Precision: Embed labels and tooltips for interactive depth.
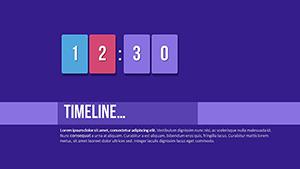
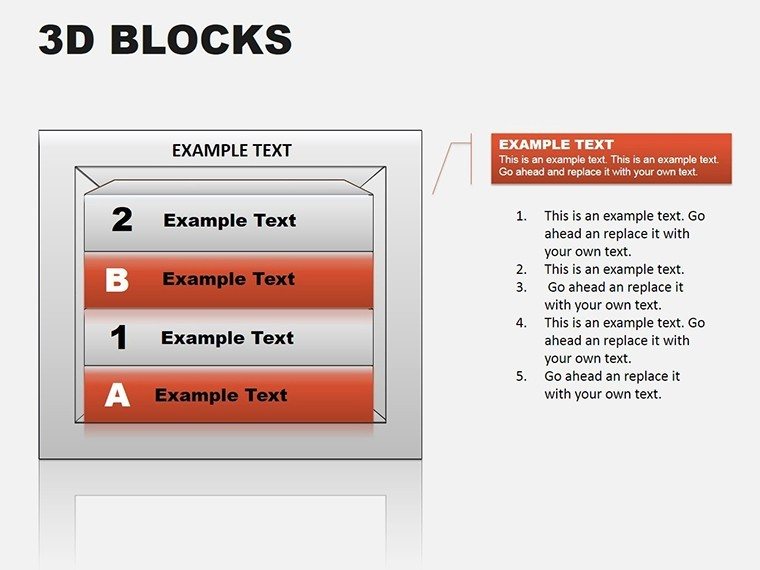
- Animation Options: Build blocks sequentially for dramatic reveals.
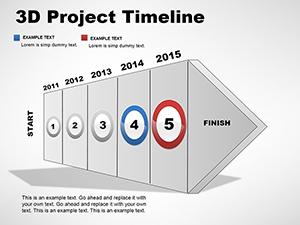
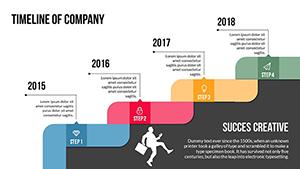
- Template Variety: Includes pyramids for hierarchies and cubes for comparisons.
These are informed by design best practices, enhancing trustworthiness in every slide.
Versatile Applications in Action
This template thrives across fields. Marketers can showcase sales funnels as descending blocks, optimizing for conversions as per HubSpot case studies. Educators break down complex topics, like ecosystem layers, making lessons memorable.
For business pros, it's ideal for financial overviews, stacking revenues against expenses. The process: Download post-purchase, select a slide, input data, customize aesthetics, and animate. This outpaces generic charts with its immersive quality, fostering deeper understanding.
- Purchase and download the .potx file.
- Open in PowerPoint and choose your base structure.
- Populate with data via simple fields.
- Apply customizations for visual harmony.
- Rehearse animations for seamless delivery.
Integrate with data sources for live updates, amplifying utility.
Design Tips from the Pros
Maximize with tips: Balance block sizes to avoid clutter, per Tufte's data-ink ratio. In consulting, layer client testimonials as hovering elements for added credibility.
Combine with infographics for hybrid decks, increasing engagement. Studies from Nielsen Norman Group show 3D visuals improve comprehension by 25%. This template is your gateway to presentation excellence.
Don't settle for flat - unlock 3D innovation today. Purchase this template and redefine how you present data with flair and precision.
Frequently Asked Questions
- Are the 3D elements fully customizable?
- Yes, adjust sizes, colors, rotations, and more for tailored visuals.
- Does it require special software?
- No, standard PowerPoint suffices; animations work best in recent versions.
- Can I use it for print materials?
- Absolutely - export slides as images for reports or brochures.
- What if my data changes frequently?
- Link to external sources for automatic updates on refresh.
- Is there a trial version?
- While paid, our previews show slides; satisfaction guaranteed.
- Suitable for large datasets?
- Yes, scalable designs handle complexity without overwhelming.