Abstract Elements Charts: Stunning PowerPoint Visuals


Type: PowerPoint Charts template
Category: Arrows
Sources Available: .pot, .potx
Product ID: PC00060
Template incl.: 9 editable slides
Envision your next presentation not as a slide deck, but as an abstract canvas where data dances in fluid forms, evoking the same intrigue as a parametric facade in modern architecture. Our Abstract Elements PowerPoint Charts template invites creatives, strategists, and educators to reimagine data visualization with 9 editable slides that blend artistry and analytics. Perfect for unveiling conceptual designs or narrating growth trajectories in a gallery-style pitch.
Rooted in visual case study triumphs, like SlideGenius' formats that helped a VC firm distill startup metrics into image-driven stories - boosting pitch success by 35% - this template empowers you to do the same. Architects can abstractly chart form explorations, turning vector diagrams into compelling arguments for innovative structures that push boundaries.
Harness the Art of Abstract Data Storytelling
Abstract visuals transcend the ordinary, inviting viewers to interpret layers of meaning much like interpreting blueprints through elevations and sections. This template's modern motifs - swirling lines for trend evolutions, geometric bursts for impact metrics - align with Piktochart's advocated formats for research presentations, where abstraction clarifies rather than confuses.
A Portland design collective, employing similar abstract charts in a competition entry for a cultural center, wove in sustainability data via ethereal flows, clinching the bid by evoking emotional resonance alongside empirical proof.
Universal Compatibility for Creative Flows
Optimized for PowerPoint with .potx delivery, it adapts effortlessly to your creative suite, allowing exports to Adobe for further abstraction or direct shares in collaborative tools like Miro.
Core Features: Where Form Meets Function
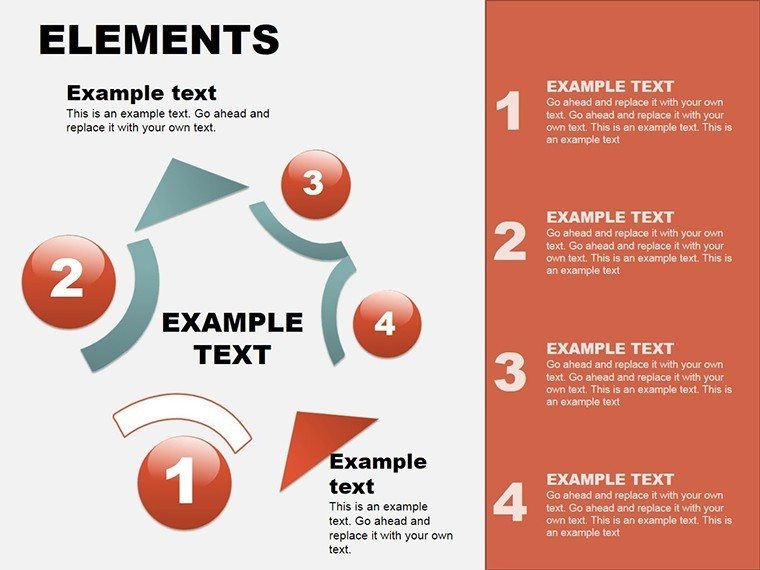
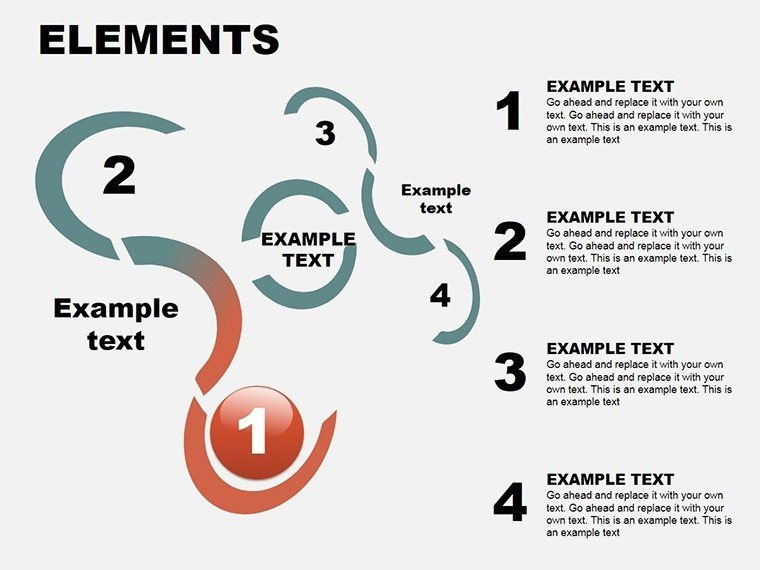
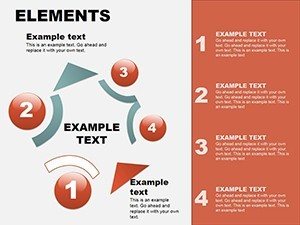
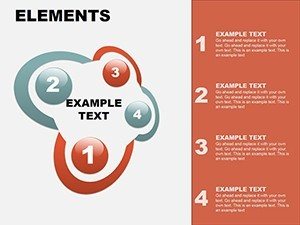
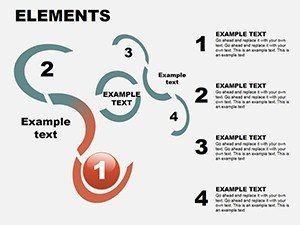
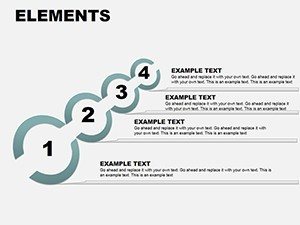
- 9 Striking Slides: From radial abstracts to layered compositions, each primed for your unique data infusion.
- User-Friendly Edits: Reshape elements, recolor to evoke moods - from cool blues for serene landscapes to fiery reds for urgent timelines.
- Versatile Applications: Suited for reports, lessons, or updates, echoing the multi-use ethos of ACCP's visual abstracts.
- Time-Efficient Design: Pre-crafted to liberate your focus for content depth over pixel pushing.
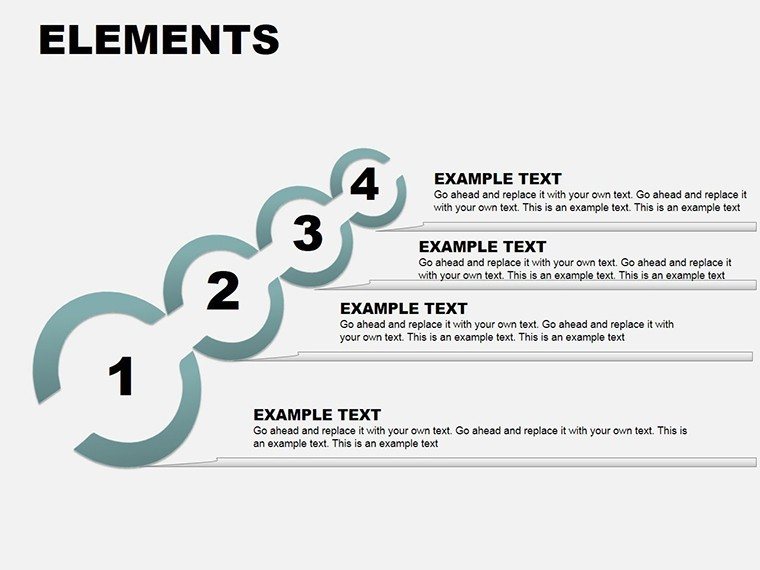
- Scalable Vectors: Maintain crispness at any zoom, ideal for large-format prints in portfolio reviews.
These elements shine in educational contexts, as seen in Mind the Graph's case studies, where abstract visuals accelerated learner uptake in complex topics like biomimicry in architecture.
Use Cases: Abstracting Ideas into Impact
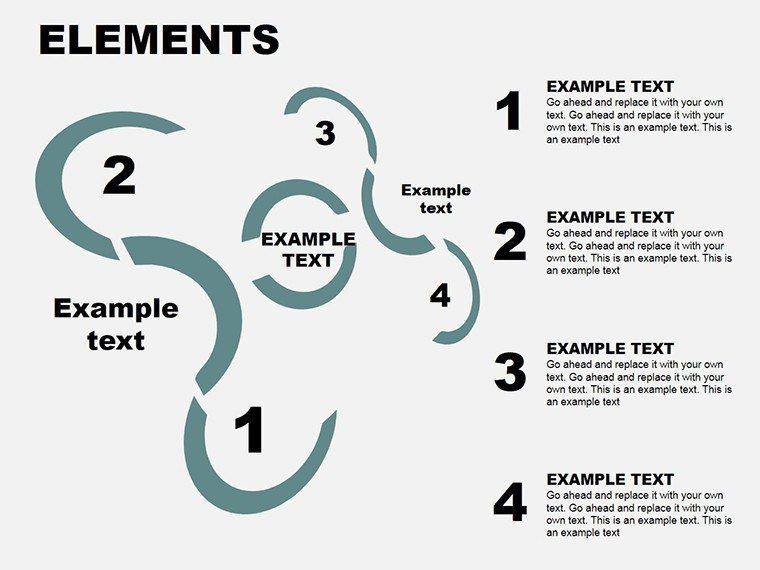
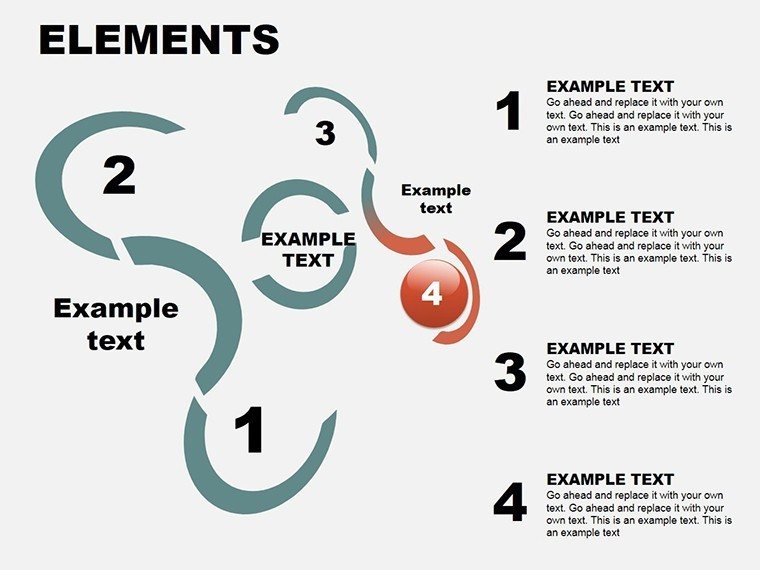
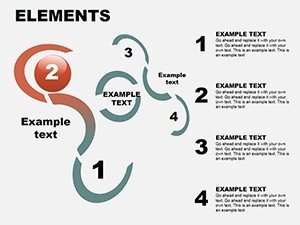
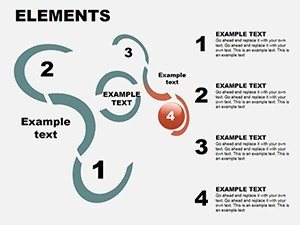
Business leaders can employ Slide #4's swirling trend chart to abstract quarterly performances, layering economic indicators over design trend shifts - a nod to INK PPT's successful poster analyses that engaged hybrid audiences.
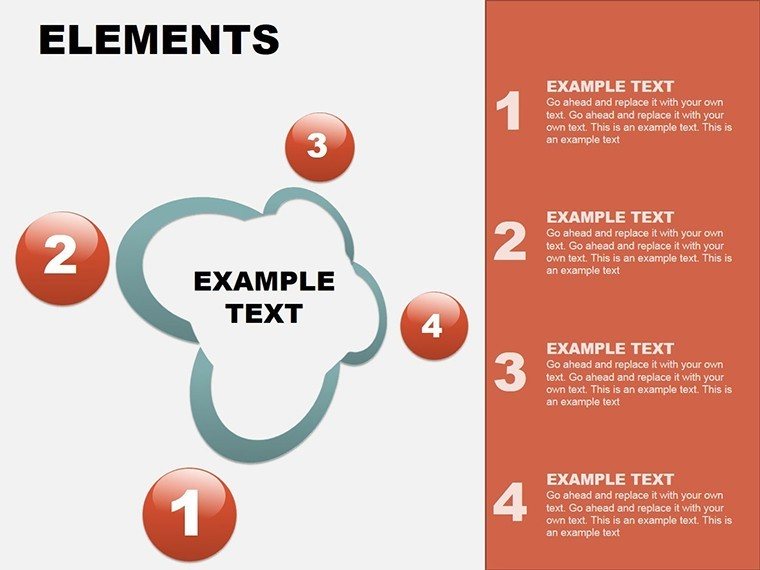
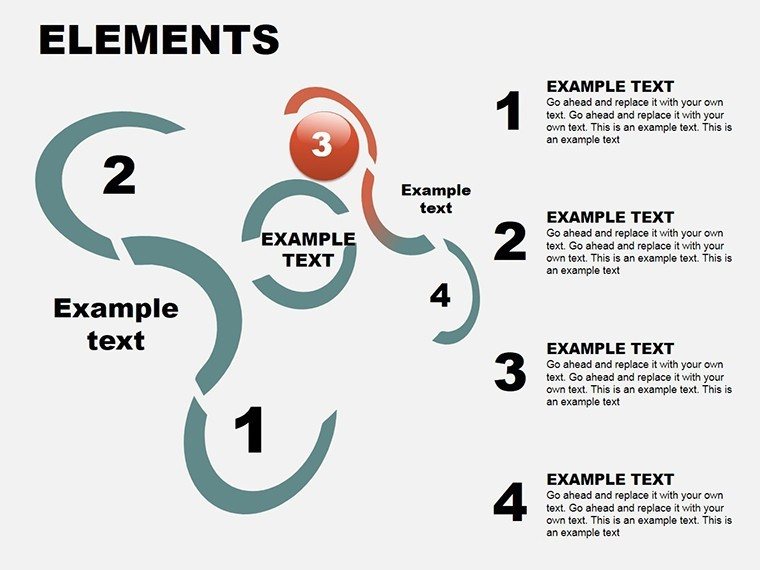
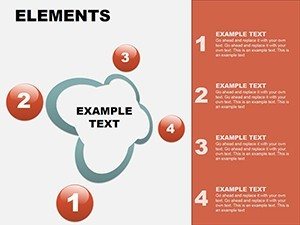
For project updates, Slide #6's geometric burst illustrates milestone achievements in a heritage restoration, with abstract forms representing preservation vs. modernization tensions.
- Conceptualize: Map data to abstract metaphors, like flows for process evolutions.
- Infuse: Input via intuitive tables; watch forms morph responsively.
- Enhance: Add subtle fades to build narrative tension, akin to storyboarding.
- Present: Iterate based on real-time polls, refining abstractions on the fly.
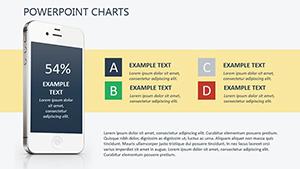
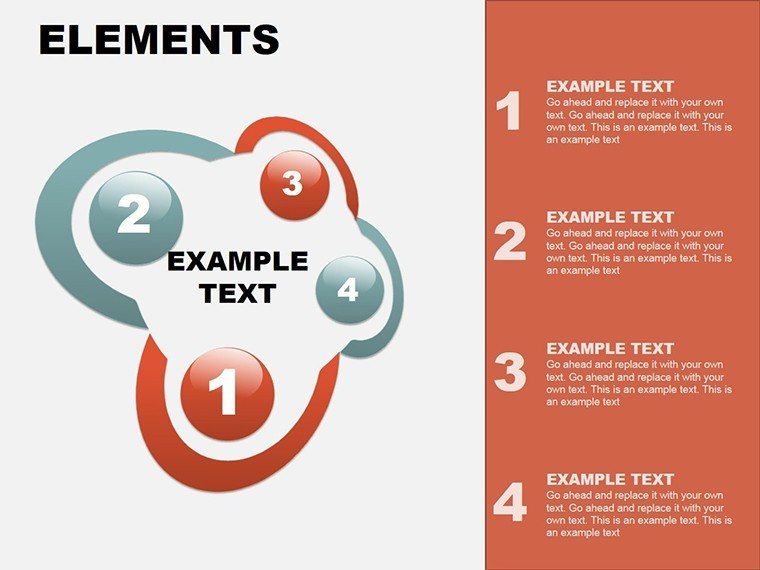
Creatives in firms adore Slide #2 for mood boards turned data viz, abstracting client feedback into visual symphonies that inspire revisions.
Insights from Visual Experts
Embrace negative space in abstracts to guide the eye, per Gestalt cues in presentation design. Test with focus groups to ensure interpretations align with intent - vital for cross-cultural pitches in global architecture.
Unleash Creativity - Download and Design
Abstract your data into art that lingers. This template isn't just slides; it's a portal to visionary communication. Secure yours today and let your presentations abstractly soar!
Frequently Asked Questions
What makes these charts visually unique?
Modern abstract designs that blend art and data for engaging, non-literal interpretations.
Suitable for design education?
Yes, excels in illustrating abstract concepts like spatial dynamics in architecture classes.
Editing tools required?
Standard PowerPoint suffices; no extras needed for full customization.
Export options for portfolios?
High-res PDF and image exports preserve abstract integrity.
How abstract for conservative audiences?
Tone down with solid fills while retaining core visual appeal.