Table Box PowerPoint Charts - Instant Download | ImagineLayout


What's Inside the Download
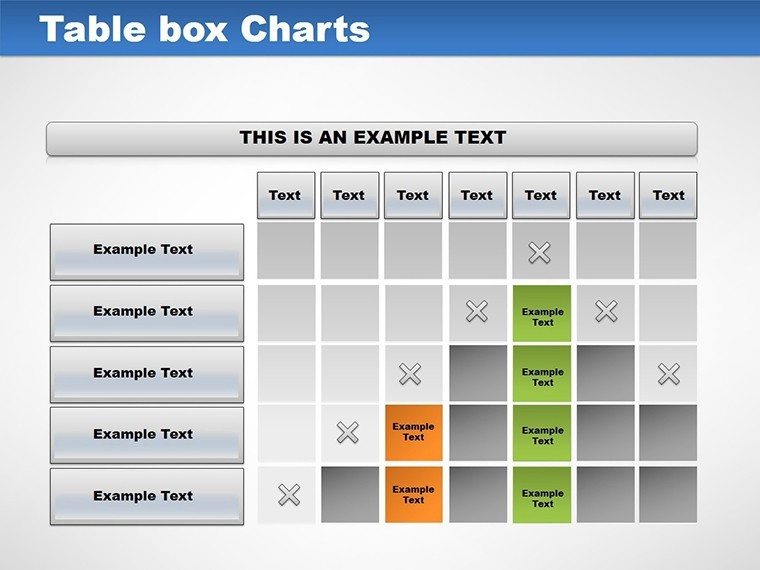
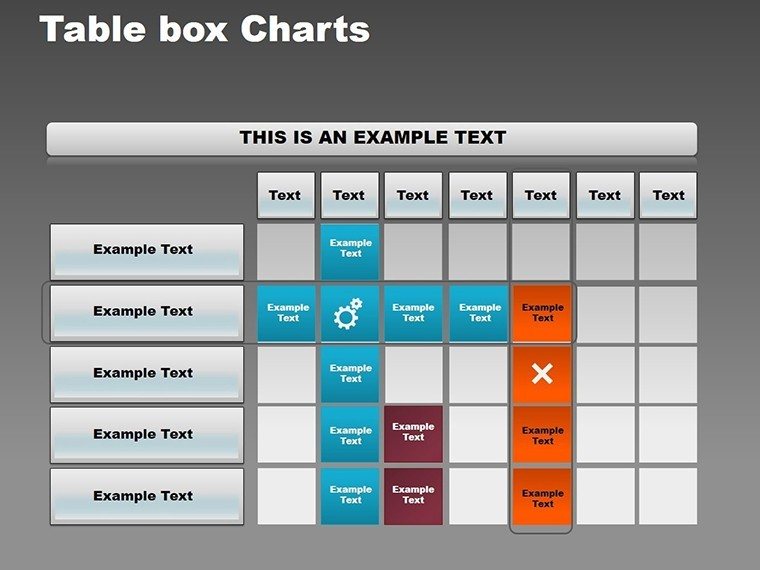
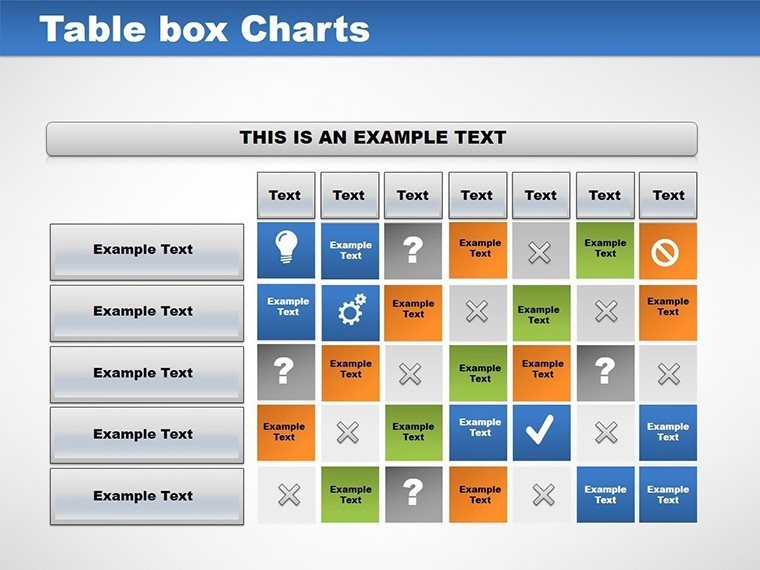
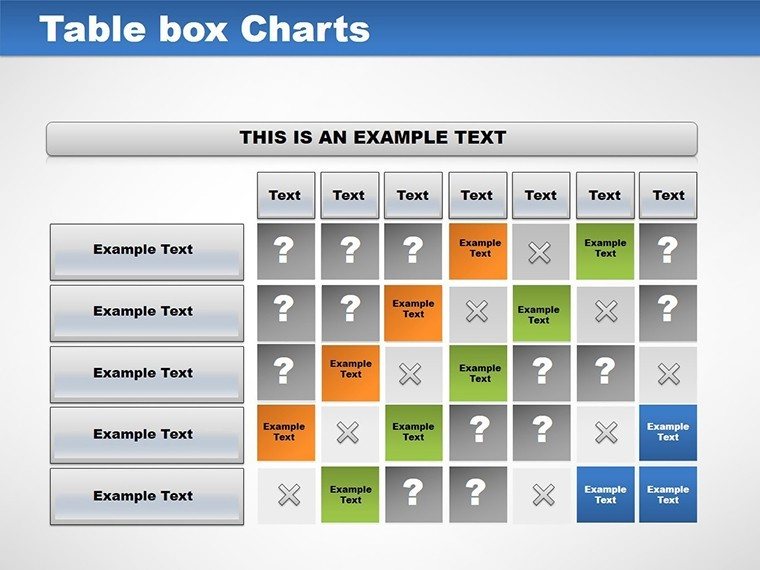
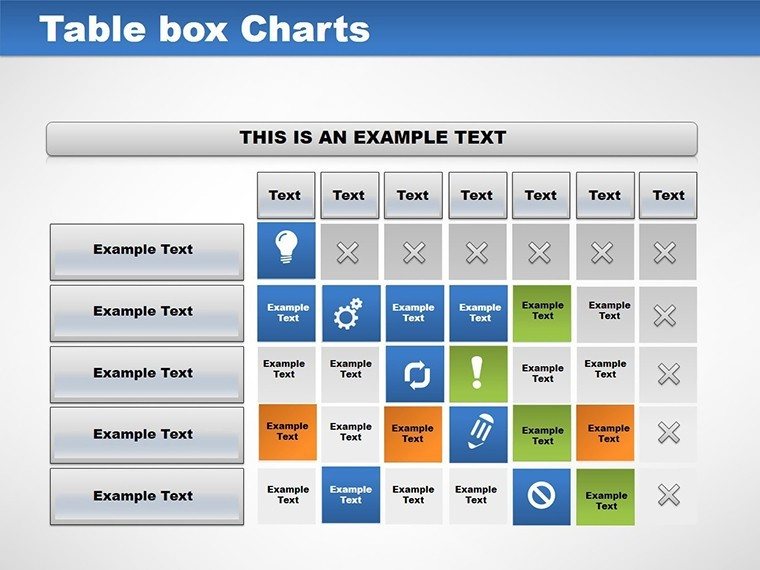
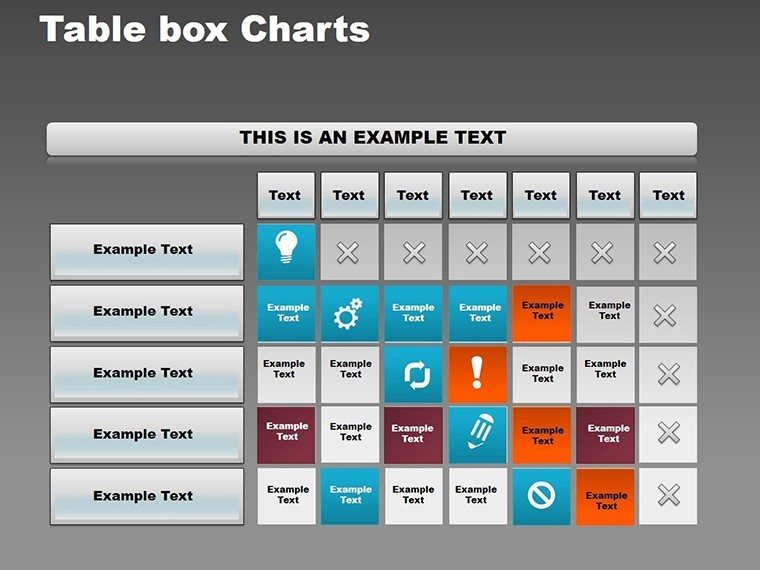
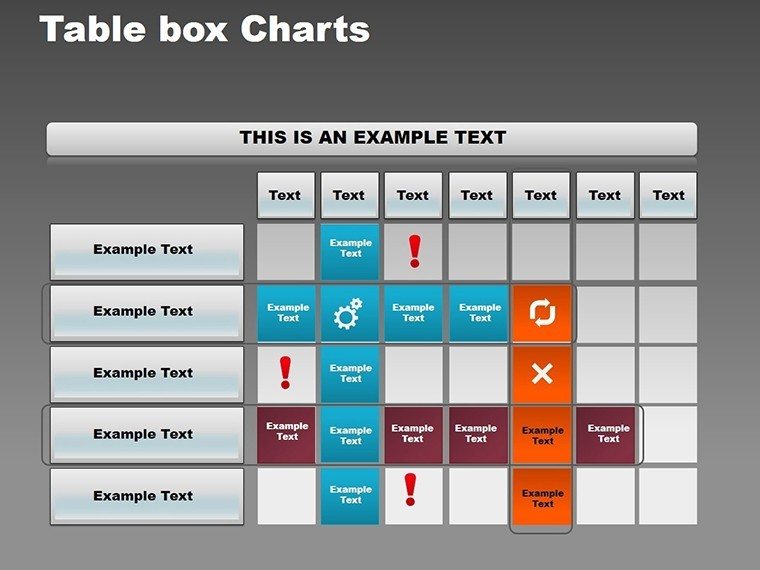
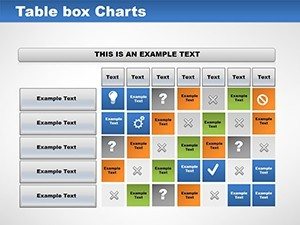
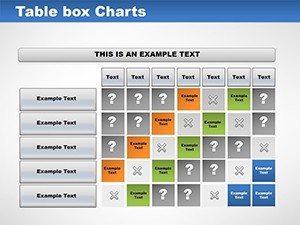
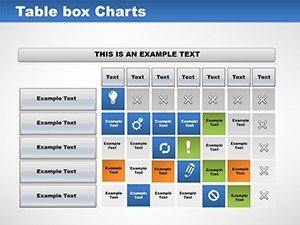
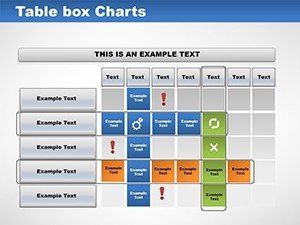
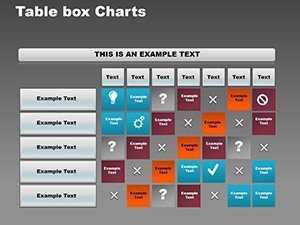
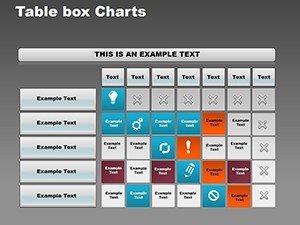
11 slides deliver matrix-style table boxes in .pot and .potx formats for data organization.Layouts divide information into quadrants and segments, supporting comparisons in business presentations.Compared to single-grid designs, these incorporate multiple box variations for flexible diagram structures.
Core Components
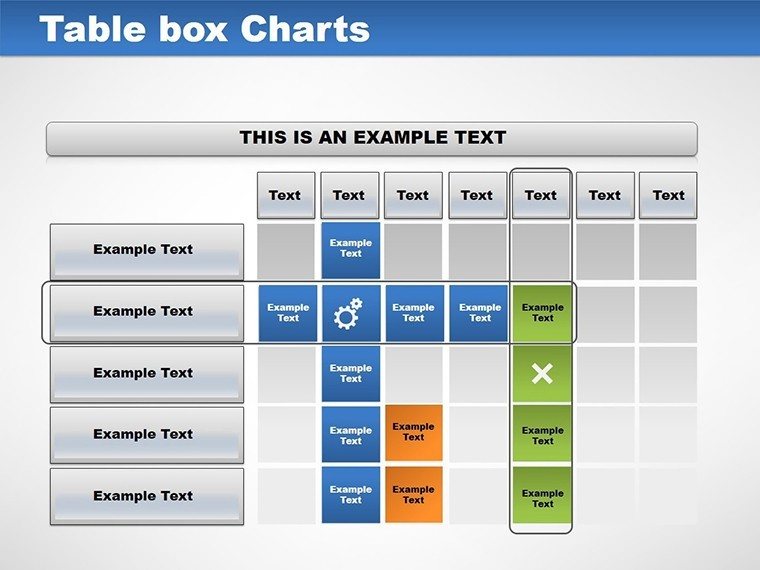
The boxes enable clear flow direction in consulting decks. Each slide allows independent adjustments to maintain layout composition.
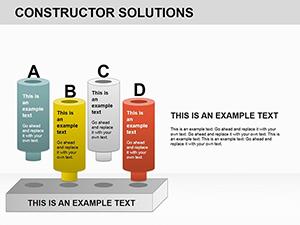
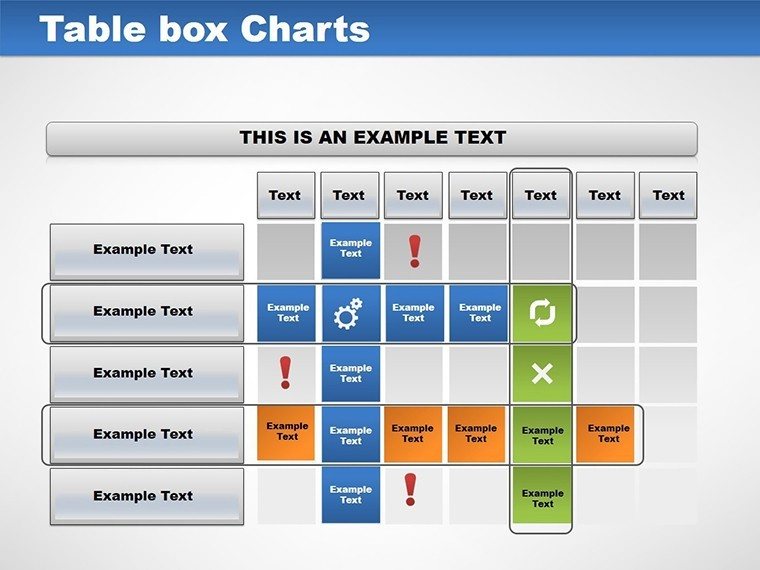
- Quadrant matrices for feature comparisons
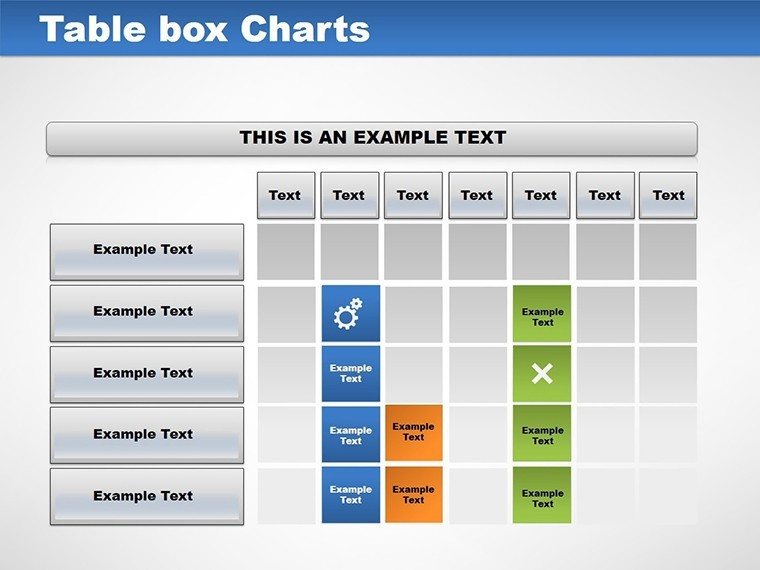
- Segmented boxes for data grouping
- Labeled grids with color contrast
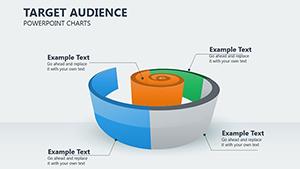
Marketers use these for audience segmentation during sales presentations, ensuring every element aligns with information spacing requirements.
Technical Specs
| Feature | Details |
|---|---|
| Slides included | 11 with box matrix variations for data visualization |
| Diagram categories | Quadrant tables, segmented grids, comparison boxes |
| Editable elements | Boxes resize freely, text fits placeholders, borders adjust in weight |
| Aspect ratio | 4:3 standard for compatibility |
| PowerPoint compatibility | Opens in 2010, 2013, 2016, 2019, 365 editions |
| Color schemes | Base scheme modifiable via theme settings |
| Icon layers | Replaceable icons without shifting grid alignment |
Specs cover both editing and export needs. Users handle format compatibility across versions.
Adapting the Template to Your Brand
| Step | Time Estimate |
|---|---|
| 1. Load .potx in PowerPoint | 1 minute |
| 2. Insert data into boxes | 4 minutes |
| 3. Update colors in master | 2 minutes |
| 4. Adjust labels and borders | 3 minutes |
| 5. Save as .pptx or PDF | 1 minute |
Moderate difficulty fits users with basic skills. This supports teams in quarterly reviews through color theme adjustments.Diagram connectors add if needed for enhanced visual hierarchy.
Who Reaches for This Template
Marketing teams in retail use these box charts for competitor analysis presentations.They structure features and pricing into quadrants, reusing across campaigns by changing labels.The setup cuts prep time from 2 hours to 30 minutes.
Educators in training firms apply the matrices during workshop sessions on strategy.Grids segment concepts clearly for participants, aiding in investor decks.One user adapted the same file for five modules.
Secure your download for immediate use.
Why This Template, Not a Blank Slide
Building box matrices from zero demands 3 hours and advanced grouping skills to avoid uneven spacing.Common errors include overlapping labels that disrupt zone segmentation in strategy meetings.This option starts with pre-aligned grids, requiring only intermediate edits for text placeholders.
Designs often cram labels inside boxes, limiting visibility in large rooms.The approach here uses external labels with connectors, improving readability for board briefings.Analysts combine these with alternative solution grids for comprehensive reports.
Browse additional matrices in the matrix PowerPoint charts category.For related visuals, try sales infographic layouts.
Purchase to streamline your next data presentation.
Which PowerPoint versions support this?
The template opens in PowerPoint 2010 and later, including 365. Mac versions handle the .potx format without issues. If using 2007, some box alignments may shift. Always verify by testing the file in your environment before final use.
How to modify the color theme?
Go to View > Slide Master to access the theme. Choose Colors and select your palette for global changes. Fine-tune individual boxes using the Shape Format tab. This keeps the grid structure intact while applying brand consistency.
What usage rights come with the license?
The license covers internal and client presentations, including paid consulting work. You cannot resell or distribute the original files. Modifications for various projects are encouraged. Include in client deliverables as long as the template isn't the primary product sold.
Free vs paid: what's different?
This product has no free tier available. Paid buyers receive all 11 slides with complete matrix variations. No limitations on box types or edits apply. The full package provides every feature from the start.
Can I add animations to the boxes?
Animations are supported through the Animations pane. Add entrances for segments or emphasis on labels. Remove defaults if needed for static views. Preview in slideshow mode to confirm timing across devices.
What file formats are provided?
.pot for template application and .potx for modern editing. PowerPoint opens both directly. Export to PDF for non-editable sharing. No other formats like Keynote are included.