Triangular Pyramid PowerPoint Charts Template


Visualizing hierarchical data or layered concepts has never been more intuitive than with our Triangular Pyramid PowerPoint Charts Template. Tailored for business analysts, educators, and researchers, this set of 8 editable slides turns abstract ideas into tangible pyramids that guide audiences through levels of information. Compatible with PowerPoint and Google Slides, it features modern designs that emphasize progression, from base foundations to pinnacle achievements. Picture showcasing organizational structures in a corporate report or breaking down research methodologies in an academic presentation - these pyramids add depth and clarity, making complex topics accessible. Beyond mere charts, this template fosters storytelling, where each layer builds on the last, encouraging viewer retention and insight. Perfect for those who want to elevate their slides from flat to multifaceted, it's a game-changer for impactful communication.
Delving into Pyramid Visualization Mastery
Pyramids symbolize stability and ascent, drawing from architectural marvels like the Giza pyramids to represent data hierarchies. In business, they mirror Maslow's needs or project phases; in education, they structure learning outcomes.
Essential Features for Dynamic Presentations
- Layered Customization: Edit each pyramid level independently, adjusting texts, colors, and sizes to fit your narrative.
- Table Integrations: Combine pyramids with tables for data-rich displays, like metrics per level.
- Animation Capabilities: Animate builds to reveal layers sequentially, enhancing dramatic effect.
- Professional Aesthetics: Sleek lines and gradients for a contemporary look, aligned with UI/UX best practices.
- File Flexibility: .pot and .potx formats ensure broad compatibility.
These tackle challenges like information overload, providing structured visuals that simplify digestion.
Comprehensive Slide Details and Scenarios
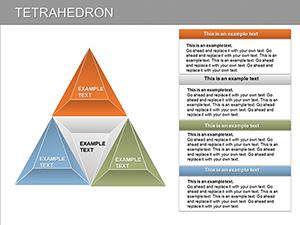
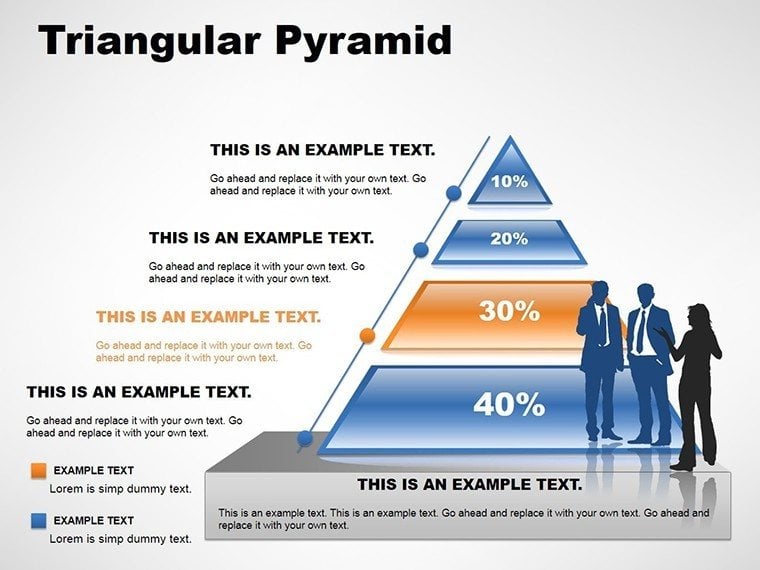
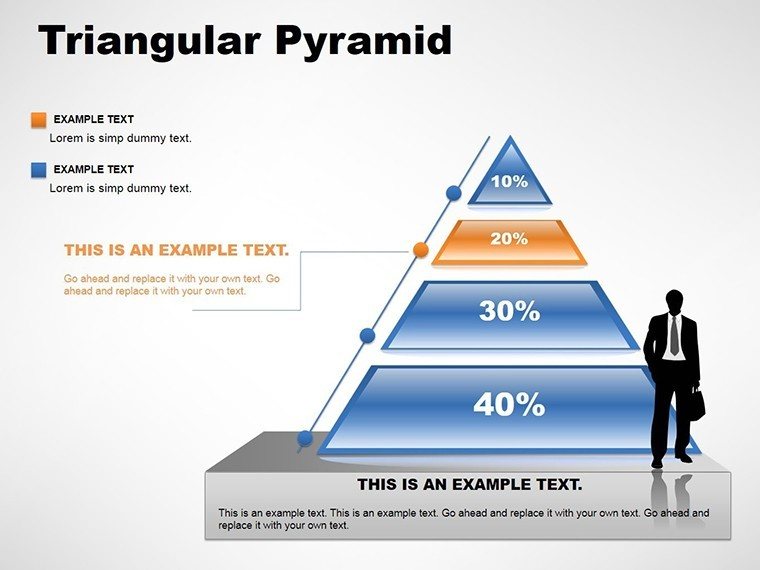
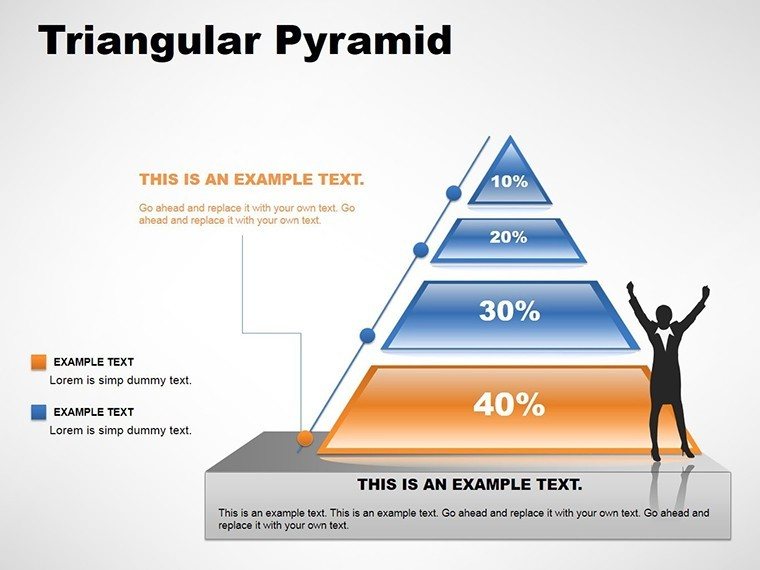
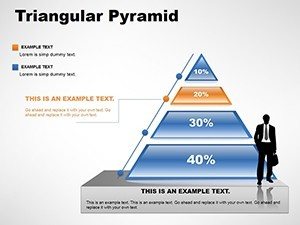
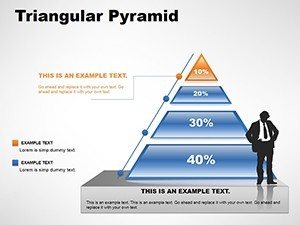
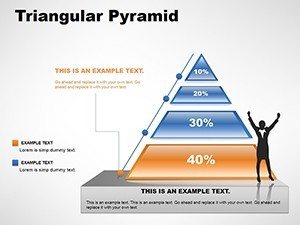
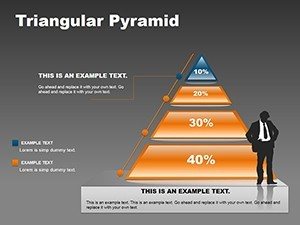
Slide 1 presents a basic triangular pyramid for overviews, labeling base as inputs and top as outcomes - great for executive summaries.
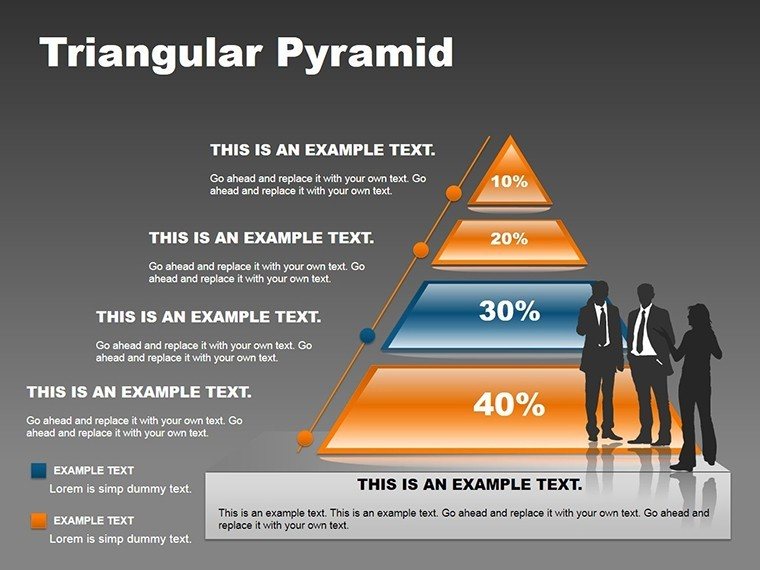
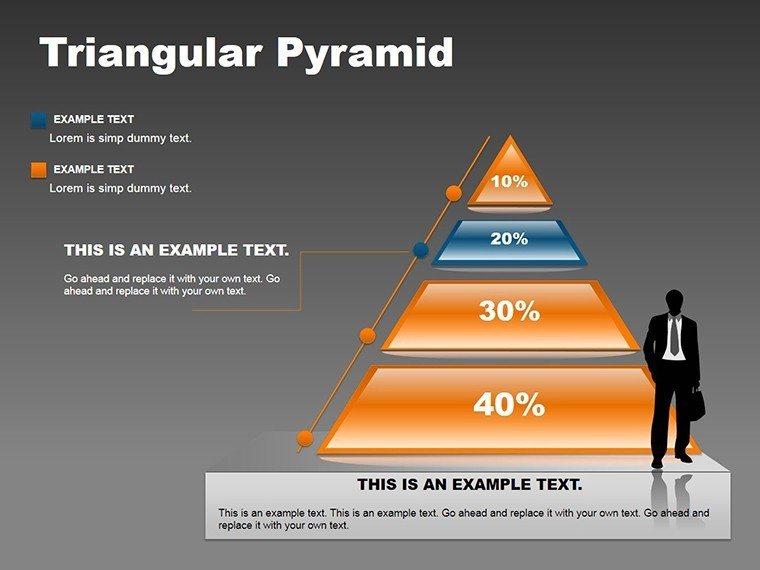
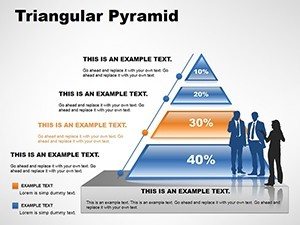
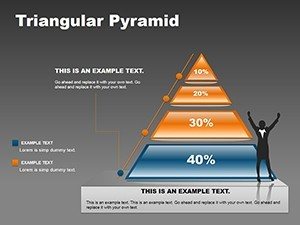
Slides 2-4 expand on hierarchies: Slide 2 segments into three levels for simple chains, like supply management. A logistics firm used it to visualize vendor tiers, optimizing partnerships per case studies from Supply Chain Management Review. Slide 3 adds four layers for detailed breakdowns, Slide 4 incorporates side tables for annotations.
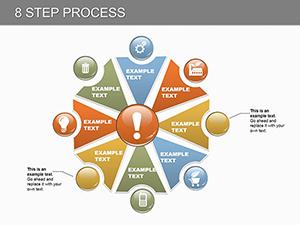
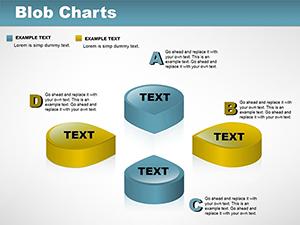
Advanced pyramids in Slides 5-6: Slide 5 inverts for funnel analyses, like sales pipelines. Slide 6 rotates for 3D effects, ideal for virtual reality concepts in tech pitches.
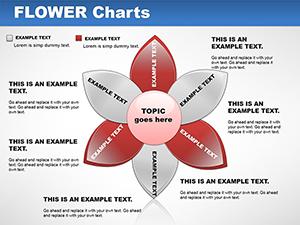
Hybrid designs (Slides 7-8): Combine with tables for comparative data, ending with a customizable conclusion slide.
In research, a university team employed these to present study phases, clarifying methodologies and boosting grant approvals.
Practical Implementations and Pro Advice
For marketers, use pyramids to map customer journeys; researchers can layer hypotheses to findings.
Tips: Use consistent color gradients for progression. Integrate with Visio for complex diagrams. Test on projectors for visibility.
Drawing from real-world apps, like in healthcare reports showing treatment hierarchies, these templates align with evidence-based practices.
Seamless Workflow Enhancements
Import data from Excel to populate levels automatically. Add icons for visual cues, turning pyramids into infographics.
Outperforms default shapes by offering pre-aligned symmetry, saving design effort.
Created with input from visualization experts, it upholds trustworthiness in data representation.
Transform Your Data Layers Now
With this Triangular Pyramid template, build presentations that ascend to new heights. Start customizing and lead your audience to peak understanding.
Frequently Asked Questions
How do I customize the pyramid layers?
Simply click and edit text or drag to resize; colors change via theme tools.
Does it support animations?
Yes, built-in for layer-by-layer reveals.
Ideal for what types of data?
Hierarchical, progressive, or segmented information.
Can I add tables to slides?
Absolutely, integrated designs allow seamless additions.
Number of slides?
8 fully editable ones.