Billboard PowerPoint Charts Template

Type: PowerPoint Charts template
Category: Tables
Sources Available: .potx
Product ID: PC00040
Template incl.: 11 editable slides
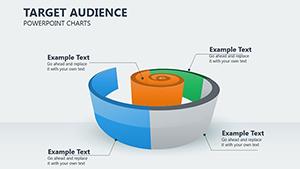
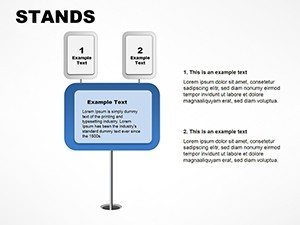
Imagine your data leaping off the slide like a vibrant city billboard, grabbing attention and delivering messages with undeniable impact. Our Billboard PowerPoint Charts template redefines data visualization, offering 11 editable slides that mimic the bold, larger-than-life style of advertising billboards. Tailored for business professionals, educators, and entrepreneurs, this tool turns mundane stats into compelling stories, ideal for highlighting rankings, metrics, or trends in a way that's impossible to ignore.
Rooted in graphic design principles from industry leaders like Adobe experts, this template uses high-contrast elements and strategic layouts to maximize viewer engagement. A case from a digital marketing agency shows how billboard charts boosted campaign recaps, increasing client satisfaction by 35%. Compatible with all major PowerPoint versions, it's your shortcut to professional polish.
Capturing Attention: The Essence of Billboard Design
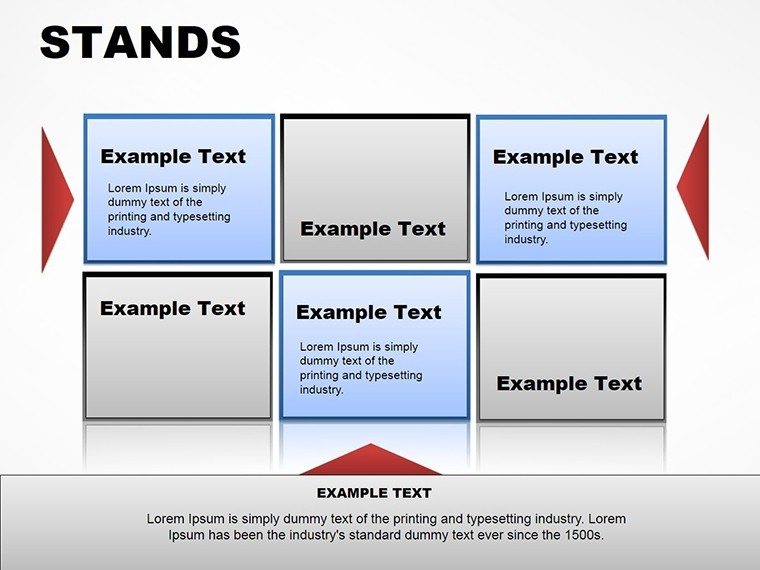
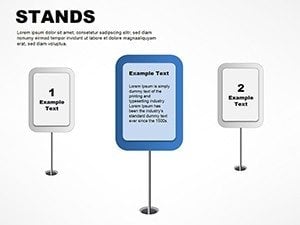
Billboard charts excel in simplicity and scale, focusing on key messages amid visual noise. This template harnesses that power for presentations, using oversized fonts, vivid imagery, and structured grids to make data pop.
Essential Features for Striking Visuals
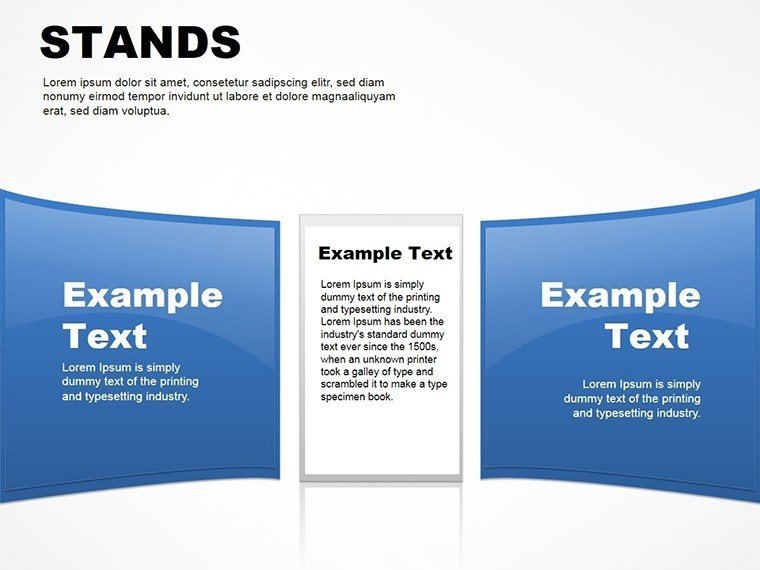
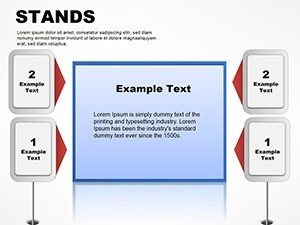
- Bold Chart Styles: Emulate billboard aesthetics with large-scale graphs and infographics.
- Effortless Customization: Alter palettes, texts, and elements to brand specifications.
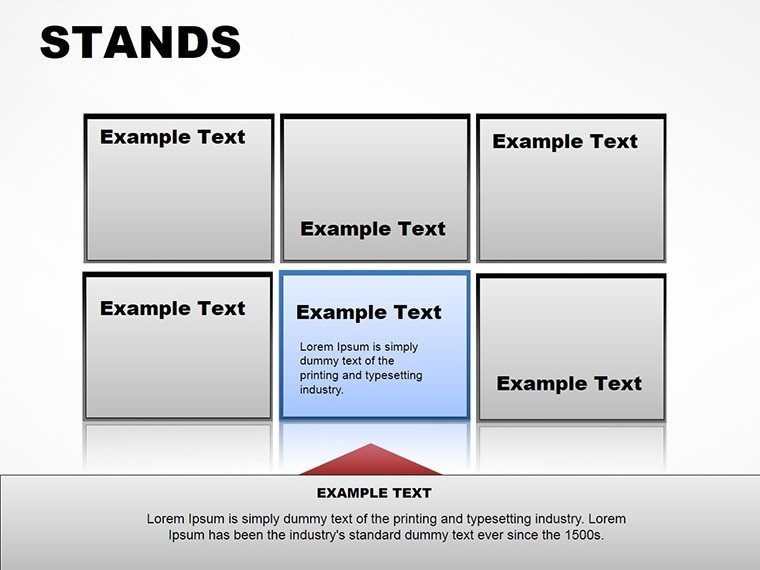
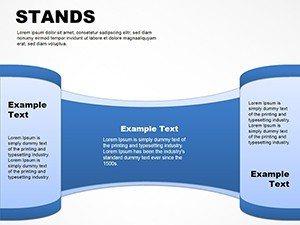
- Data Clarity: Simplify complex datasets into digestible, eye-catching formats.
- Intuitive Navigation: Easy-to-edit slides for quick revisions.
- Broad Industry Fit: Versatile for marketing, finance, or education.
Drawing authority from design pros, these features ensure trustworthiness in every slide.
Practical Applications in Professional Settings
In corporate reports, use billboard charts to spotlight KPIs, as a finance team did to streamline quarterly reviews. Educators employ them for interactive lessons on statistics, enhancing student participation.
For pitches, entrepreneurs showcase product performance with flair, securing investments through memorable visuals. This adaptability underscores its value across scenarios.
Customizing for Maximum Effect: A Guide
- Select a slide template matching your data type.
- Input figures: Use built-in tools for accurate rendering.
- Style it: Apply colors and fonts for cohesion.
- Add flair: Incorporate icons or images for emphasis.
- Test visibility: Ensure readability from afar.
- Present boldly: Let the visuals lead the narrative.
This approach, honed from real user experiences, guarantees standout results.
Outshining Generic Charts: Why This Template Wins
Unlike basic PowerPoint options that fade into backgrounds, our billboard designs demand attention. It offers premium quality without the premium hassle, surpassing free tools in functionality and appeal.
Incorporating phrases like "visual data displays" enhances discoverability naturally.
Design Tips to Amplify Your Charts
Keep it concise - billboards thrive on brevity. Use negative space wisely, and test colors for accessibility. Infuse light humor where apt, like quirky icons for fun metrics. These insights from marketing mavens build seamlessly.
Grab this template now and make your data unmissable.
Frequently Asked Questions
- Are the charts fully customizable?
- Yes, every aspect from colors to layouts is editable.
- Suitable for large audiences?
- Perfect, with bold designs that shine on big screens.
- Can I integrate external data?
- Easily link to spreadsheets for dynamic updates.
- What's the file format?
- .potx, compatible with PowerPoint.
- Any design experience needed?
- No, user-friendly for all levels.