3D Timeline PowerPoint Charts - Editable PPTX | ImagineLayout
Package Contents
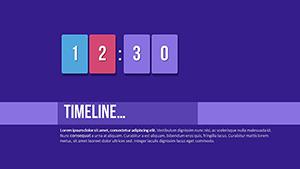
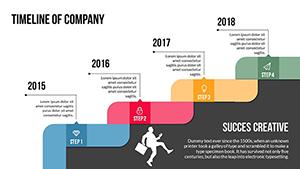
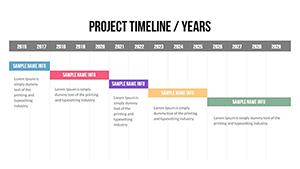
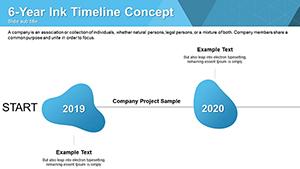
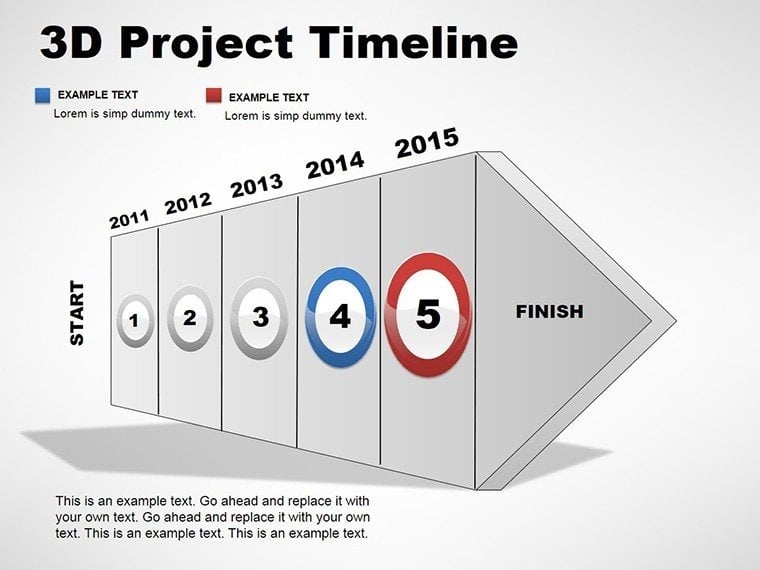
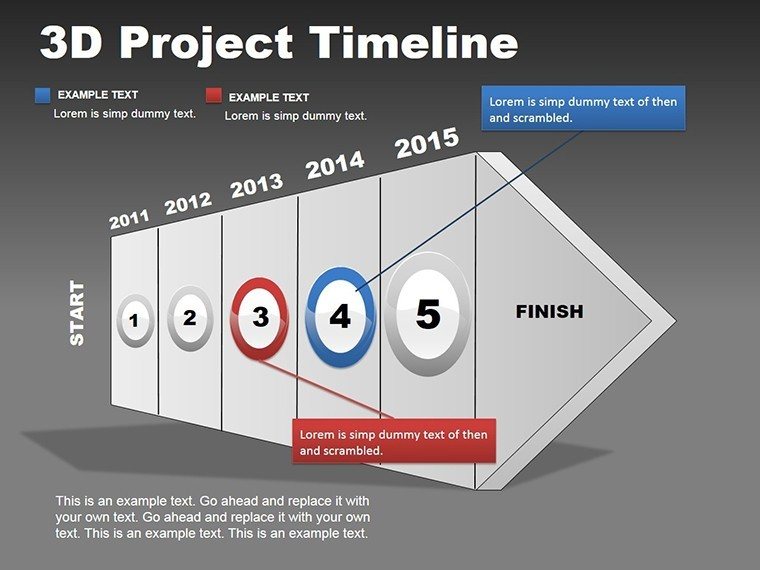
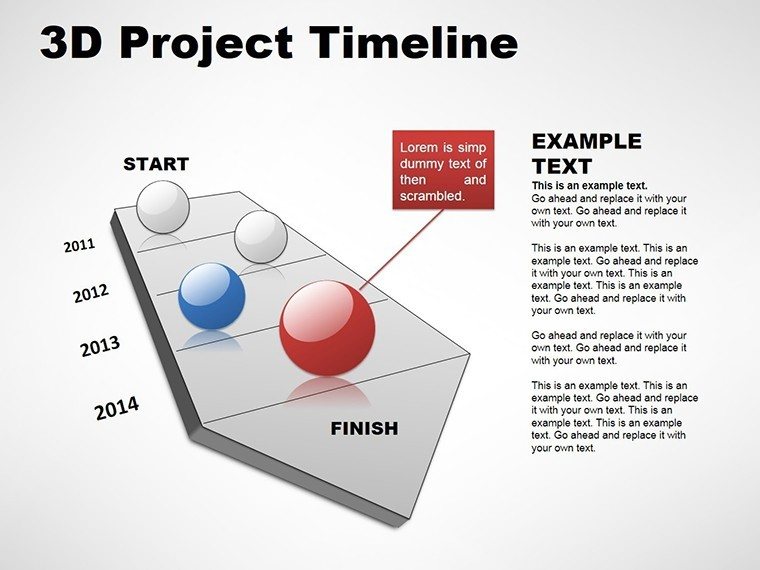
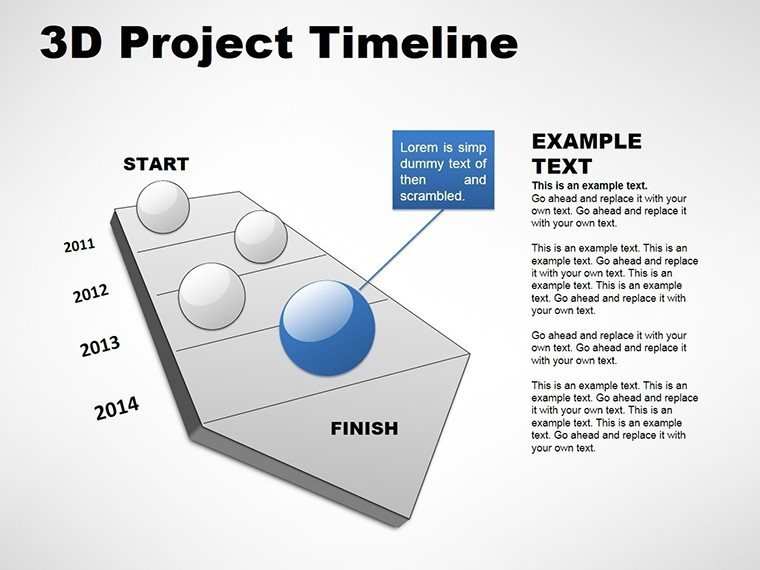
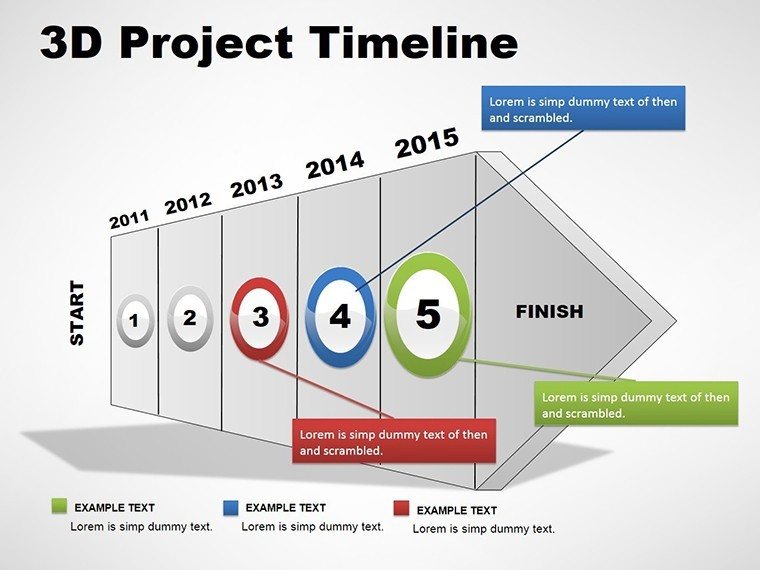
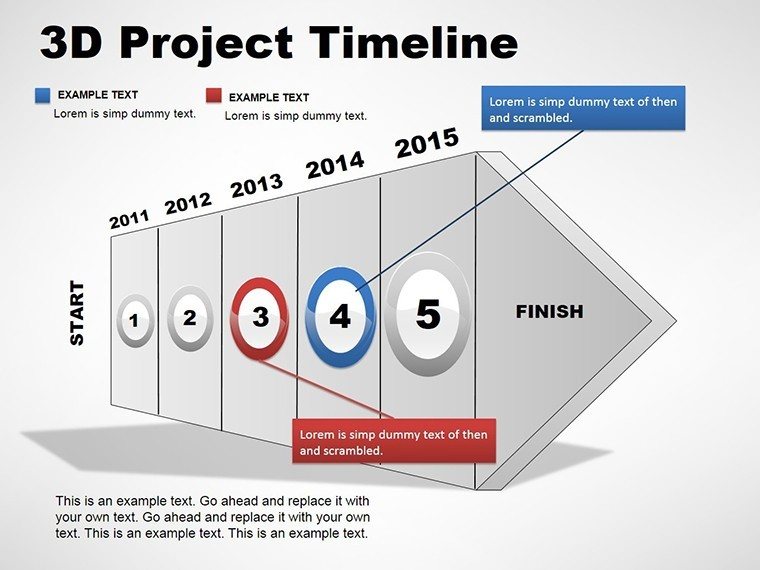
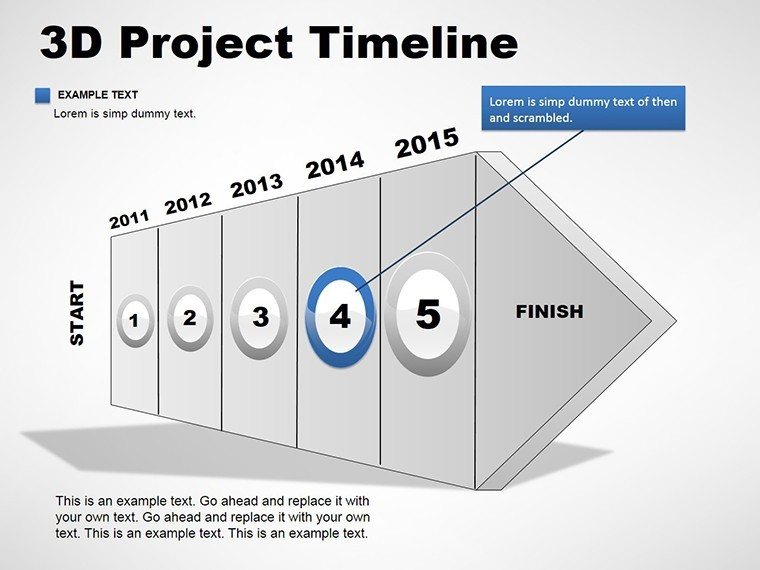
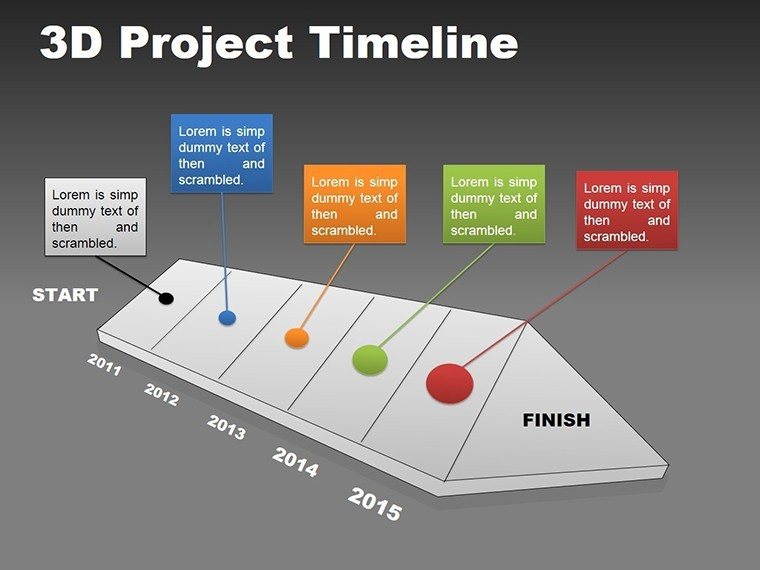
12 slides make up this download, each featuring 3D project timelines in .pot and .potx formats.These layouts connect phases through spatial depth, showing dependencies across multiple workstreams in a single view.Unlike flat sequence displays, the 3D elements highlight progression and overlaps without crowding the slide.
The timelines support project managers during status updates by organizing milestones into visual hierarchies.Each slide builds on the previous one, creating a coherent narrative for multi-phase initiatives.Spatial arrangement aids in spotting bottlenecks early in the presentation flow.
- Core timeline structures with adjustable depths
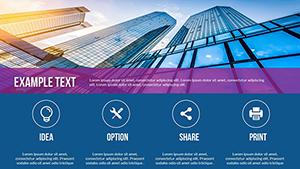
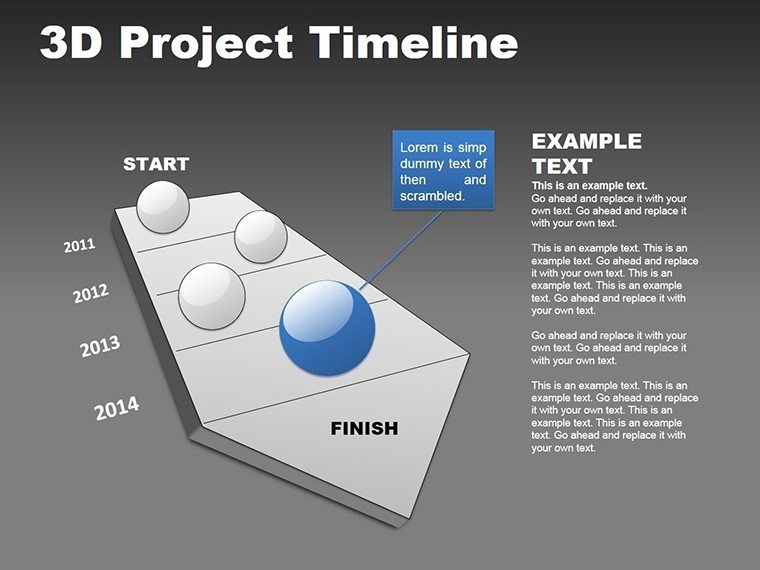
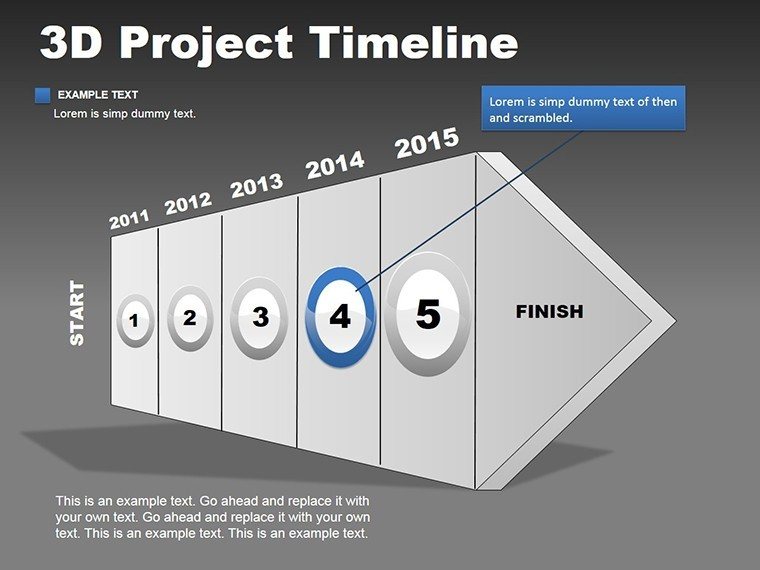
- Milestone markers in 3D perspective
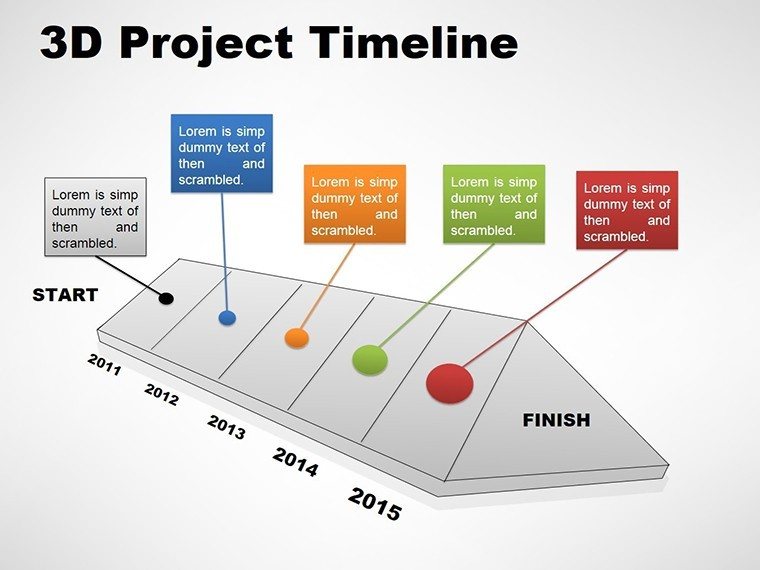
- Dependency connectors across phases
Users adapt these for specific industries by swapping text placeholders while keeping the 3D integrity intact. The package focuses on practical application in business presentations, ensuring every element serves the information spacing needs of strategy meetings.
Key Specifications
| Feature | Details |
|---|---|
| Slides included | 12 with 3D timeline variations for project tracking |
| Diagram categories | Multi-phase timelines, milestone charts, dependency maps |
| Editable elements | Shapes resize independently, text updates via placeholders, depths adjust without distortion |
| Aspect ratio | 16:9 widescreen for modern projectors |
| PowerPoint compatibility | Works in 2007, 2010, 2013, 2016, 2019, 365 versions |
| Color schemes | Single base scheme adjustable through slide master |
| File formats | .pot for templates, .potx for XML-based editing |
These specs ensure smooth integration into existing decks. Compatibility extends to both Windows and Mac environments.
Typical Use Cases by Role
Project managers in construction firms use these 3D timelines during client progress reports.
Construction Project Updates
They map site phases and vendor dependencies, cutting deck preparation from 3 hours to 45 minutes. The visual hierarchy clarifies delays for non-technical stakeholders. Teams reuse the file across projects by updating milestones.
- Phase segmentation with color contrast
- Dependency lines for vendor coordination
Financial analysts in banking adapt the layouts for loan portfolio reviews, enabling clear communication of repayment schedules in quarterly reviews.
Banking Portfolio Reviews
The 3D perspective suits tasks where hierarchy perception matters over linear lists. Analysts adjust depths to emphasize risk phases, supporting investor decks without redesign.
Download this set to handle your next timeline presentation.
Customization in 5 Steps
Beginner to moderate editing difficulty applies here.
- Open the .potx file in PowerPoint (1 minute).
- Apply the template to your existing deck via the Design tab (2 minutes).
- Replace placeholder text with project details (3 minutes).
- Adjust 3D depths and colors using the slide master (4 minutes).
- Export as .pptx for sharing or PDF for distribution (1 minute).
This workflow helps professionals during board briefings. It enables quick changes to diagram connectors and icon layers.
Building From Scratch vs. Starting Here
Creating equivalent 3D timelines manually requires 4-6 hours per slide for an advanced designer familiar with PowerPoint's shape tools.Without this template, users often misalignment dependencies, leading to confusing flow directions in sales presentations.Starting here reduces that to under 10 minutes per adaptation, with intermediate skills sufficient for editable shapes and text placeholders.
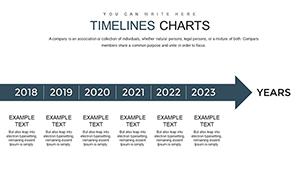
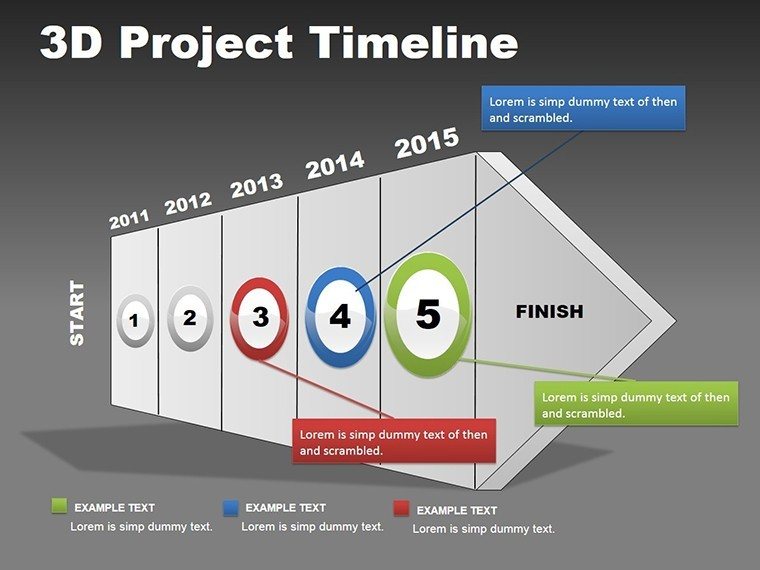
Many timelines embed labels inside shapes, which reduces readability on large screens.This design places labels outside connected by thin lines, preserving clarity in consulting decks.Project managers often pair these with basic timeline maker layouts for hybrid approaches.
The category offers more options in timelines PowerPoint charts.For complementary visuals, consider dynamic sequence charts.
Get the full editable set today.
Which PowerPoint versions open this template?
The .pot and .potx files work in PowerPoint 2007 through 365 on Windows and Mac. Older versions like 2003 may lose 3D effects during import. Test compatibility by opening the file directly in your installed software. If issues arise, update to a newer version for full editable features.
How do I change the color scheme?
Access the slide master under View > Slide Master. Select the color theme and apply your brand palette to all slides at once. Individual shapes adjust via the Format pane for fine-tuning. This process maintains the 3D depth while updating contrasts.
What does the license allow?
Use in internal business presentations and paid client work is permitted. Resale or sublicensing of the files is not allowed. Edit freely for multiple projects within your organization. Distribution as part of a larger deck to clients is fine if not sold separately.
Are there differences between free and paid versions?
No free version exists for this product. The paid version includes all 12 slides with full 3D timelines and editable elements. Buyers get the complete set without restrictions on diagram types. This ensures access to every layout variation from purchase.
Does this support animations?
Basic animations like fade-ins for milestones are included. Apply or remove them via the Animations tab without affecting the 3D structure. Complex custom animations may require manual addition. Test in presentation mode to ensure smooth playback on your system.