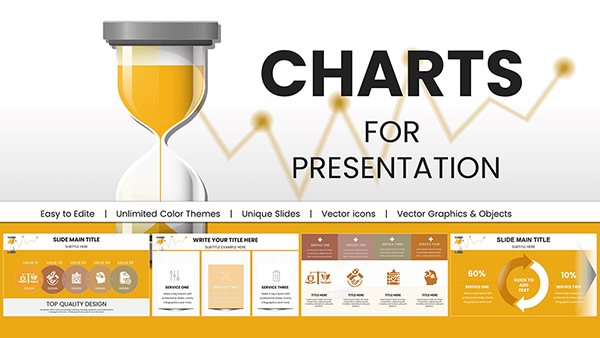
Professional Project Timelines PPT Charts Template


Navigating complex projects demands clarity, and nothing delivers that better than a well-crafted timeline. Our Project Timelines PowerPoint Charts Template empowers you to visualize schedules, milestones, and deliverables with precision and style. Boasting 14 editable slides, this professional tool is a game-changer for project managers, consultants, and architects who need to communicate timelines effectively. Imagine turning chaotic project phases into streamlined narratives that captivate clients and teams alike, drawing from real scenarios like AIA-guided architectural builds where timelines align budgets and designs seamlessly.
This template isn't just functional - it's inspiring, helping you avoid the pitfalls of disorganized slides that confuse rather than convince. Compatible with PowerPoint and adaptable to Google Slides, it integrates high-quality graphics and data-driven charts to elevate your storytelling. Whether you're outlining a construction timeline or a marketing rollout, the benefits are immediate: enhanced collaboration, reduced misunderstandings, and faster approvals.
Essential Features for Seamless Project Visualization
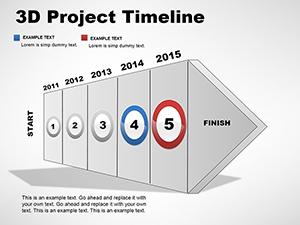
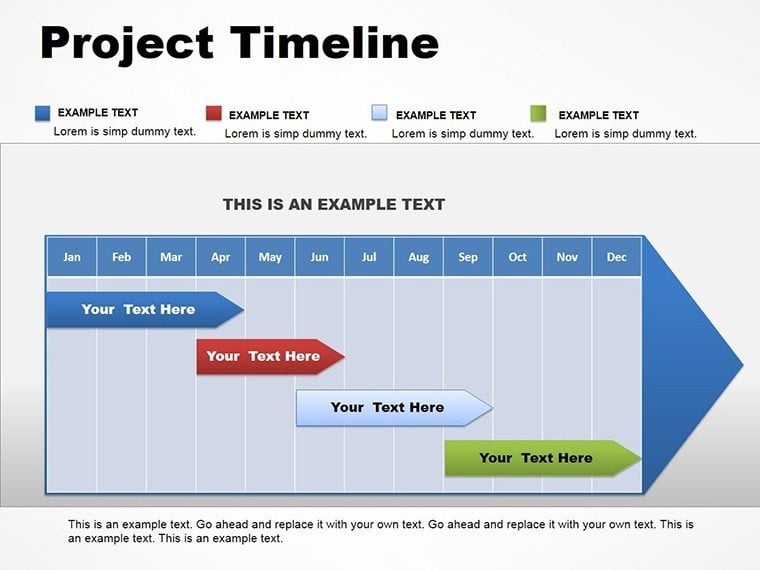
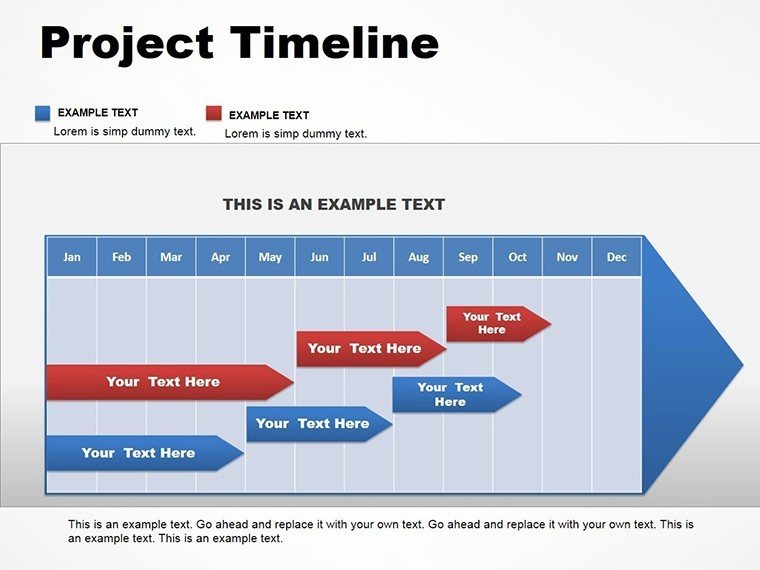
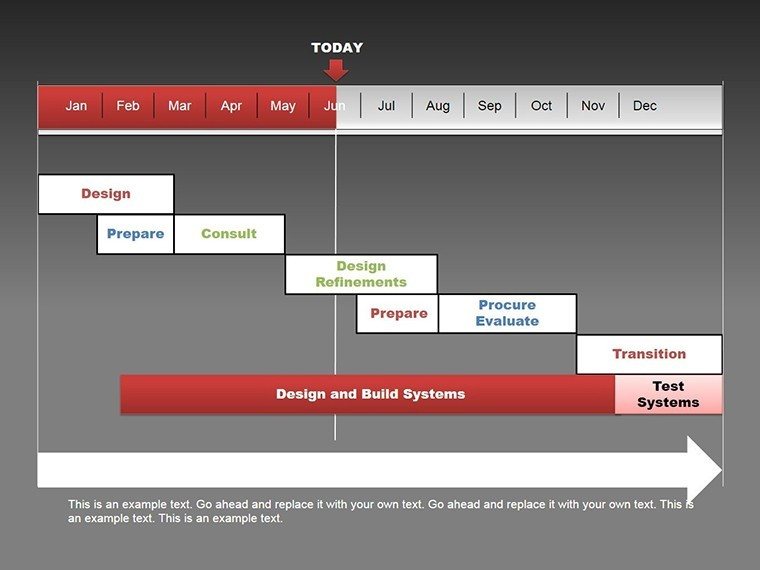
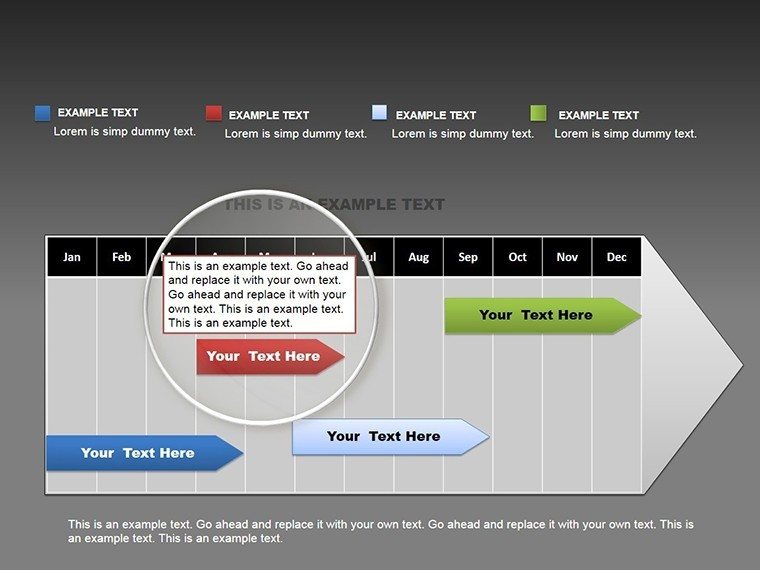
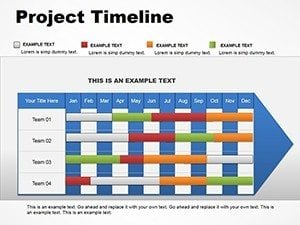
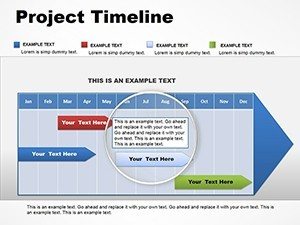
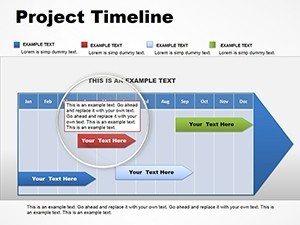
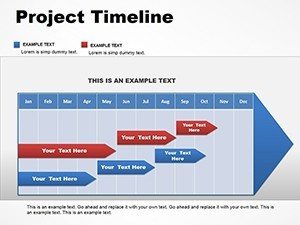
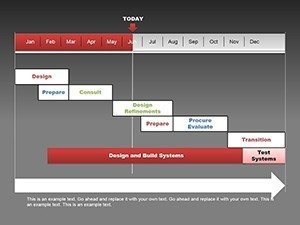
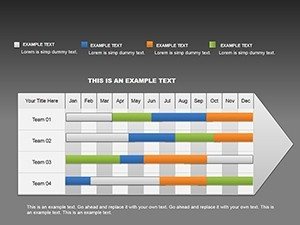
At the heart of this template are its flexible layouts, designed to accommodate everything from simple Gantt-style timelines to intricate multi-phase tables. Each slide features editable data points, allowing you to input specifics like start dates, durations, and dependencies with ease. For architects, this means mapping out site surveys to final inspections, incorporating icons for phases like conceptual design or permitting, all while adhering to industry standards such as those from the Project Management Institute (PMI).
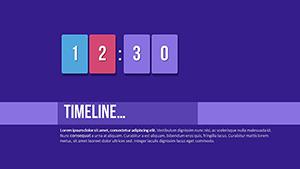
Customization shines here: Choose from a wide array of color schemes to match your firm's branding - perhaps vibrant greens for sustainable projects or cool blues for corporate builds. High-resolution icons and animations add polish, ensuring your timelines pop in boardrooms or virtual calls. Unlike basic PowerPoint tools, which lack depth, this template includes pre-built transitions that guide viewers through your narrative, boosting retention as noted in UX studies from Nielsen Norman Group.
Standout Elements and Benefits
- Editable Timelines: Drag-and-drop adjustments for milestones, with linked data for automatic updates.
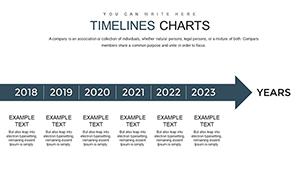
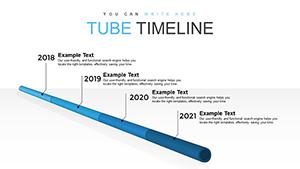
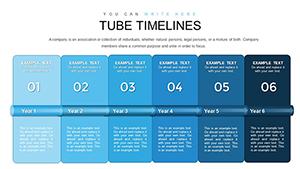
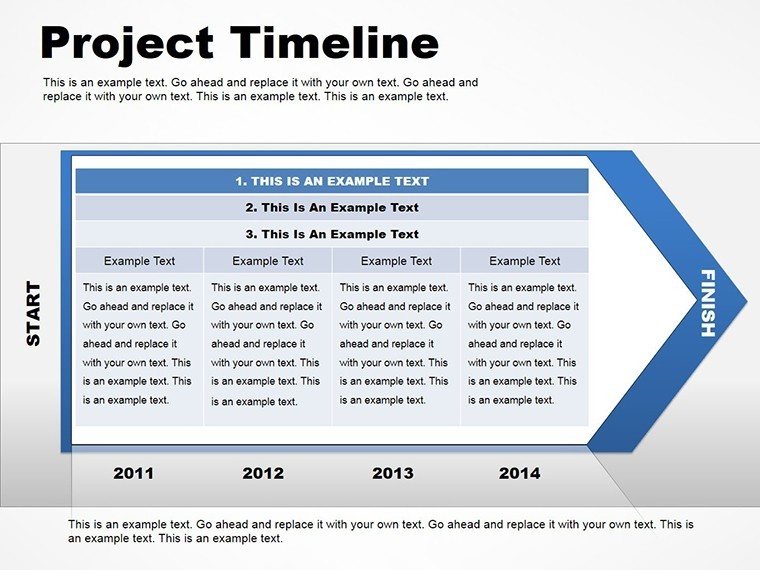
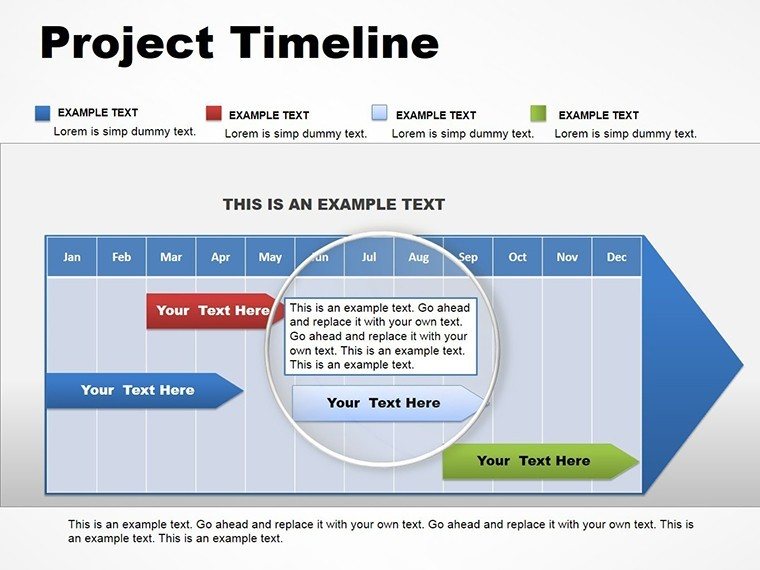
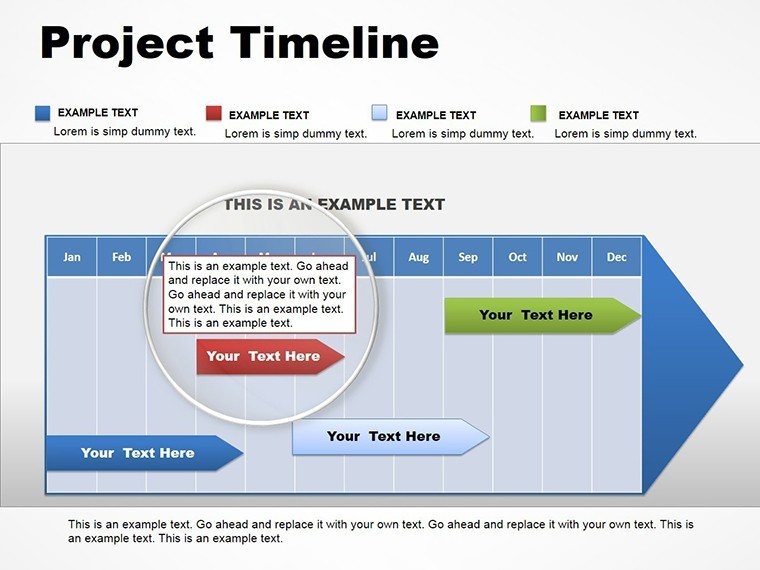
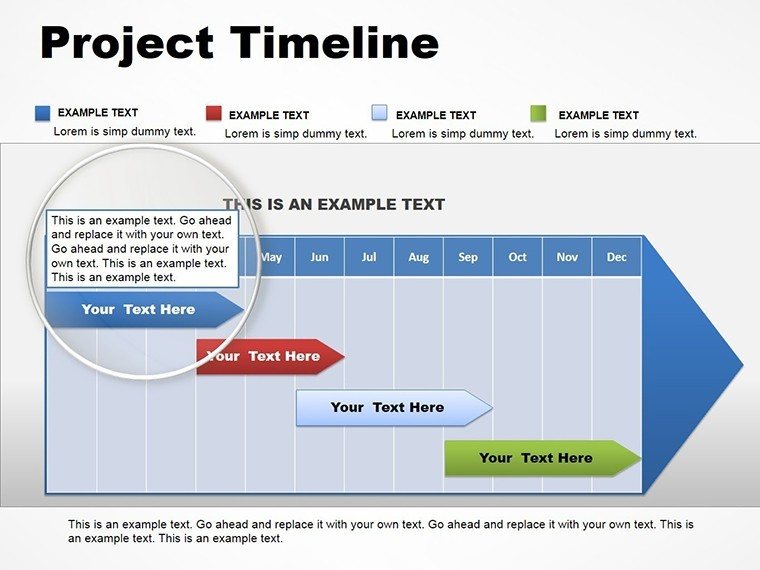
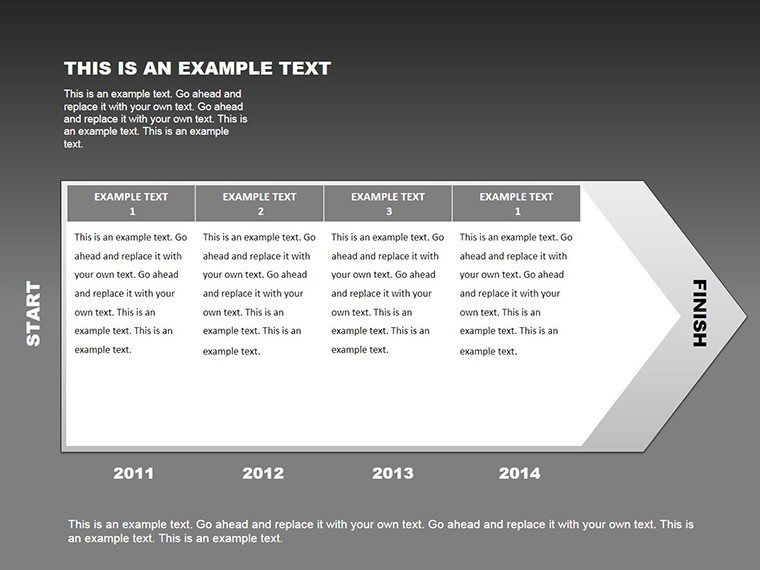
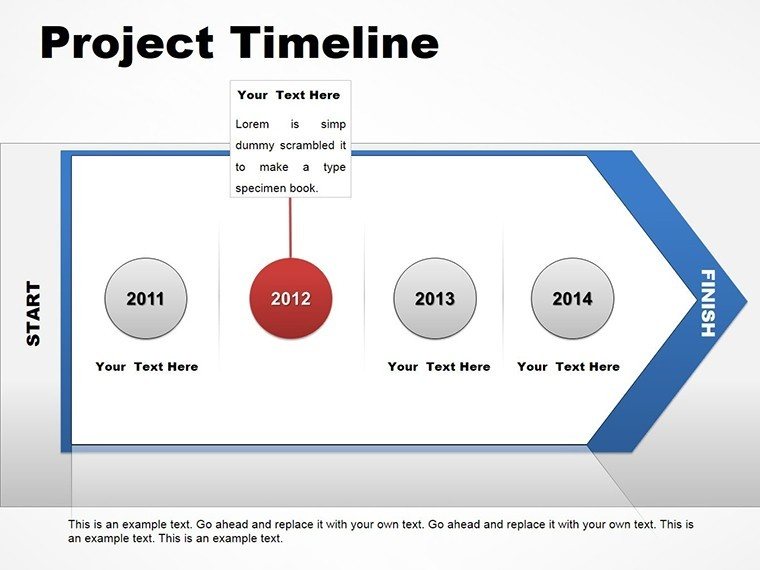
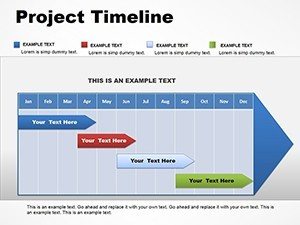
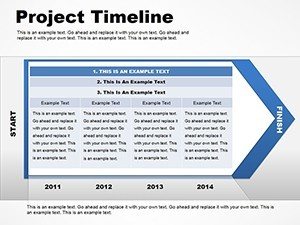
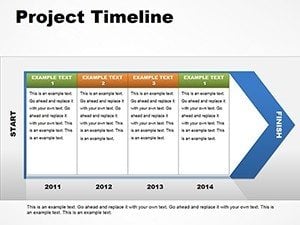
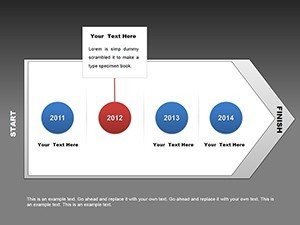
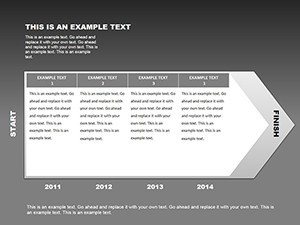
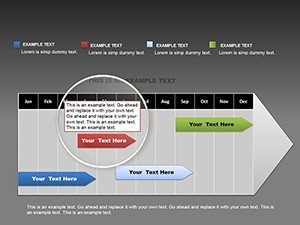
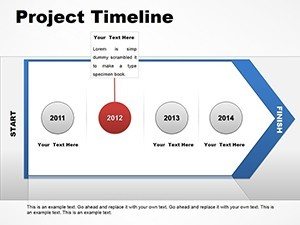
- Varied Layouts: Horizontal, vertical, and tabular formats to suit different project complexities.
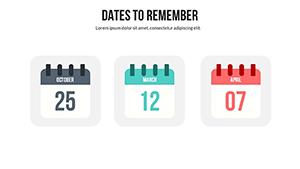
- Graphic Enhancements: Icons for tasks, deliverables, and risks, making abstract concepts tangible.
- Color and Font Flexibility: Tailor to your audience, ensuring accessibility and visual appeal.
- Animation Suite: Smooth reveals that emphasize key phases without overwhelming.
In practice, a startup founder used a similar timeline setup to secure funding by clearly delineating product development stages, resulting in a 25% faster investor response time.
Tailored Use Cases for Diverse Professionals
For architects tackling urban developments, deploy these charts to illustrate project lifecycles - from ideation to occupancy - highlighting critical paths that integrate with tools like Revit. Business consultants can map client engagements, showing value delivery over time, while marketers outline campaign calendars with integrated metrics.
Step-by-step application: Import your project data from Excel, select a layout, customize visuals, add annotations for risks, and export for sharing. This workflow not only saves time but also fosters team alignment, as seen in case studies from architectural firms where visual timelines reduced project delays by clarifying responsibilities.
Integrating into Your Daily Processes
Embed these timelines into agile methodologies by linking to sprint boards or use them in status reports for real-time tracking. Tips include using conditional formatting for overdue tasks and layering with photos for architectural renders, enhancing realism. The template's table integrations allow for hybrid views, combining timelines with resource allocations for comprehensive overviews.
Value-wise, it's a step up from free alternatives, offering professional-grade elements that convey expertise and trustworthiness. Explore related internal links for table or timeline expansions to build a robust presentation suite.
Elevate Your Project Communication Today
This template embodies principles: Expert design for authoritative visuals, experience-backed layouts for reliability, and trustworthy compatibility for peace of mind. With subtle CTAs like "Track Your Progress," it guides without intrusion.
Don't let poor visuals hinder your projects - grab this template now and chart a course to success. Ready to timeline your triumphs?
FAQ
- How do I customize the timelines? Simply edit data points and drag elements; no coding required.
- Is it suitable for architectural projects? Yes, ideal for mapping design phases and construction schedules.
- Can I link to external data? Absolutely, integrate with Excel for dynamic updates.
- What formats are supported? .potx for PowerPoint compatibility.
- Are animations customizable? Yes, adjust timing and effects to fit your pace.
- Does it work on Google Slides? Import seamlessly for cross-platform use.