Fully Editable Gauge Dashboard PowerPoint Template - 16 Slides Instant Download


Type: PowerPoint Charts template
Category: Pie, Illustrations
Sources Available: .pptx
Product ID: PC00035
Template incl.: 16 editable slides
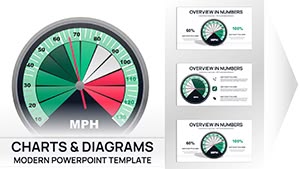
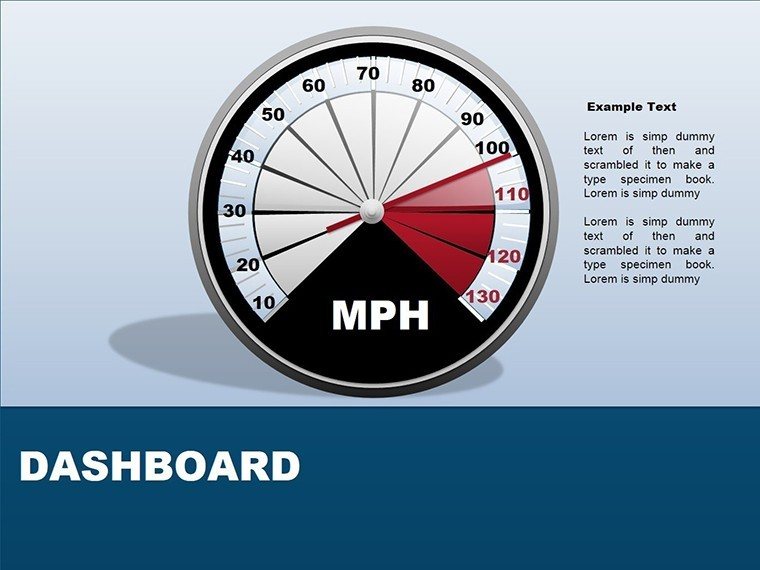
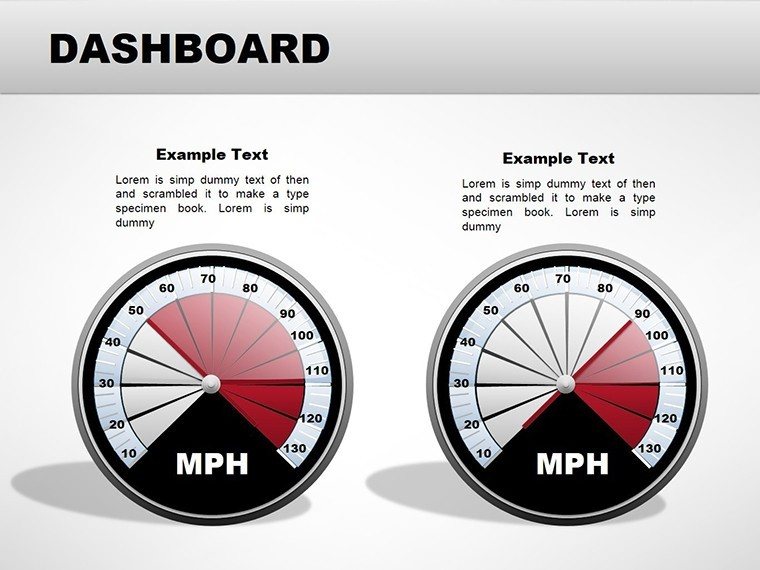
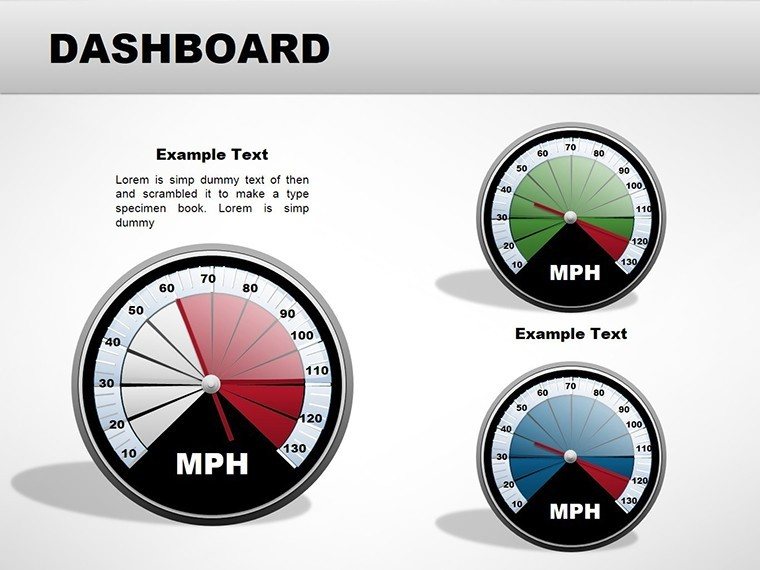
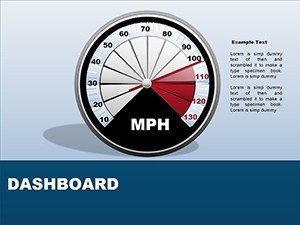
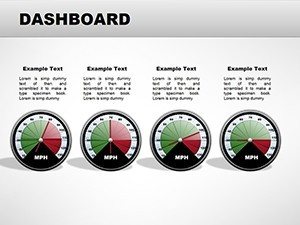
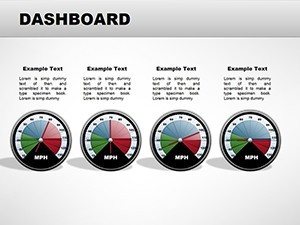
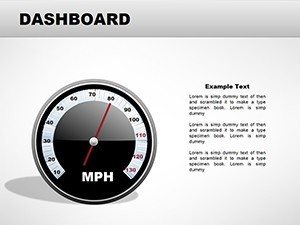
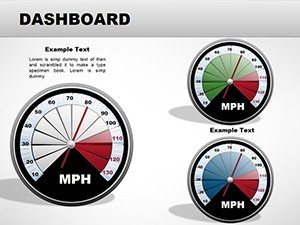
Executive decision-making relies on clear, consolidated views of performance indicators that combine multiple data types into one coherent story. This professional gauge dashboard PowerPoint template with 16 slides merges gauge charts, bar graphs, pie segments, and trend lines into comprehensive overviews suitable for regional performance, revenue analysis, and growth tracking. Designed for leaders who need instant insights, it turns complex data into actionable executive summaries.
Key Features
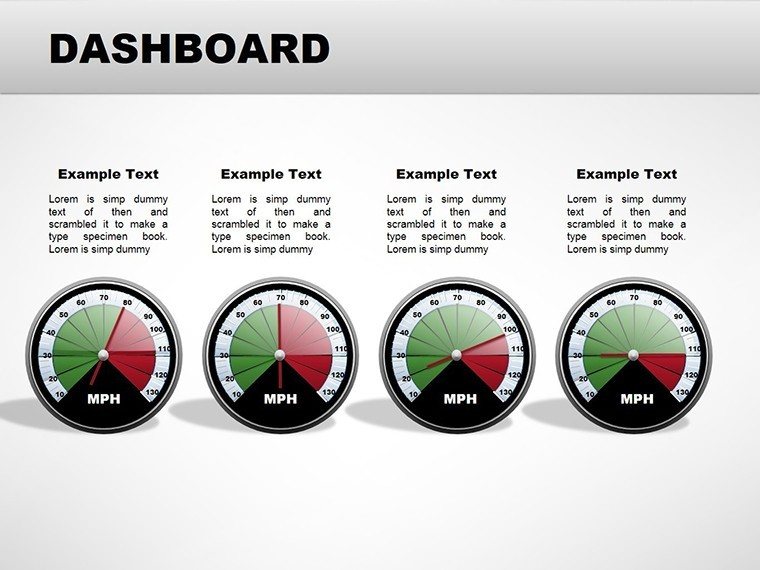
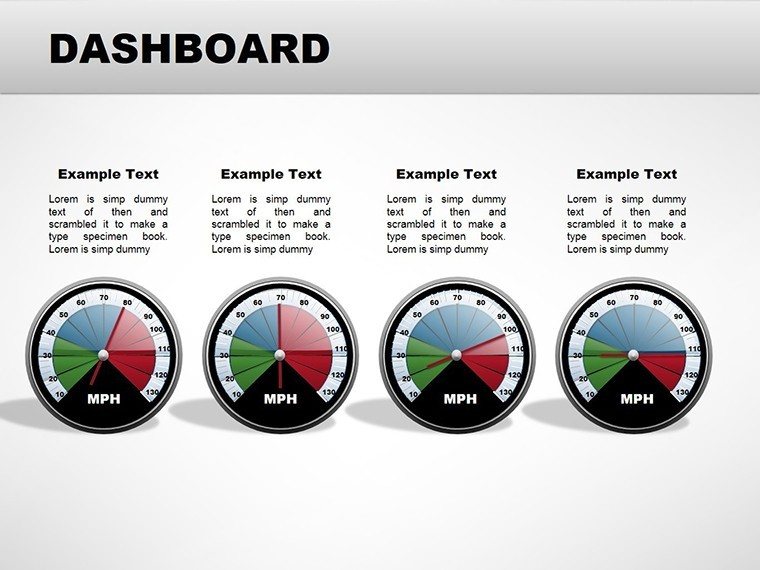
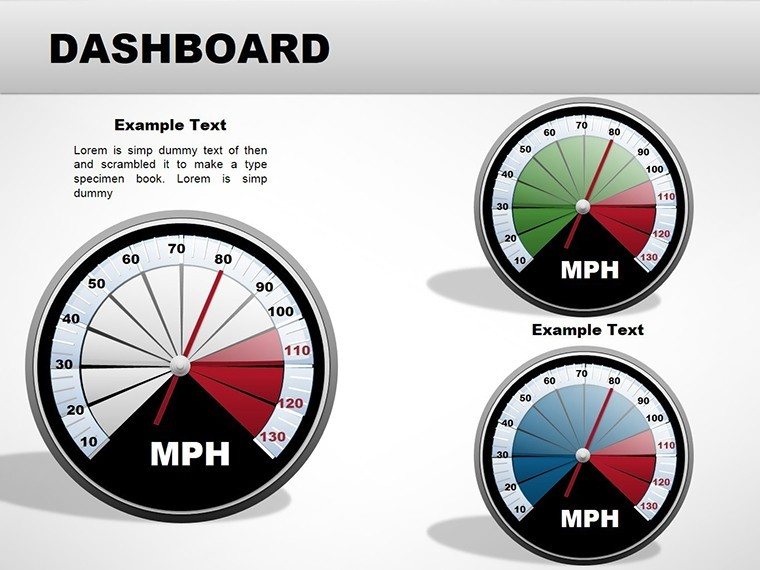
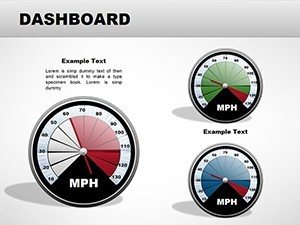
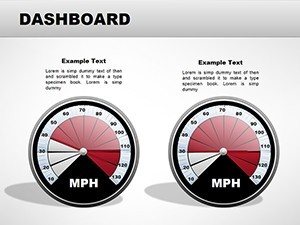
- 16 ready-to-use slides with varied dashboard layouts
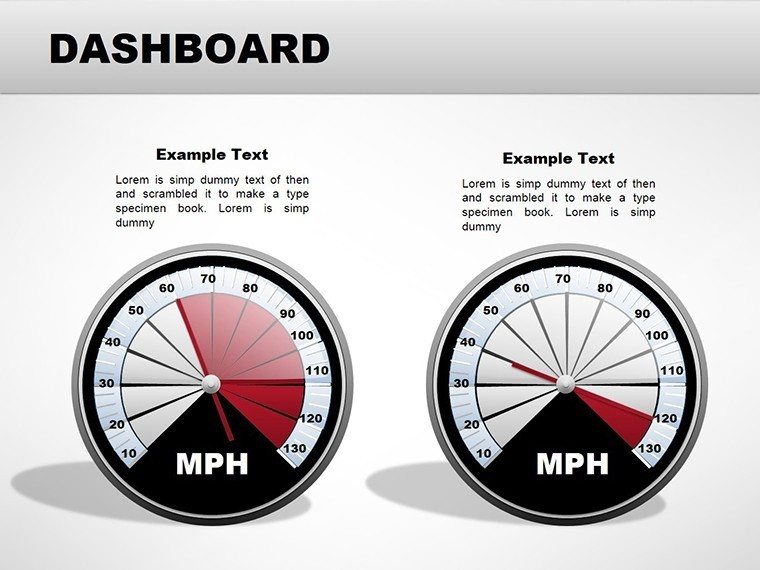
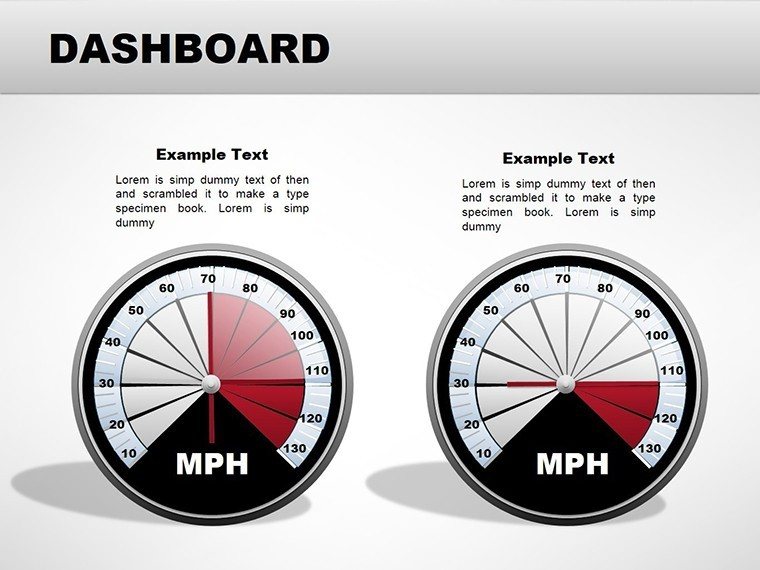
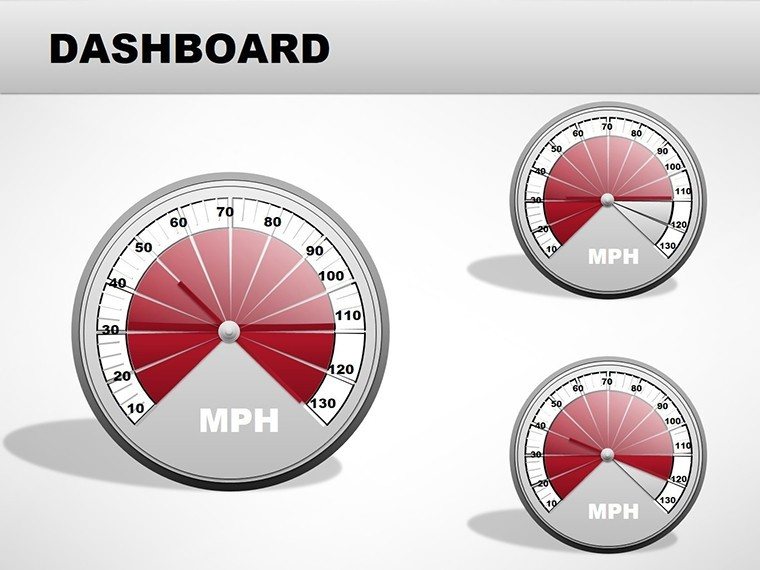
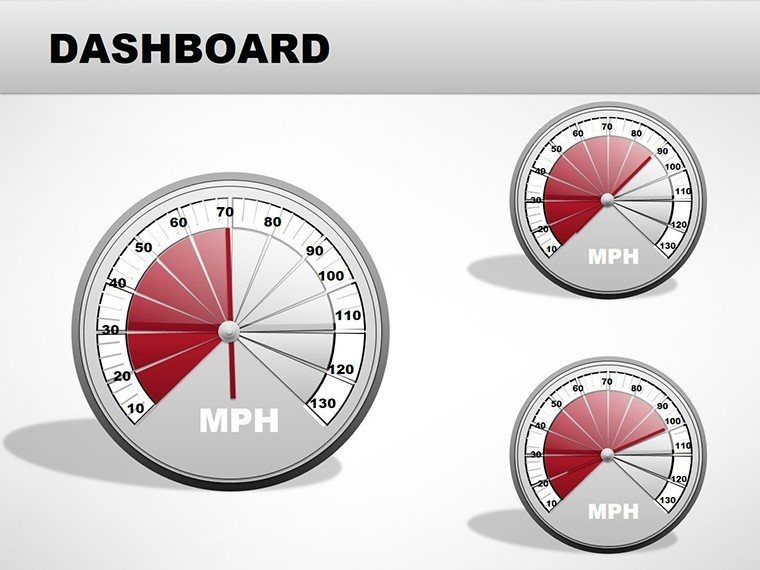
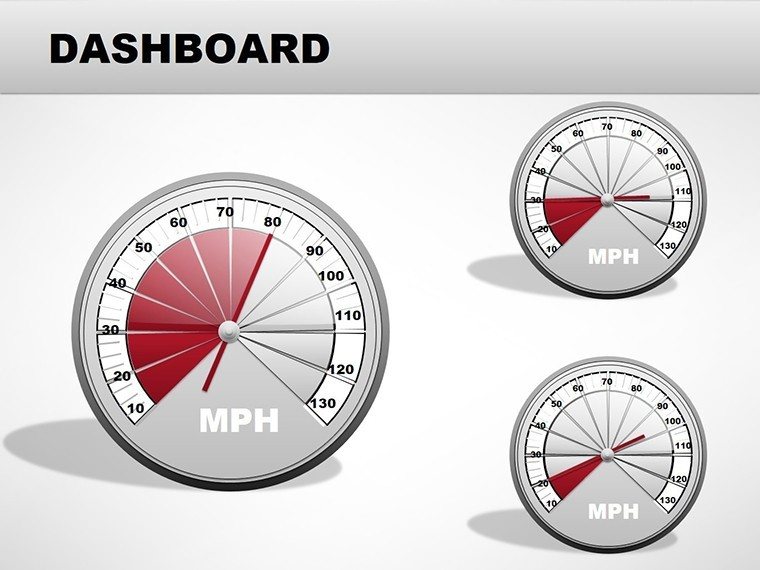
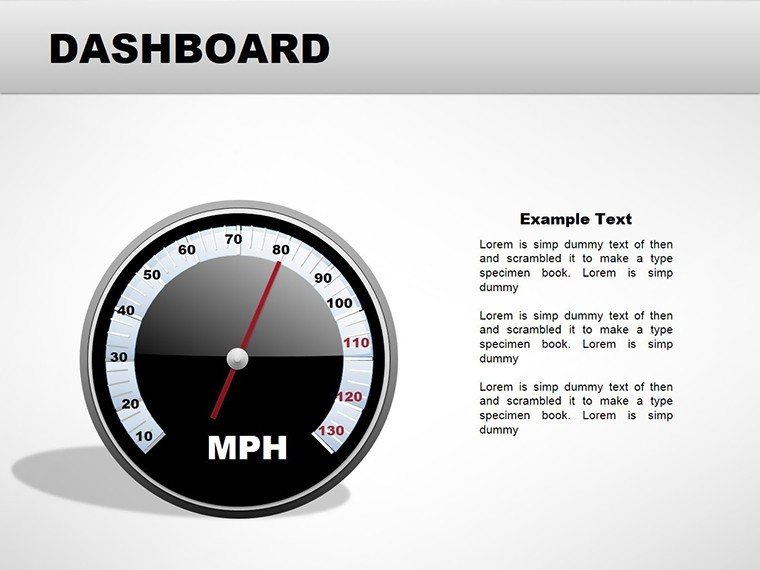
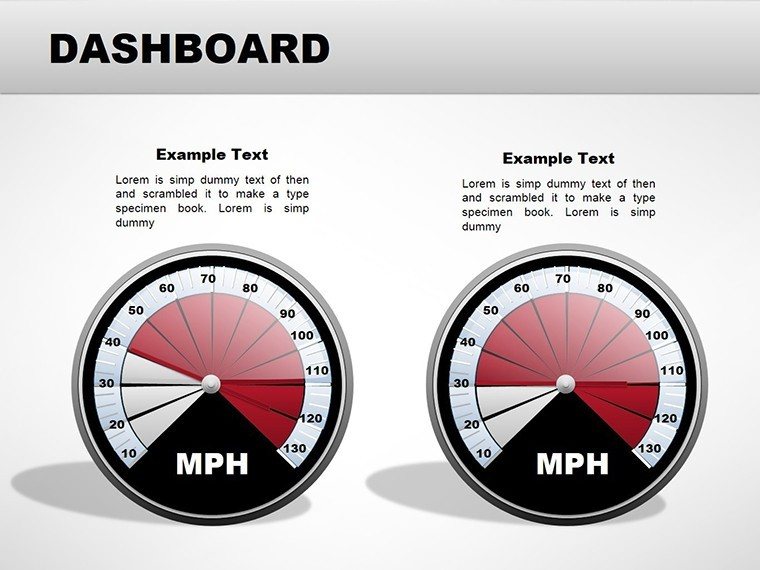
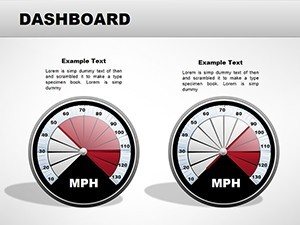
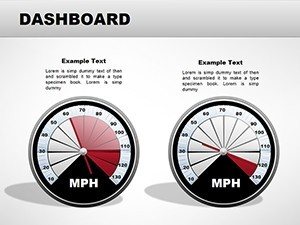
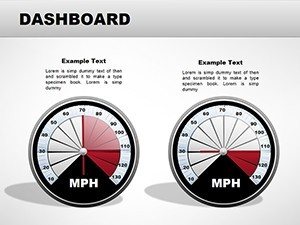
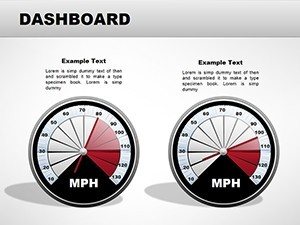
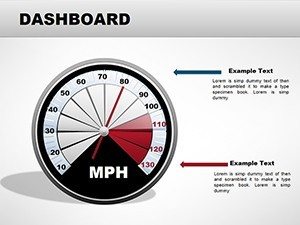
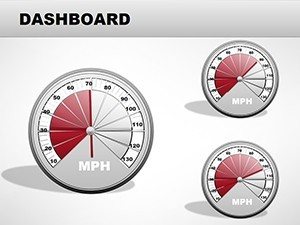
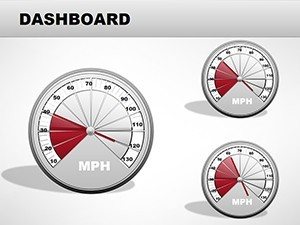
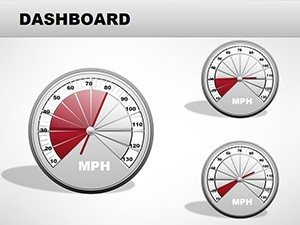
- Gauge (speedometer) charts for KPI tracking
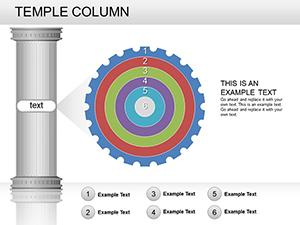
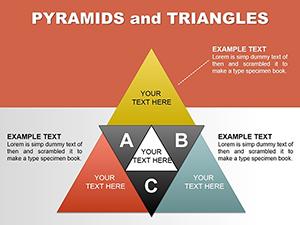
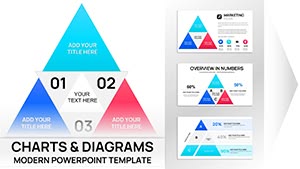
- Combination of bar, pie, and line charts
- Fully editable elements with professional design
- Aligned layouts for maximum visual clarity
How to Customize This Template
Open any of the 16 slides in PowerPoint and update gauge levels, bar values, and pie segments with your data. Change colors, labels, and thresholds to reflect your specific targets and branding. The multi-slide structure allows you to select the best layout for each reporting need while maintaining consistency.
Compatible with PowerPoint 2010 and newer, including Microsoft 365 on Windows and Mac.
Professional Use Cases
Executive teams monitor overall company performance in board presentations.
Regional managers track sales and growth metrics across territories.
Finance departments present revenue sources and profitability trends.
Consultants deliver comprehensive client health dashboards.
Download this 16-slide template now to create impactful executive dashboards.
Frequently Asked Questions
How many slides are included?
The template contains 16 professionally designed slides with different gauge dashboard variations for flexible use.
Are the gauge charts editable?
Yes, all gauge levels, colors, and thresholds are fully editable using standard PowerPoint tools.
What PowerPoint versions are supported?
The template works with Microsoft PowerPoint 2010 and later, including Microsoft 365, on Windows and Mac.
Is instant download provided?
Yes, the PPTX file is available for immediate download after purchase.
Can I use these slides commercially?
Yes, full commercial and client-facing use is allowed under the license.