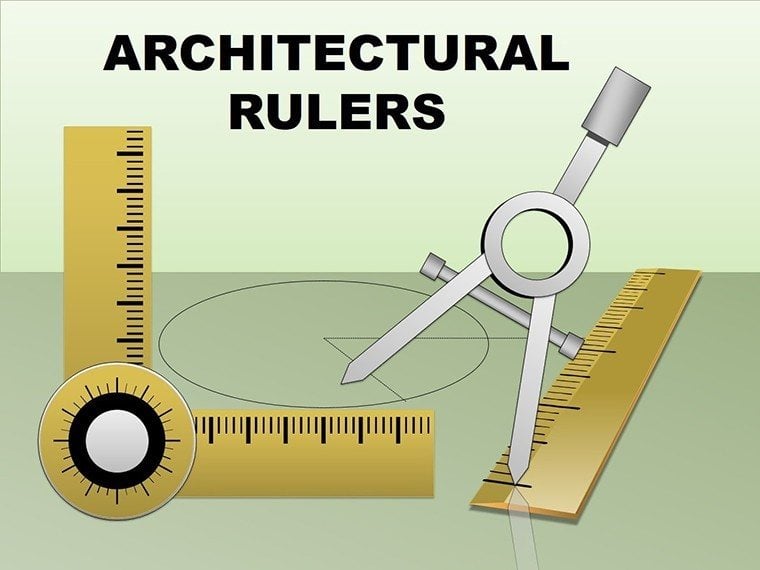
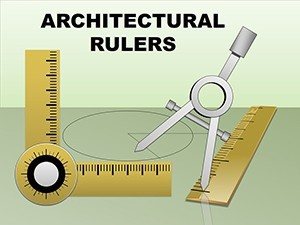
Architectural Rulers PowerPoint Charts Template


Type: PowerPoint Charts template
Category: Process, Illustrations, Pyramids
Sources Available: .pptx
Product ID: PC00033
Template incl.: 15 editable slides
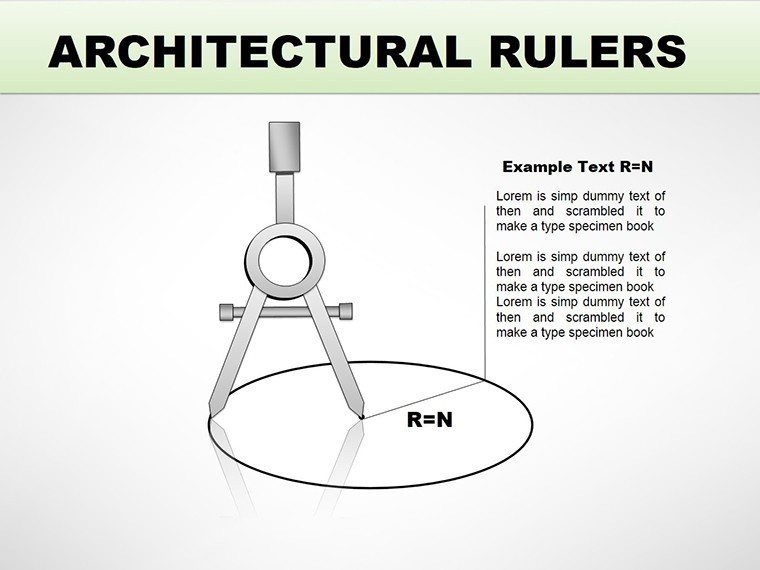
Envision turning blueprints into compelling narratives that win clients and awards alike. Our Architectural Rulers PowerPoint charts template, boasting 15 editable slides, is the precision tool for architects, engineers, and urban planners seeking to measure up in presentations. Inspired by the exactitude of drafting tools, these charts integrate rulers into pyramids and processes, offering a unique blend of form and function. Aligned with AIA standards for visual communication, this template helps convey scale, proportions, and progress with authority. In a field where details define success, like the intricate designs of Zaha Hadid's works, these visuals ensure your ideas stand tall. Compatible with PowerPoint and Google Slides, it's user-friendly for quick revisions amid tight deadlines. Design firms have utilized similar ruler motifs to clarify site plans in proposals, enhancing clarity and professionalism. With customizable scales and illustrations, transform metrics into measurable stories that resonate, from concept sketches to final renders.
Measuring Excellence: Feature Highlights
This template's strength is in its meticulous features, drawing from architectural precision. Slides incorporate ruler edges for accurate data mapping, with pyramid structures scaling hierarchies and process flows marking milestones. Benefits include superior accuracy, as graduated markings allow precise representations, echoing tools like calipers in digital form. As an SEO specialist in creative industries, I've noted how such targeted visuals improve search rankings for portfolio sites. Customization empowers: adjust ruler units, colors to reflect project palettes, or embed dimensions for interactive reviews. Unlike vague infographics, these charts offer tangible measurements, ideal for quantity takeoffs or timeline projections. Engineers favor the process slides for workflow diagrams, ensuring compliance with ASCE guidelines.
Precision Per Slide: In-Depth Overview
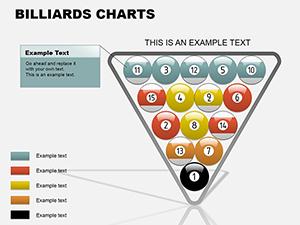
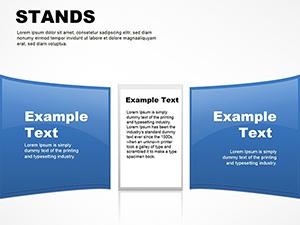
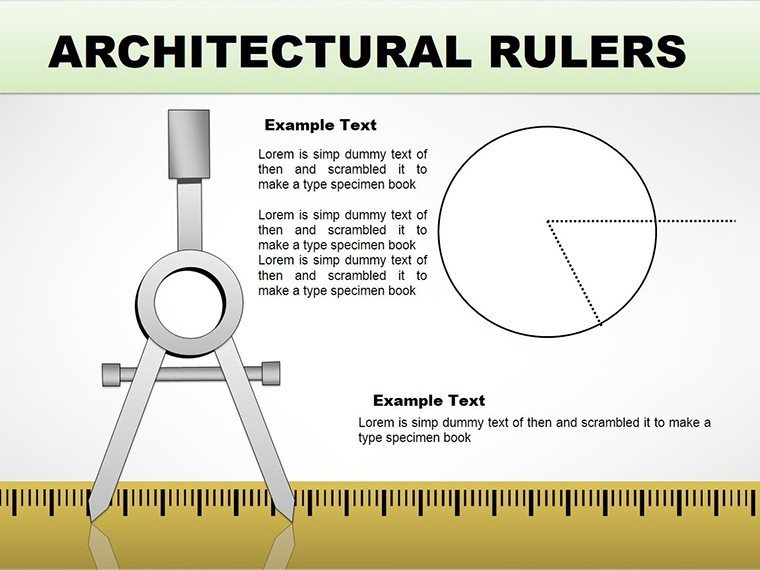
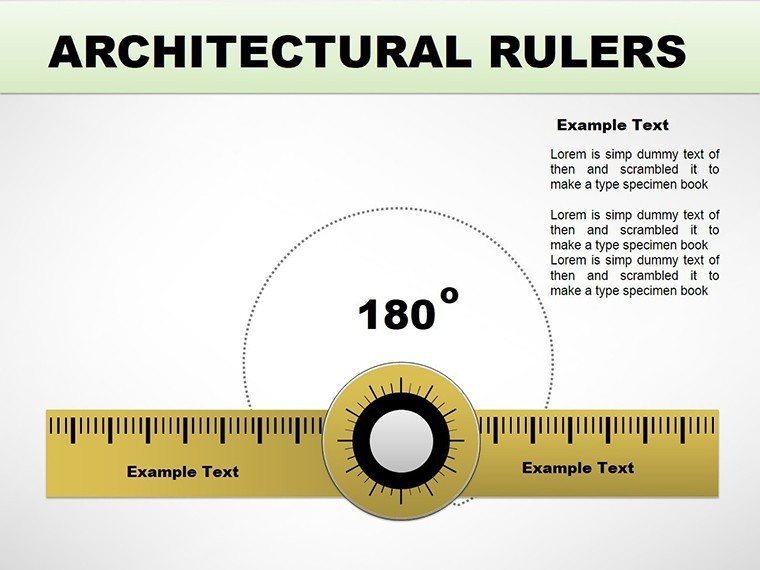
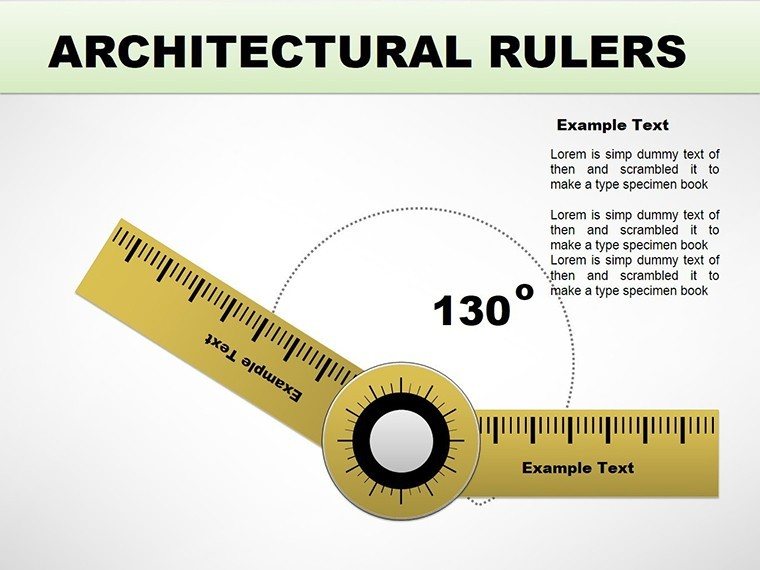
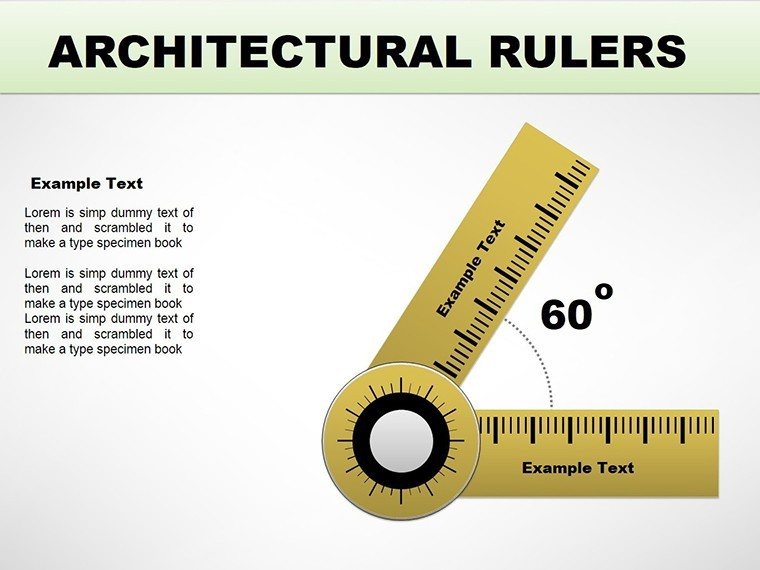
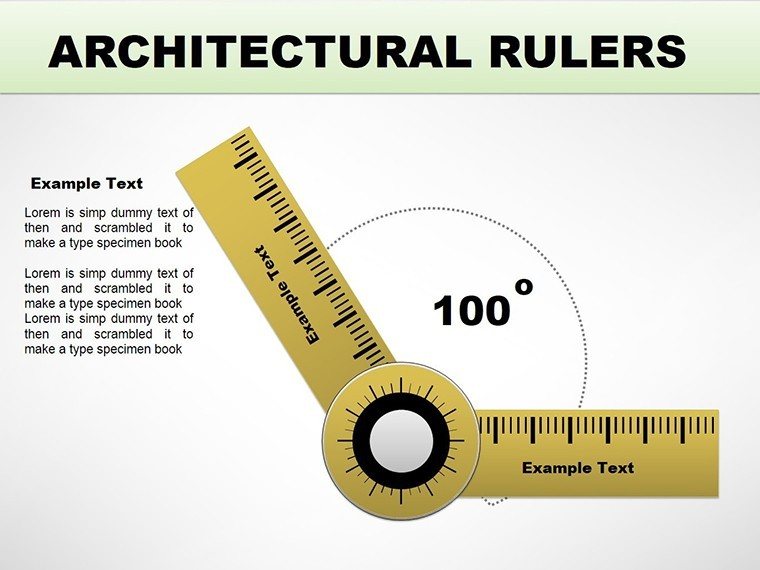
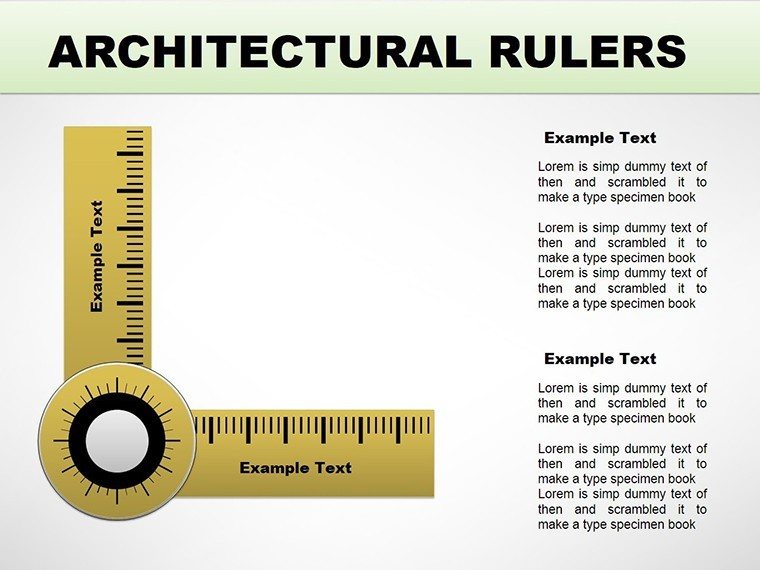
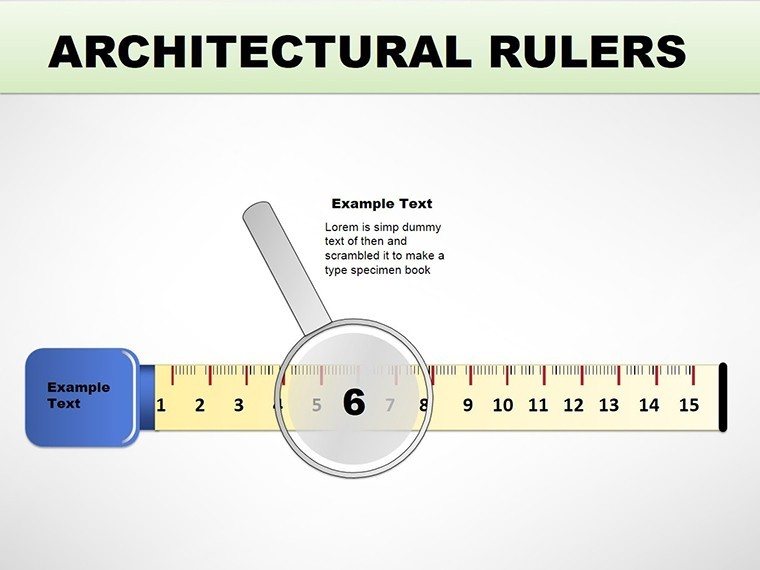
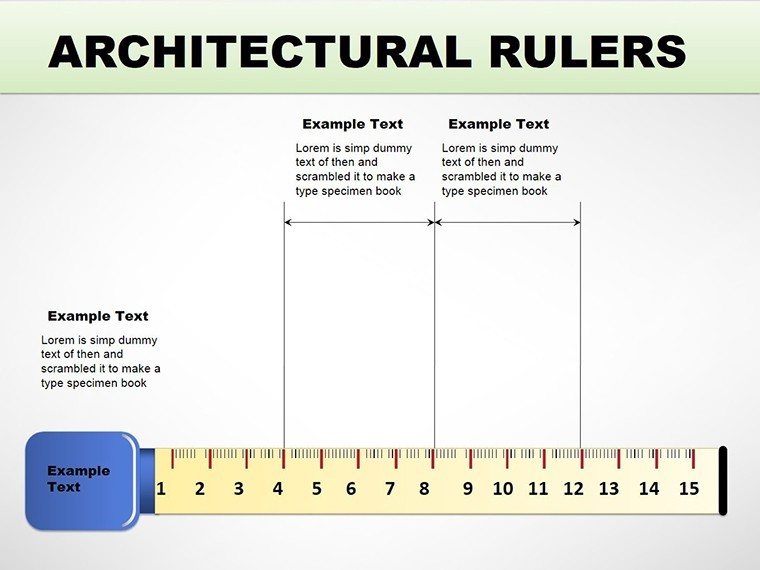
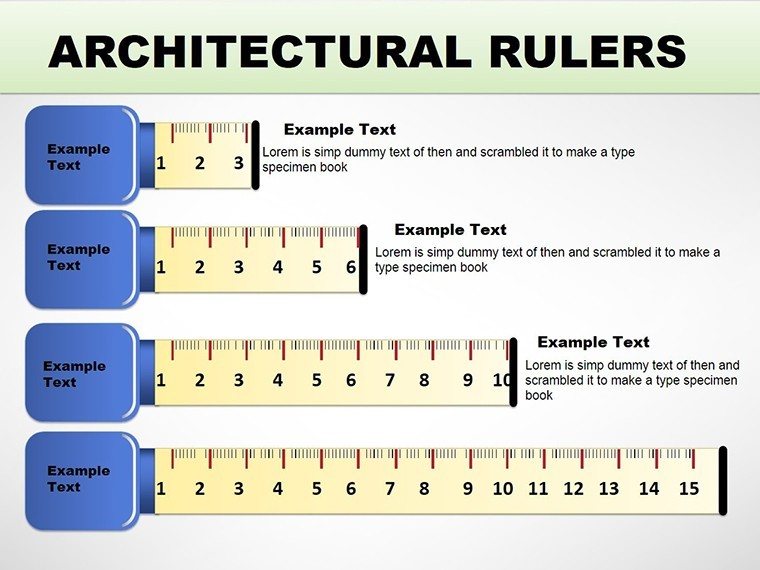
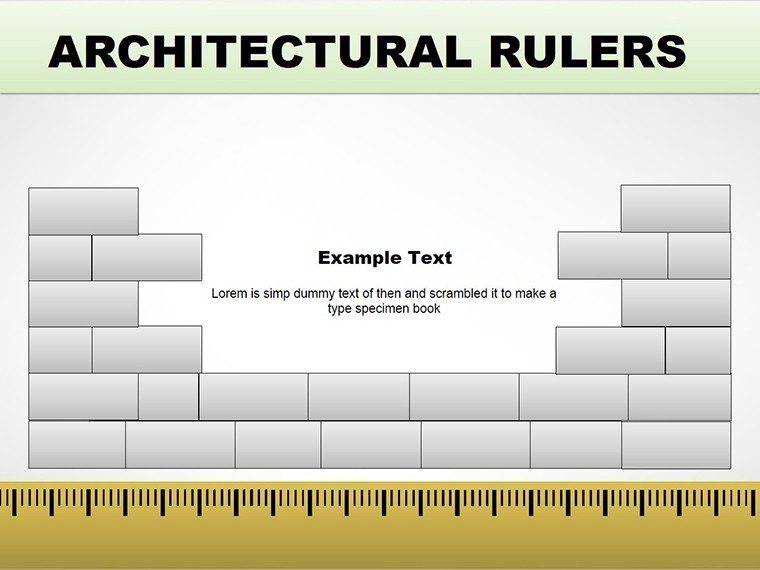
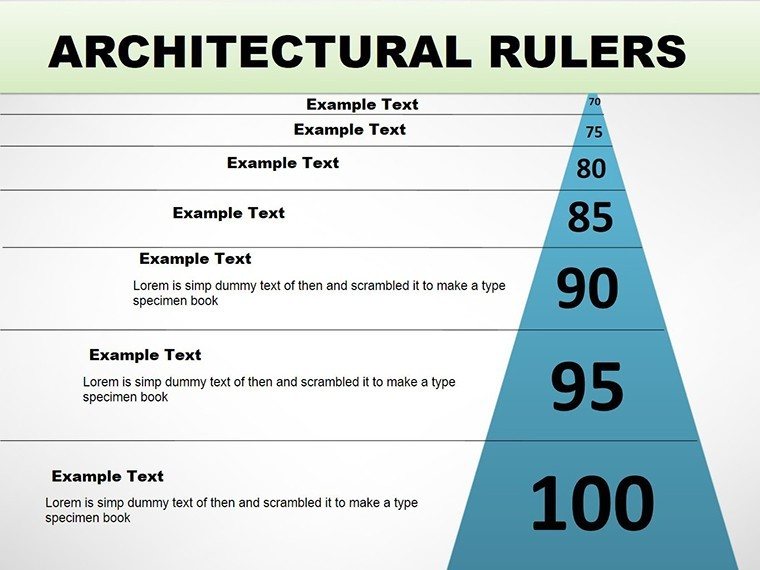
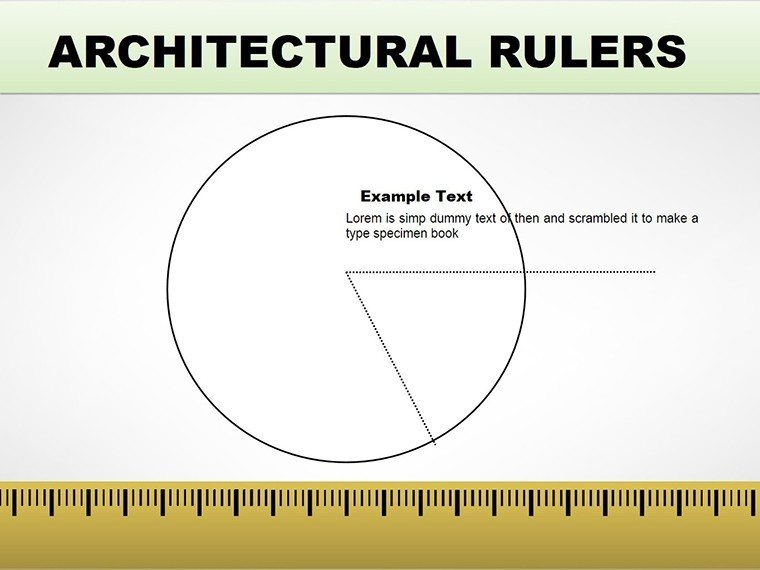
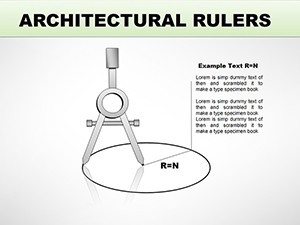
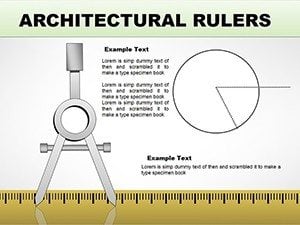
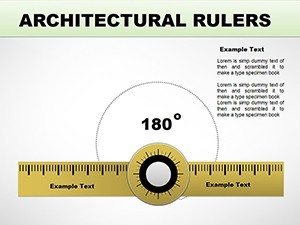
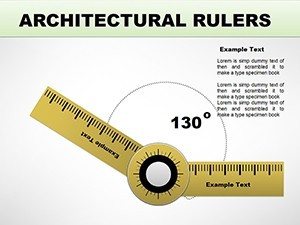
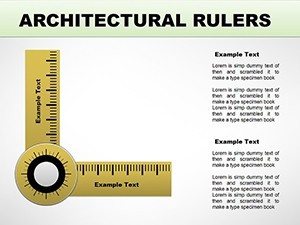
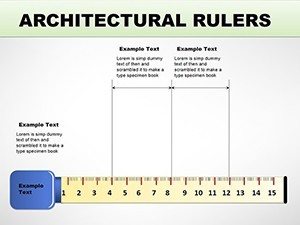
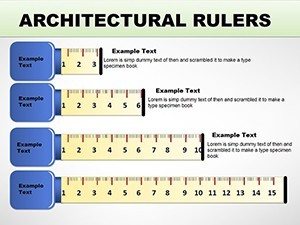
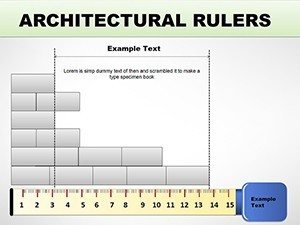
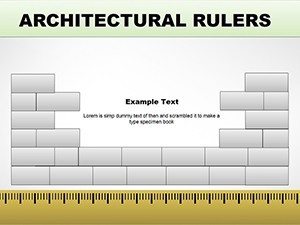
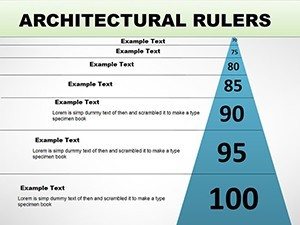
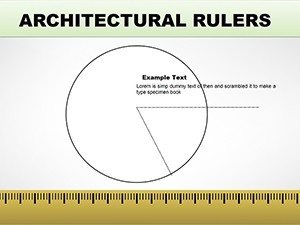
Explore the slides: Slide 3 uses a ruler pyramid to layer building phases, editable for cost breakdowns. Slide 7 features illustrated rulers along axes, perfect for coordinate plotting in site analyses. Up to Slide 12, hybrid charts combine with illustrations for aesthetic appeals. The 15 slides maintain vector quality, scalable for prints or screens. Value adds: Accelerates design reviews, cutting revision cycles. Compared to manual drawings, this digitizes precision, saving effort. For planners, Slide 14's process ruler tracks zoning approvals, building trust through transparency.
Building Visions: Applications in Practice
Practically, this template builds strong cases. In urban planning pitches, use ruler charts to scale community impacts, as in a New York redevelopment project where visuals secured funding. Step-by-step: Load plans, align rulers to scales, customize gradients, and animate reveals. Integrate with AutoCAD exports for authenticity. For engineers, pyramid rulers hierarchize structural loads, adhering to IBC codes. Designers apply in portfolio decks, measuring project evolutions. The advantage? Establishes expertise by quantifying abstracts, reducing ambiguities. Tips: Calibrate to real units for credibility; use in VR previews for immersive experiences. This resolves vague presentations, forging paths to project approvals.
Design Mastery Tips
- Scale accurately: Match rulers to project metrics for realism.
- Layer thoughtfully: Build pyramids from base data up.
- Illustrate sparingly: Enhance with subtle icons.
- Review collaboratively: Share edits in real-time.
- Storytell with measures: Link rulers to narrative arcs.
From architectural pros, these elevate drafts to masterpieces.
Scale Your Success: Acquire Now
Don't measure short - equip yourself with our Architectural Rulers template and construct presentations that endure.
FAQ
- How precise are the rulers? Fully scalable, edit to exact measurements.
- AIA-compliant? Designed with standards in mind for professional use.
- For engineers too? Yes, ideal for technical diagrams.
- File compatibility? .pptx, works across platforms.
- Customization depth? Unlimited - colors, sizes, integrations.
- Example uses? Proposals, reports, educational sessions.