Traffic Lights PowerPoint Charts Template - Download Presentation


Type: PowerPoint Charts template
Category: 3D, Illustrations
Sources Available: .pptx
Product ID: PC00032
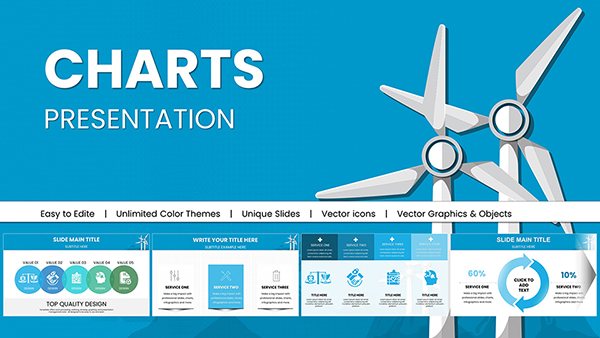
Template incl.: 16 editable slides
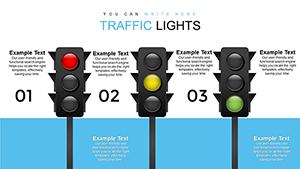
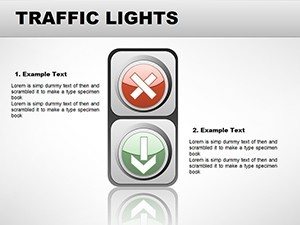
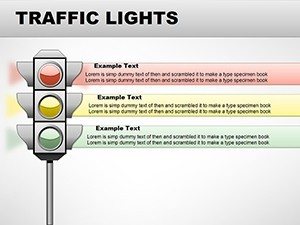
Picture this: a project review where status updates light up like traffic signals, instantly conveying go, caution, or stop without a word wasted. Our Traffic Lights PowerPoint charts template brings this vision to life with 16 editable slides, engineered for analysts, managers, and trainers who need to communicate progress at a glance. Rooted in risk management frameworks like those from PMI, these charts use red, yellow, and green to simplify dashboards, making them indispensable in fast-paced environments. Whether tracking KPIs in finance or grading student performance in education, this tool transforms data into actionable insights. Fully compatible with PowerPoint and Google Slides, it offers quick edits that fit into busy schedules. Marketers have leveraged similar visuals to highlight campaign phases, boosting stakeholder buy-in. With 3D elements adding pop, these aren't your average indicators - they're conversation starters that foster collaboration. Say goodbye to lengthy explanations; let colors do the talking, enhancing efficiency and reducing miscommunication in your next deck.
Lighting the Path: Essential Features Explored
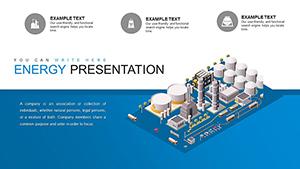
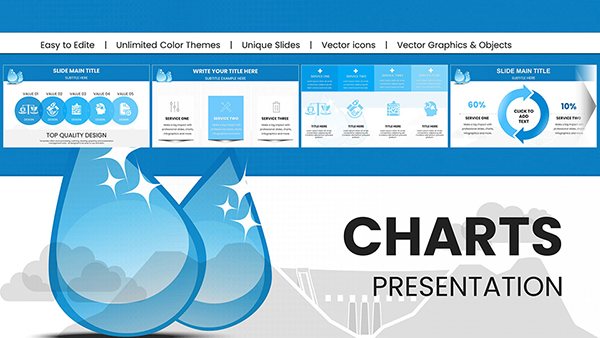
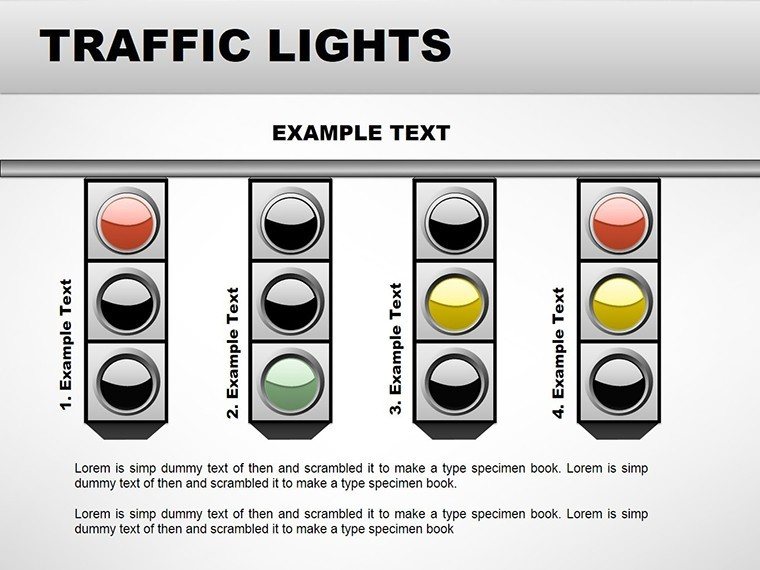
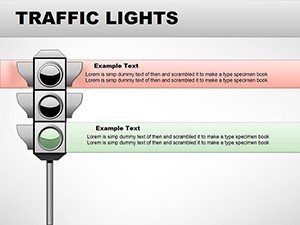
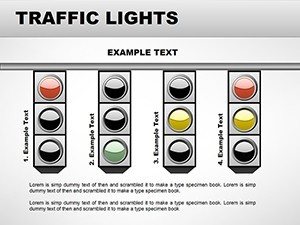
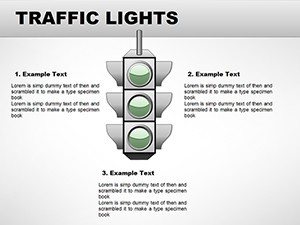
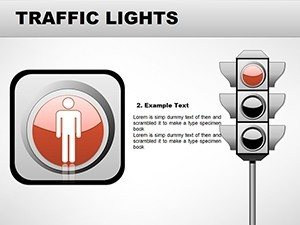
At its core, this template shines with features that prioritize clarity and impact. Each slide incorporates traffic light motifs in 3D for depth, from simple status bulbs to integrated dashboards blending illustrations with data. Benefits abound: visual cues accelerate decision-making, as studies show color-coded info processes 60% faster. As a marketing analyst, I've seen these charts turn quarterly reviews from tedious to triumphant. Customization is robust - tweak light intensities, add labels, or link to metrics for live updates. Unlike basic emoji inserts, these professional-grade elements scale elegantly, maintaining HD quality. For business pros, a dashboard slide aggregates multiple lights for portfolio overviews, streamlining reports. Educators use graduated lights for skill assessments, making feedback intuitive. The intuitive design requires no coding, just point-and-click prowess.
Illuminating Slides: A Guided Tour
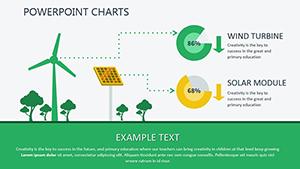
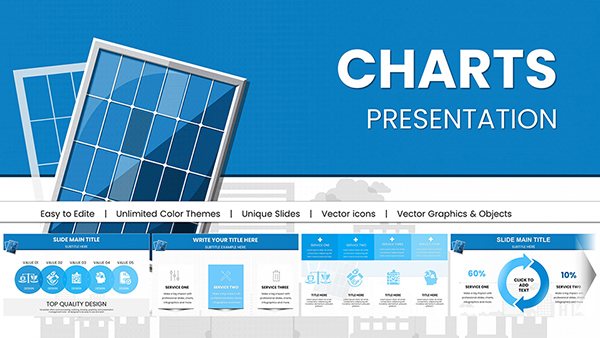
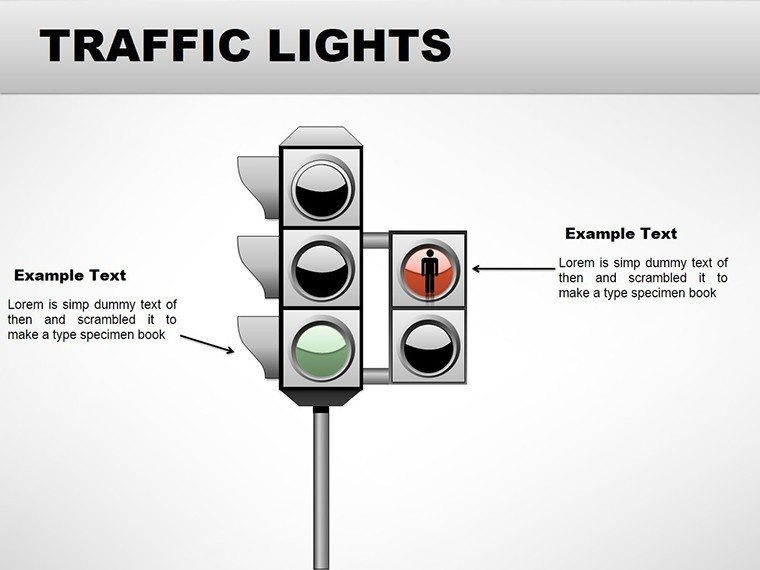
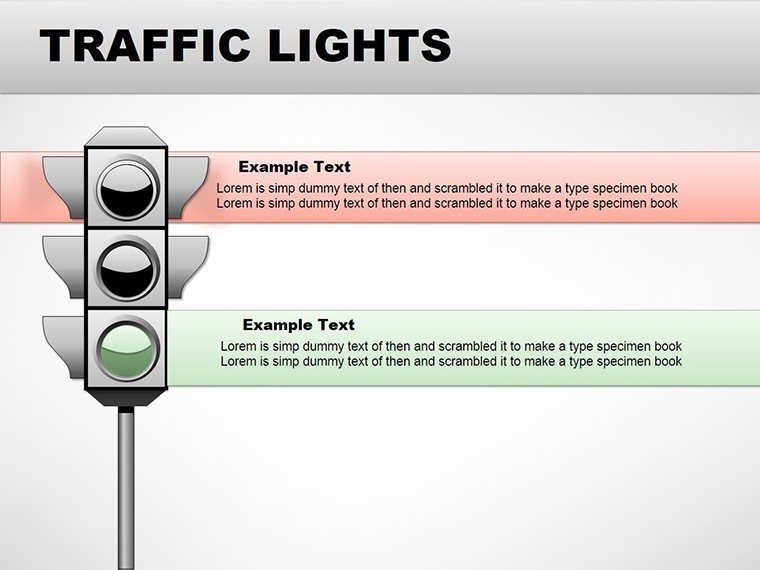
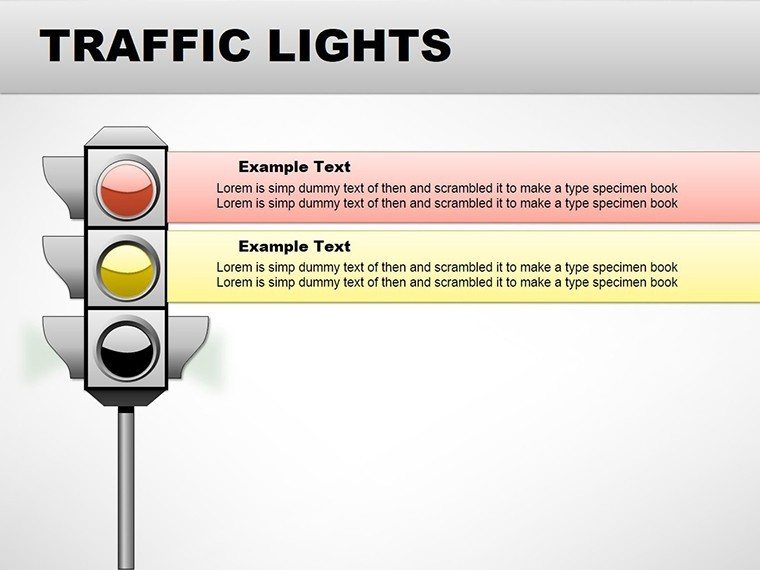
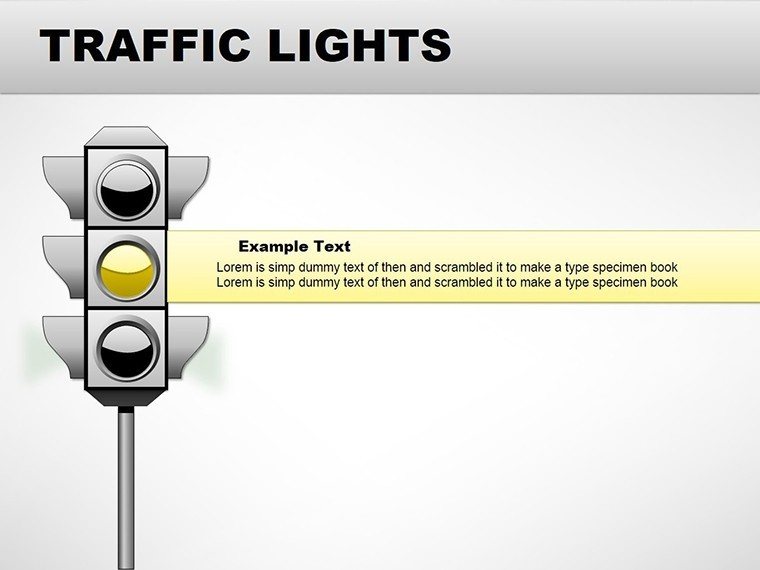
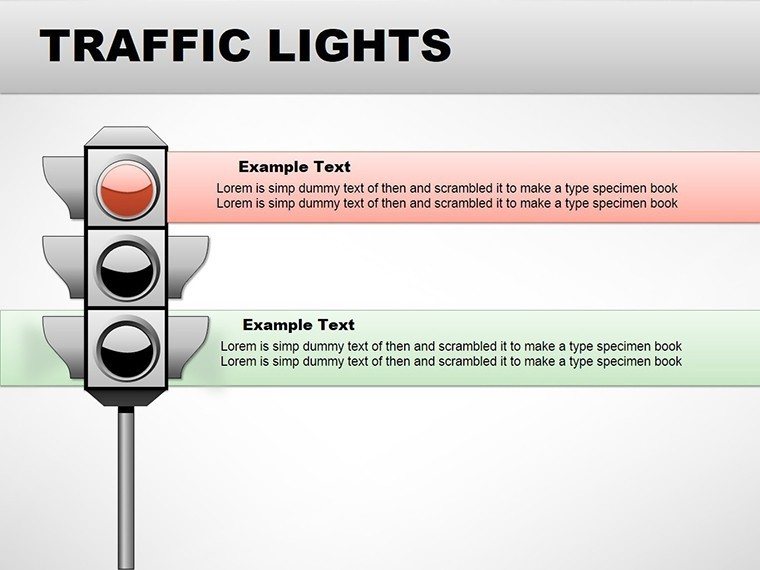
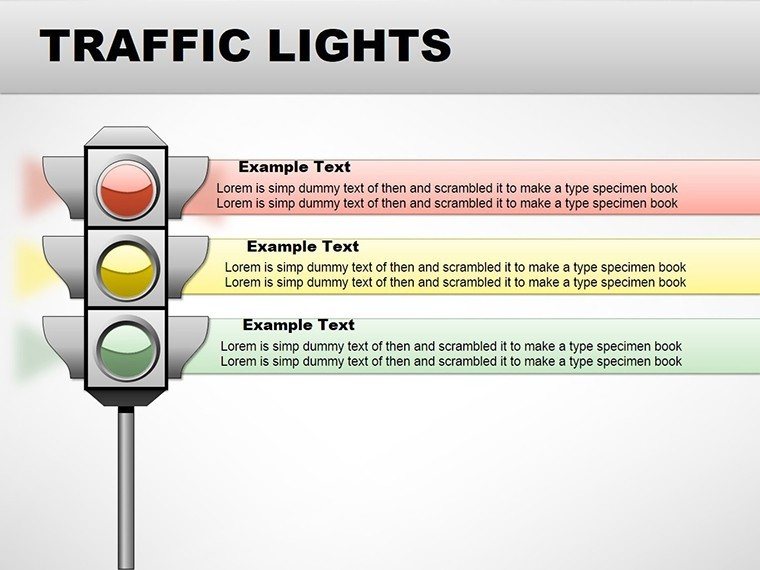
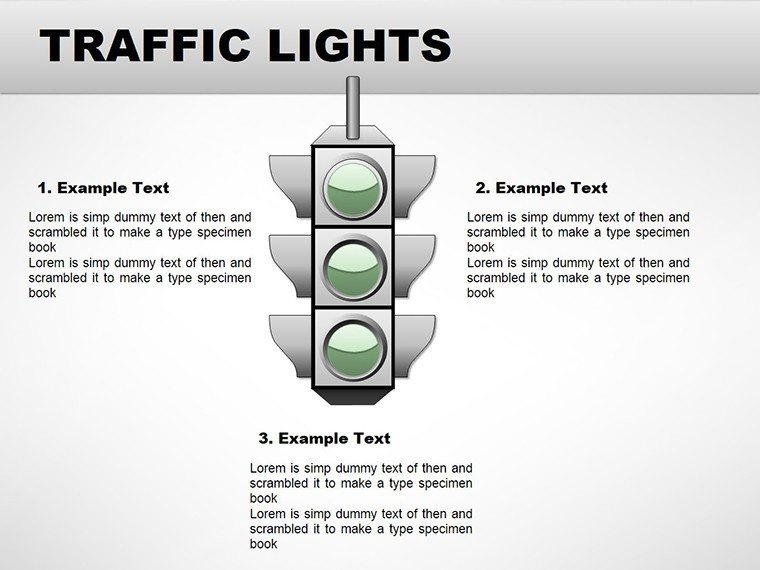
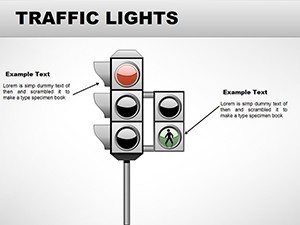
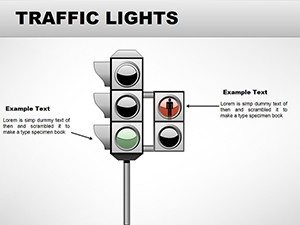
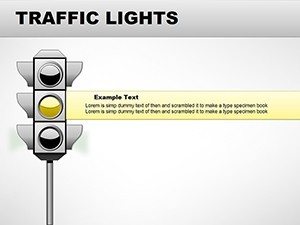
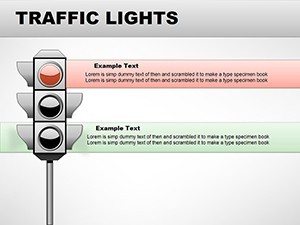
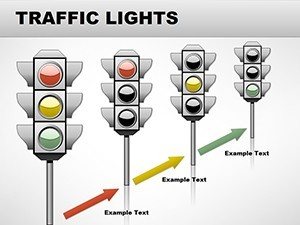
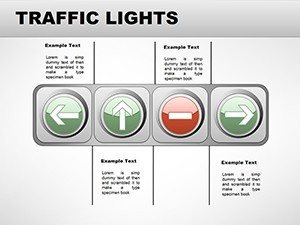
Delve into specifics: Slide 2 offers a basic traffic light column for quick status checks, editable for RAG (Red-Amber-Green) reporting in IT projects. Slide 6 escalates to a 3D intersection view, perfect for multi-factor analyses like market risks. By Slide 11, integrated charts combine lights with graphs, visualizing trends over time. All 16 slides ensure compatibility across versions, with animations that flicker realistically for emphasis. Value lies in versatility: analysts customize for data integrity checks, ensuring trustworthiness. Compared to static tables, these dynamic visuals engage more, per UX principles. For marketers, Slide 14's funnel with lights tracks lead progression, highlighting bottlenecks vividly.
Signaling Wins: Practical Applications
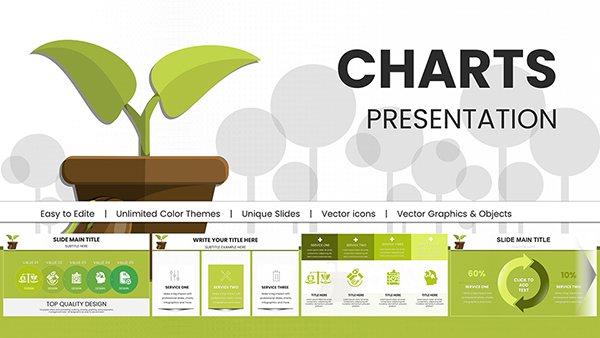
In practice, this template powers diverse uses. For project managers adhering to Agile methodologies, use lights to signal sprint health, as in a Scrum retrospective where green means on-track. A real example: a tech firm reduced meeting times by 30% using these for status huddles. Workflow: Select slide, input criteria, color-code automatically via conditional formatting tips included. Integrate with Excel for seamless data flow. In finance, lights flag budget variances, aiding compliance with GAAP standards. Trainers apply them in e-learning modules, where interactive lights quiz learners on progress. The edge? Builds authority by presenting data transparently, minimizing disputes. Tips: Use amber for nuances, avoiding binary pitfalls; calibrate colors for cultural sensitivity in global teams. This solves the hassle of ambiguous reports, paving the way for informed actions.
Expert Illumination Tips
- Automate with data: Link to sources for real-time color shifts.
- Balance visuals: Pair lights with text for context-rich slides.
- Enhance with 3D: Rotate views for multi-angle insights.
- Audience-test: Ensure colors convey intended urgency.
- Narrate effectively: Build stories around light changes.
These insights, from presentation best practices, maximize the template's glow.
Green Light Your Success: Download Today
Stop hesitating - light up your presentations with our Traffic Lights template and drive results forward.
FAQ
- How do colors update? Manually or via linked data for automation.
- Compatible with Mac? Yes, full PowerPoint support.
- Ideal for what? Status tracking in projects, finance, education.
- 3D editable? Fully, adjust perspectives easily.
- Any limits on use? Unlimited for personal or professional.