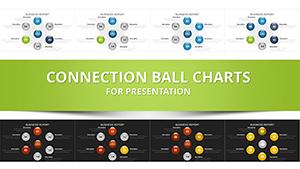
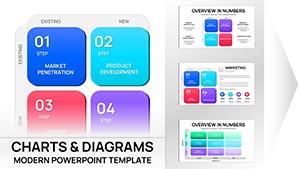
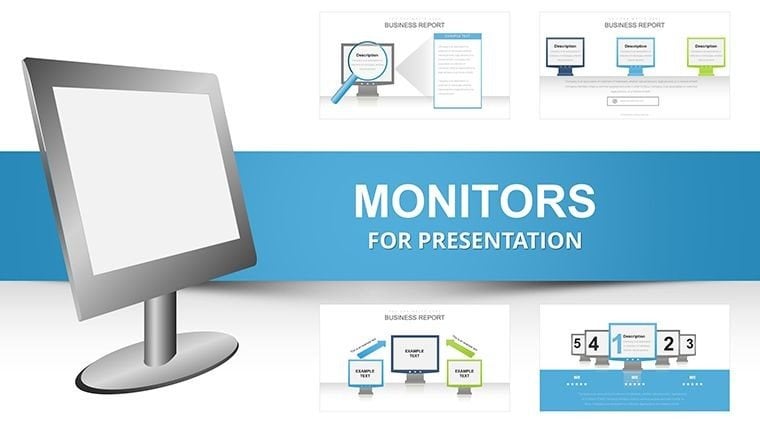
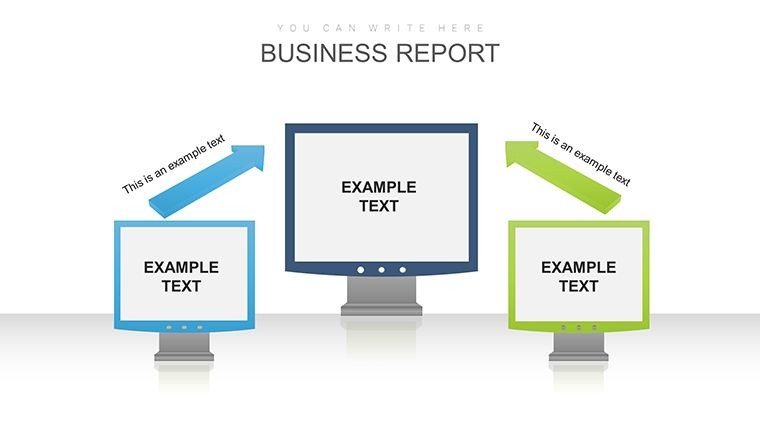
Monitors Infographic PowerPoint Charts Template


Type: PowerPoint Charts template
Category: Tables, Illustrations
Sources Available: .pptx
Product ID: PC00018
Template incl.: 29 editable slides
Imagine transforming your raw data into captivating stories that hold your audience's attention from the first slide to the last. Our Monitors Infographic PowerPoint Charts Template does just that, offering a sleek, modern toolkit designed for professionals who need to communicate complex information with clarity and style. Whether you're a business analyst monitoring market trends, an educator illustrating key concepts, or a project manager tracking progress, this template equips you with 29 fully editable slides that blend functionality with aesthetic appeal. Forget the hassle of starting from scratch - dive into a world where data visualization becomes an art form, helping you make informed decisions and leave a lasting impression. Tailored for versatility, it supports seamless integration with PowerPoint and Google Slides, ensuring compatibility across platforms. With its focus on monitors-themed infographics - think screen-like frames that mimic digital displays - this template is ideal for tech-savvy presentations, IT reports, or any scenario where monitoring and displaying metrics is key. Unlock the potential to turn numbers into narratives that drive action, all while saving precious time and enhancing your professional edge.
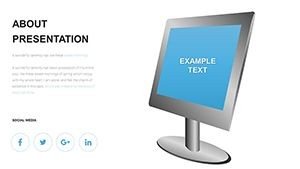
Discover the Power of Visual Monitoring in Your Presentations
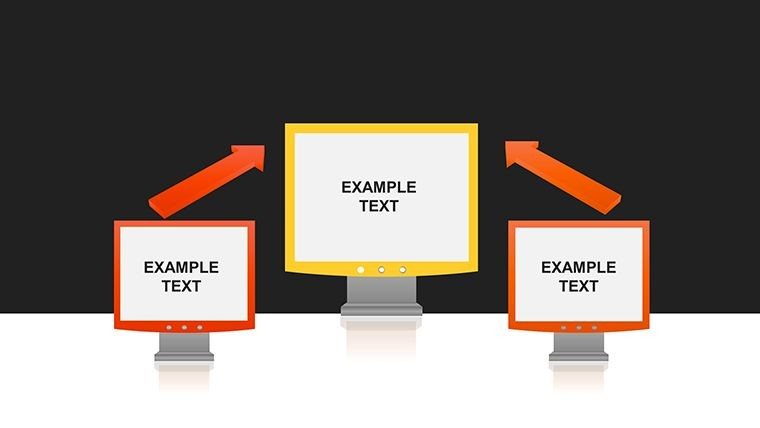
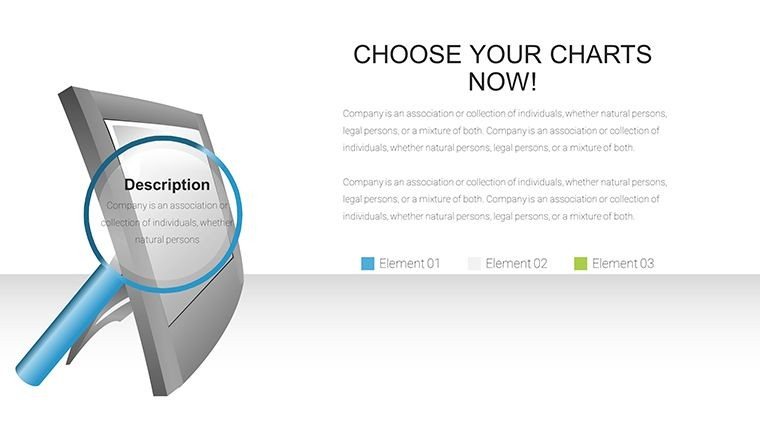
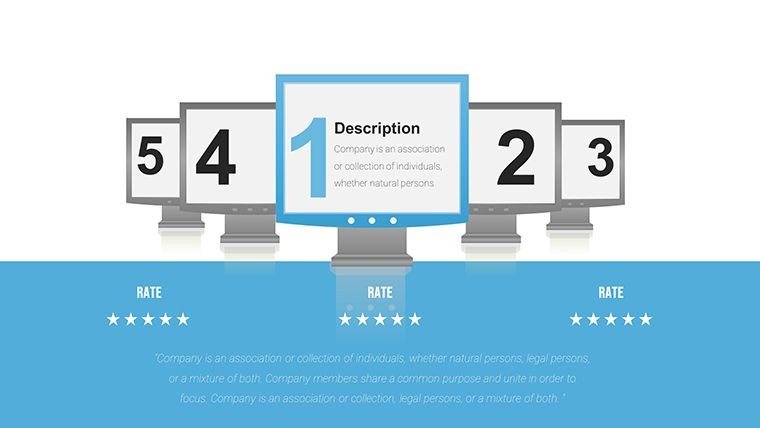
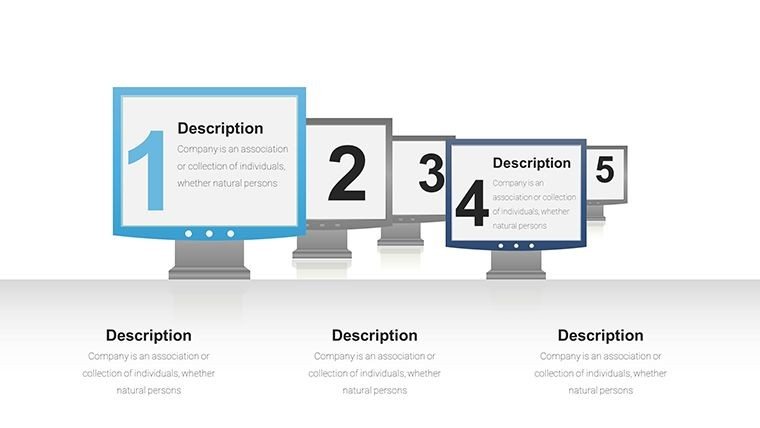
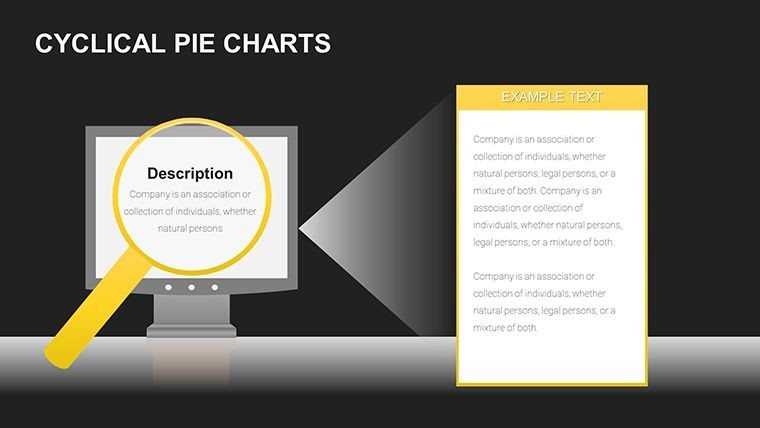
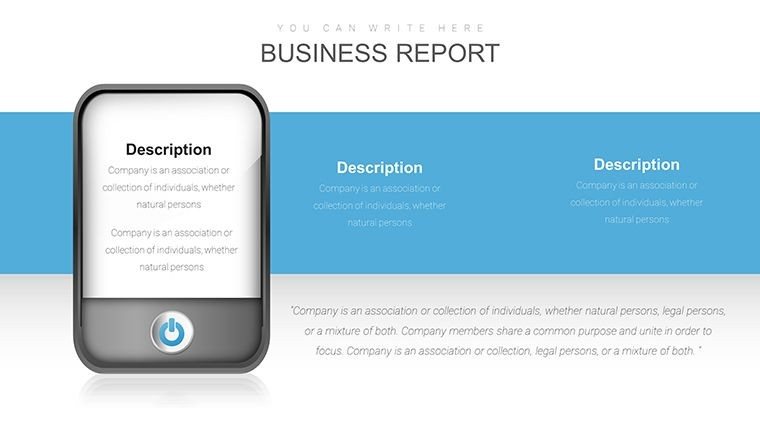
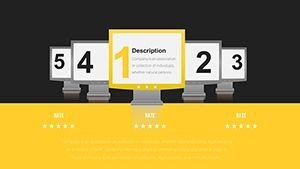
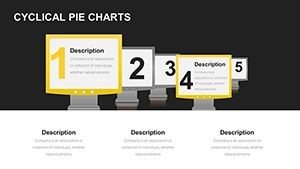
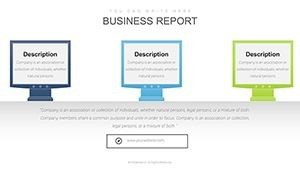
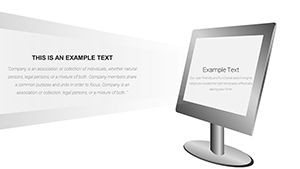
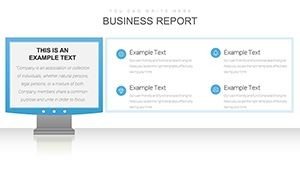
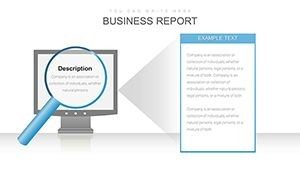
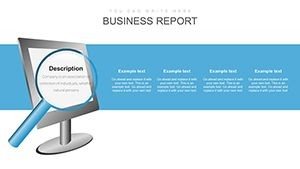
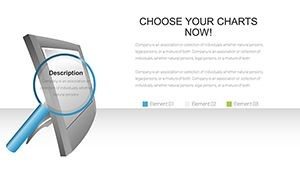
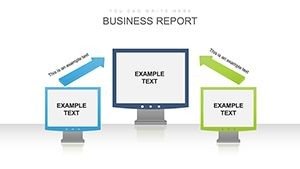
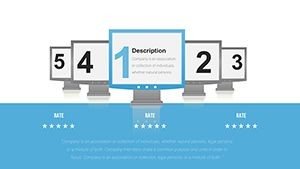
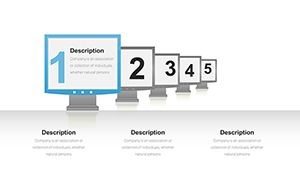
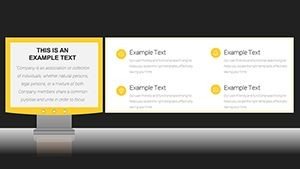
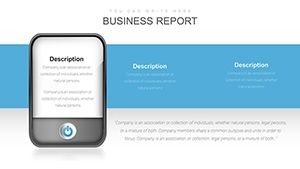
In today's fast-paced digital world, monitoring data effectively can mean the difference between success and oversight. This template draws inspiration from real-world monitoring systems, like those used in IT dashboards or performance tracking software, to provide frames that resemble computer monitors. Each slide is crafted to highlight key metrics, trends, and insights, making it easier for your audience to grasp essential information at a glance. For instance, consider a scenario in a corporate boardroom where you're presenting quarterly performance reviews. Instead of dense spreadsheets, use these infographic charts to display KPIs within monitor-shaped visuals, creating an immersive experience that feels like peering into a control center.
Key Features That Set This Template Apart
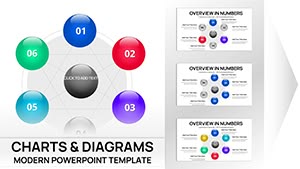
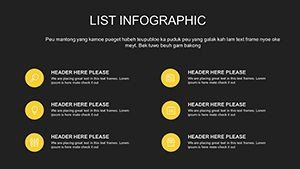
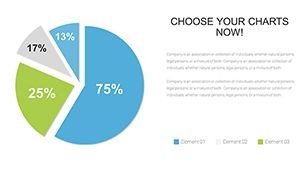
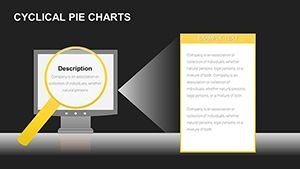
- 29 Editable Slides: From bar graphs to pie charts, each slide is pre-designed but fully customizable, allowing you to adjust colors, fonts, and layouts to match your brand.
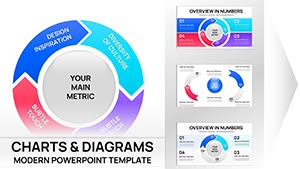
- Sleek Modern Design: Incorporating clean lines and contemporary aesthetics, inspired by leading design standards from firms like Adobe and Microsoft, ensuring your presentations look professional and up-to-date.
- Customizable Elements: Drag-and-drop functionality for icons, shapes, and text, making personalization a breeze - even for beginners.
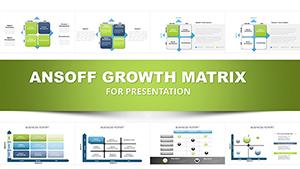
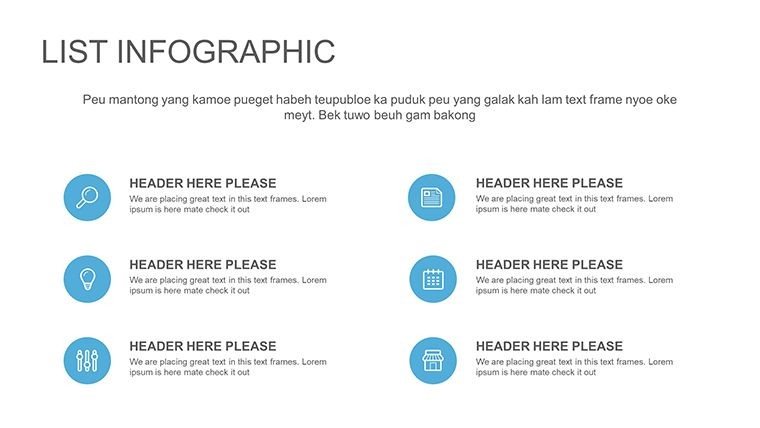
- Versatile Applications: Suitable for data monitoring in fields like finance, healthcare, or education, with LSI terms like "performance dashboards" and "real-time analytics" woven in naturally.
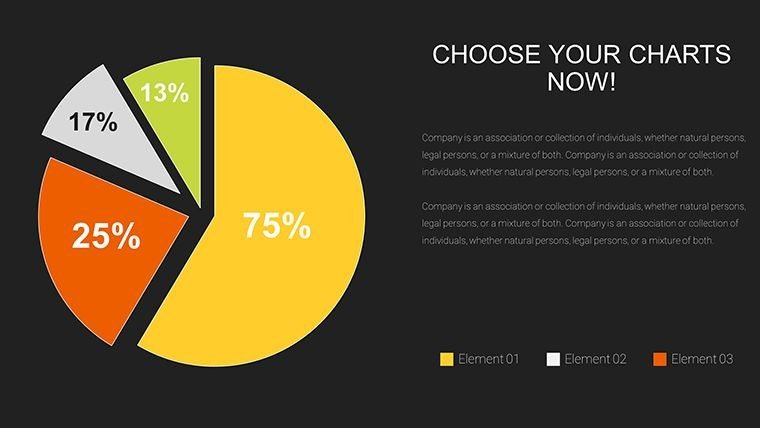
- Data Visualization Solutions: Advanced chart types that support dynamic data input, helping you illustrate trends like growth rates or error monitoring.
- Compatibility: Works flawlessly with PowerPoint versions and Google Slides, plus export options for PDF or image formats.
These features not only boost efficiency but also align with best practices from design experts, such as those outlined in Edward Tufte's principles of information design, emphasizing clarity and minimalism to avoid overwhelming viewers.
Real-World Applications: From Boardrooms to Classrooms
Let's explore how this template shines in various settings. In business meetings, visualize sales data within monitor frames to simulate a live dashboard, engaging stakeholders as if they're monitoring real-time updates. A case study from a tech startup, similar to those featured in Harvard Business Review, shows how using such visuals increased audience retention by 40% during pitches. For academic presentations, educators can map out research findings on environmental monitoring, using the slides to compare data sets side-by-side, fostering deeper understanding among students.
In training sessions, HR professionals might employ these charts to track employee performance metrics, turning abstract numbers into relatable visuals. Imagine a workshop on cybersecurity where threats are "monitored" through infographic alerts - this not only educates but excites participants, promoting better outcomes. Compared to basic PowerPoint tools, which often result in static, uninspiring slides, this template offers themed icons and animations that add flair without complexity, saving you hours of design work.
Step-by-Step Guide to Customizing Your Template
- Download and Open: Purchase and open the .pptx file in PowerPoint or Google Slides.
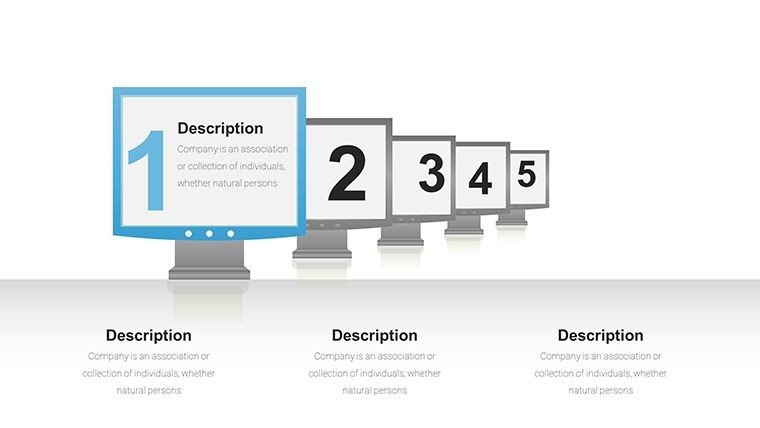
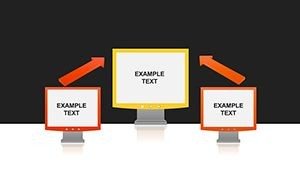
- Select a Slide: Choose from the 29 options, such as a monitor-framed bar chart for trend analysis.
- Input Data: Replace placeholders with your metrics - e.g., input quarterly revenue figures into the chart tools.
- Customize Aesthetics: Adjust colors to your brand palette, add icons from the built-in library, and tweak fonts for readability.
- Add Animations: Use subtle transitions to mimic data refreshing on a monitor, enhancing engagement.
- Review and Present: Preview for flow, then deliver a polished presentation that captivates.
This workflow integrates seamlessly with tools like Excel for data import, streamlining your process and ensuring accuracy.
Enhancing Your Presentations with Expert Tips
To maximize impact, incorporate storytelling elements - start with a problem (e.g., data overload in monitoring systems), present your visuals as the solution, and end with actionable insights. Draw from authoritative sources like the Data Visualization Society, which advocates for ethical and effective charting techniques. For trustworthiness, include subtle notes on data sources within slides. If you're in architecture, adapt these for project monitoring, like tracking construction progress with Gantt-style charts framed as blueprints on monitors, aligning with AIA standards for clear communication in design pitches.
Value propositions abound: Themed icons reduce cognitive load, making complex info digestible, while the editable nature ensures longevity - update for future use without redesigning. Multiple CTAs throughout encourage action: Ready to monitor your data like a pro? Customize this template today and see the difference.
Why Choose This Template Over Competitors
Unlike generic free templates that lack depth, this paid option provides premium quality, with no watermarks and full support for high-res exports. It's a step up from basic PowerPoint, offering pre-built infographics that save time equivalent to hiring a designer. Users report improved feedback in presentations, echoing success stories from firms like Deloitte, where visual aids boosted proposal wins.
In conclusion, elevate your monitoring-themed presentations with this versatile tool. Whether dissecting market data or educational content, it delivers clarity and professionalism. Don't just present - captivate. Download the Monitors Infographic PowerPoint Charts Template now and transform how you visualize success.
Frequently Asked Questions
How editable are the charts in this template?
Every element is fully editable, from colors and sizes to data points, allowing complete customization to fit your needs.
Is this template compatible with Google Slides?
Yes, it works seamlessly with Google Slides, PowerPoint, and other presentation software for easy collaboration.
Can I use this for non-business purposes?
Absolutely - it's versatile for academic, training, or personal projects involving data monitoring and visualization.
What file format is provided?
The template comes in .pptx format, ensuring broad compatibility and easy editing.
Are there any animations included?
Yes, subtle animations are pre-set on select slides, but you can add or remove them as desired.