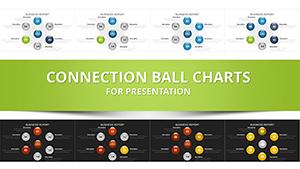
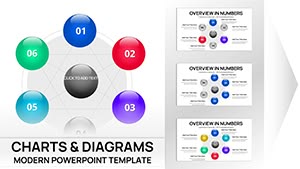
Cyclical Balls PPT Charts Template - 31 Slides


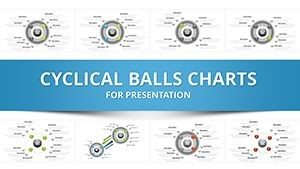


As a presentation consultant who's built hundreds of decks for Fortune 500 executives and university professors, I know the frustration of trying to convey repeating processes with flat, uninspiring visuals. That's where this Cyclical Balls template shines - it transforms abstract cycles into dynamic, 3D spheres that guide viewers through interconnected stages seamlessly. With 31 fully editable slides, it's designed for professionals who need to present market trends, project iterations, or learning progressions without losing audience attention.
This template isn't just about aesthetics; it's a practical tool that saves hours in design time while ensuring your message lands with clarity. Whether you're pitching to investors on economic loops or teaching students about historical patterns, these ball charts add depth and motion that standard diagrams can't match. I've used similar layouts in client sessions to boost comprehension by highlighting feedback mechanisms in real-time.
What sets this apart is its focus on cyclical storytelling, inspired by innovative design firms - turning data into a narrative journey that resonates in boardrooms and classrooms alike.
Detailed Breakdown of Key Slides
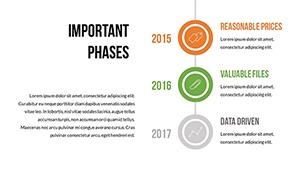
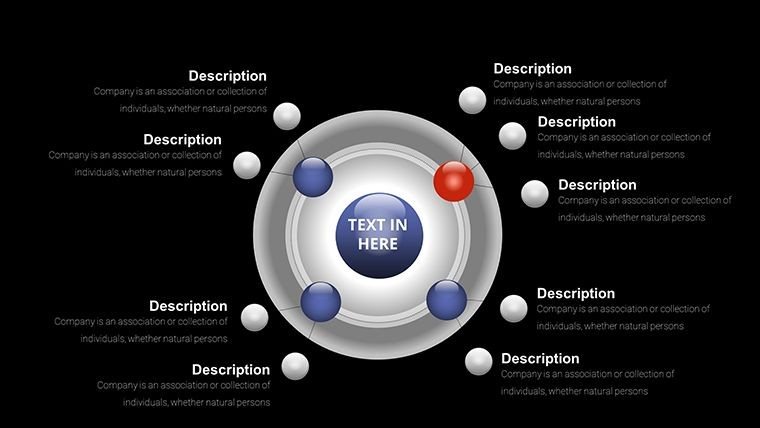
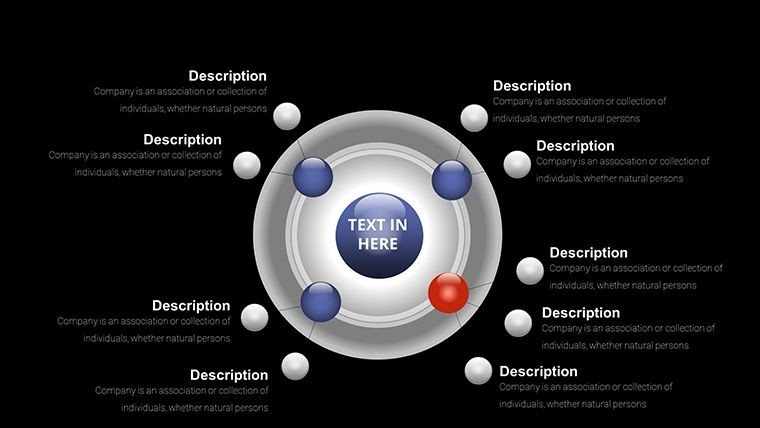
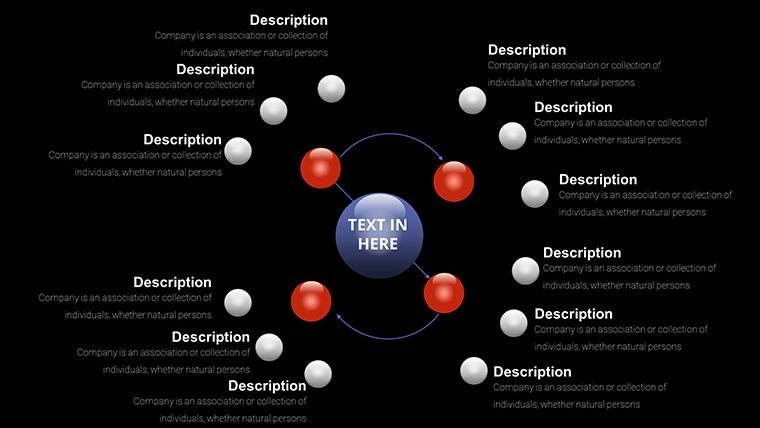
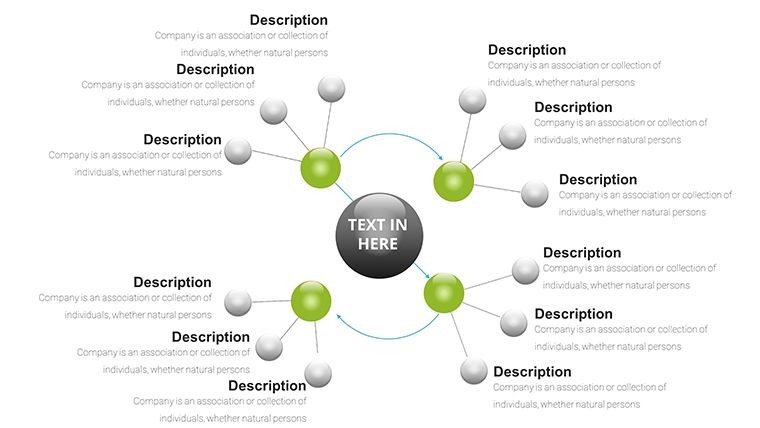
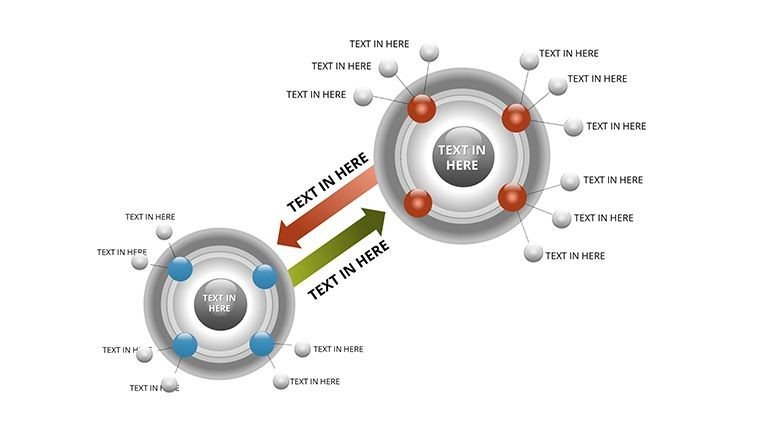
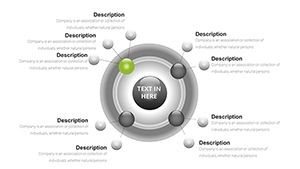
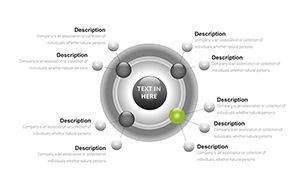
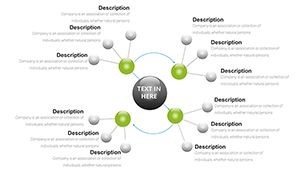
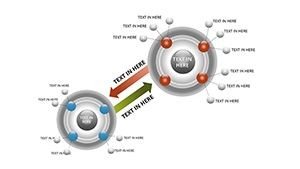
Let's dive into the structure. The first set of slides introduces basic loops with 4-6 balls, ideal for outlining quarterly sales cycles where each sphere represents a phase like planning, execution, review, and adjustment. You input your data, and the balls automatically align in a circular path, with color gradients showing progression.
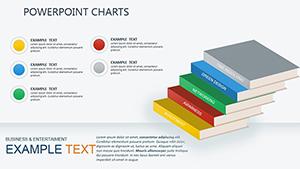
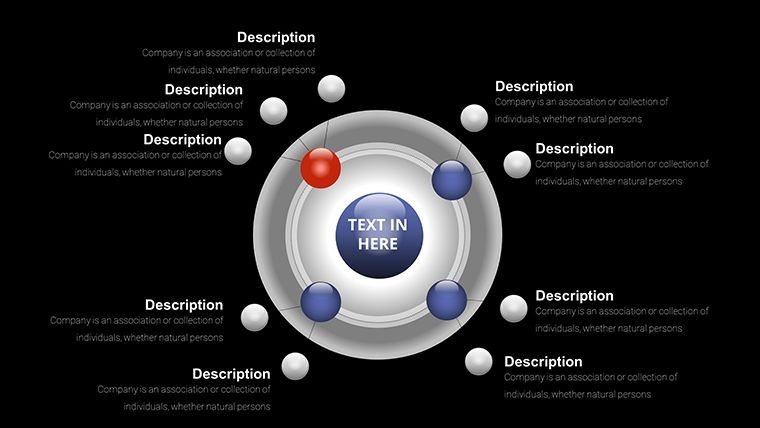
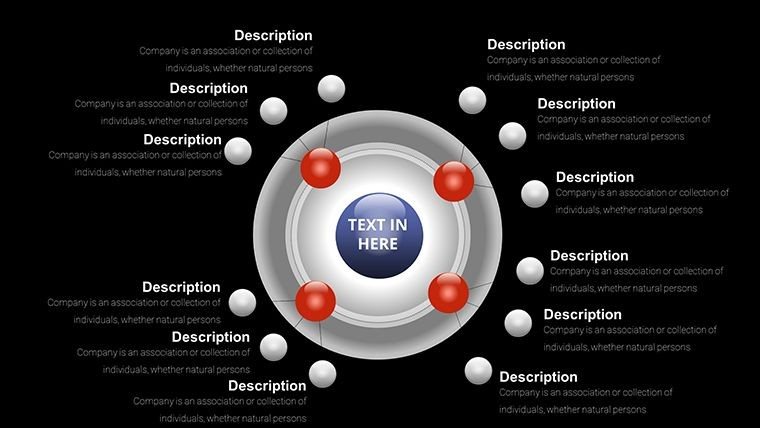
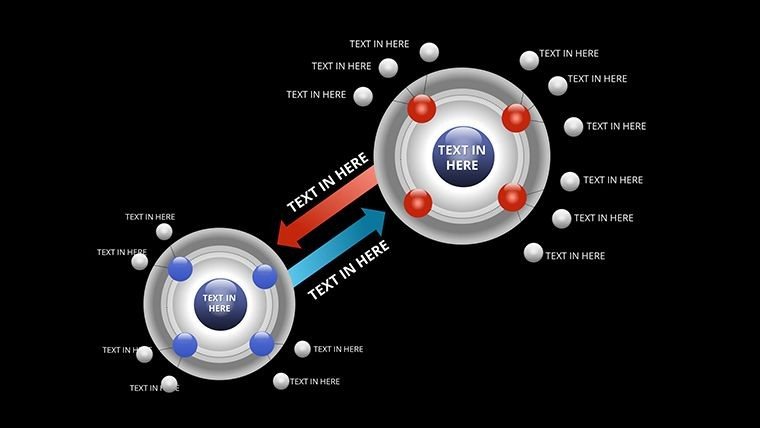
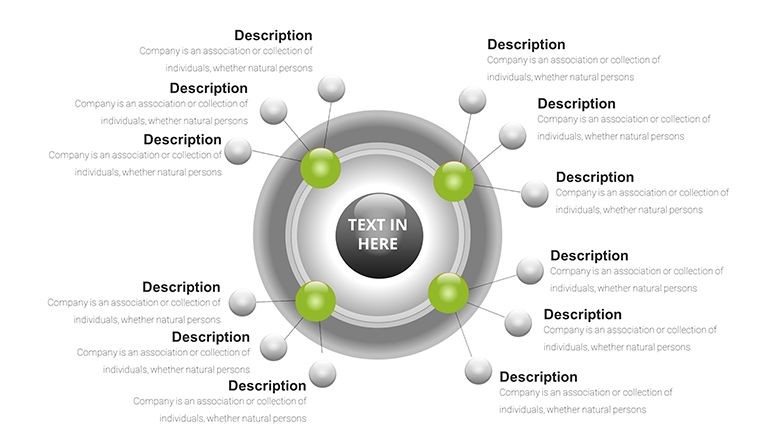
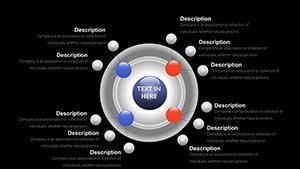
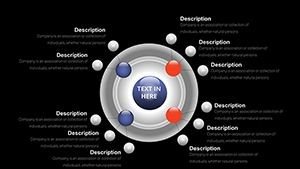
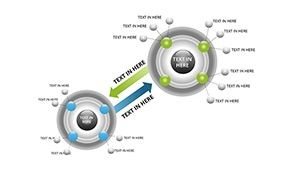
Mid-template slides expand to multi-layered hierarchies, using nested balls to depict sub-cycles within larger ones - for instance, embedding team workflows inside company-wide processes. Customization is straightforward: drag to resize, click to recolor, and type to label, all while maintaining vector sharpness.
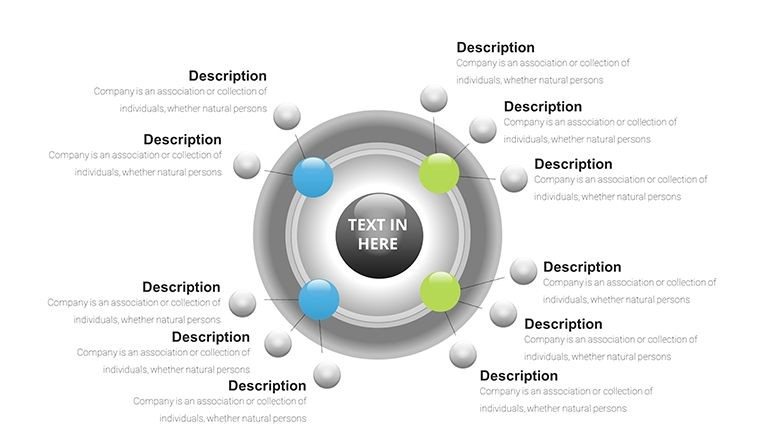
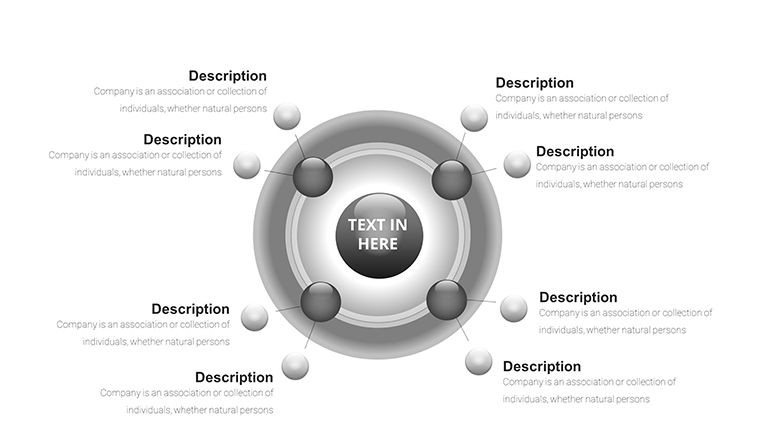
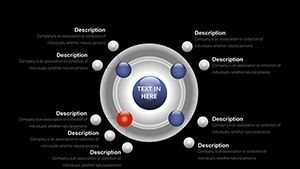
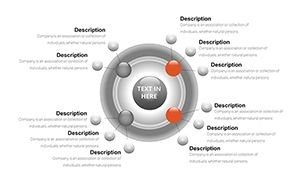
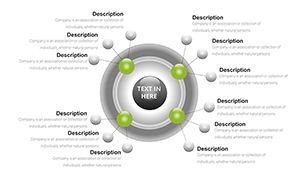
Advanced slides incorporate 3D effects for volume, perfect for visualizing growth in iterative designs, like software development sprints. Add animations for rolling transitions, making your presentation feel alive and interactive.
Professional Applications in Action
In board meetings, I've deployed these charts to map out supply chain recursions, helping directors spot bottlenecks in manufacturing loops. For investor pitches, they illustrate revenue cycles, demonstrating sustainability to stakeholders with visual precision.
Educators rely on them for syllabus overviews, breaking down semester progress into digestible spheres that students can follow easily. In government briefings, they clarify policy implementation phases, fostering better inter-departmental understanding.
Enterprise teams use them in strategy sessions to visualize risk management cycles, ensuring every participant grasps the ongoing nature of assessments and mitigations.
Seamless Integration into Your Workflow
This template slots right into your existing setup - open in PowerPoint 2016 or later, import to Google Slides, or edit in Keynote with full compatibility. Start by downloading the .pptx file, then populate placeholders with your metrics; the layout adapts without extra formatting.
Time savings are immediate: what used to take afternoons in custom drawing now happens in minutes. For teams under deadlines, this means more focus on content, less on design tweaks.
Customize further by integrating your brand colors or adding data from Excel - it's built for efficiency in high-stakes environments.
Real-World Presentation Scenarios
- Consultants mapping client feedback loops in proposal decks, accelerating approval cycles.
- Managers illustrating performance review processes in team huddles, promoting transparency.
- Educators depicting ecological cycles in lectures, enhancing student retention through visuals.
- Founders showing business model iterations to venture capitalists, building investor confidence.
- Analysts charting economic indicators in reports, providing clear trend insights.
Template Advantages Comparison
| Aspect | This Template | Default PowerPoint | Building from Scratch | Alternative Solutions |
|---|---|---|---|---|
| Design Quality | Professional 3D balls with auto-align | Basic flat circles | Inconsistent without expertise | Often generic or overpriced |
| Customization Time | Minutes with intuitive tools | Hours for tweaks | Days for polish | Varies, but less flexible |
| Visual Impact | High with depth and motion | Low engagement | Depends on skill | May lack cycle specificity |
| Cost Efficiency | One-time low fee, lifetime use | Free but time-costly | High opportunity cost | Subscription models add up |
Industry-Specific Use Cases
In finance, depict interest rate cycles to forecast trends for portfolio managers. Tech firms use them for agile sprint overviews, streamlining development discussions.
Healthcare professionals visualize patient care pathways, improving protocol adherence. Educators craft lesson plans around knowledge acquisition loops.
Marketers map customer journey recursions, optimizing campaign strategies. Consultants employ them in operational audits, highlighting improvement cycles.
Get started with this template to bring your cyclical data to life in ways that drive decisions.
Frequently Asked Questions
How do I adjust the number of balls in a cycle?
Simply duplicate or delete spheres via the selection pane; the layout recalibrates automatically. This flexibility lets you tailor to 3-step quick reviews or 12-month detailed plans, all while keeping the 3D integrity intact for professional output.
Is this compatible with older PowerPoint versions?
It works best in PowerPoint 2016 and above, but basic edits are possible in 2013. For full animation support, update your software - I've tested it across versions in client environments to ensure reliability.
Can I incorporate my company branding easily?
Yes, use the color theme picker to match your palette, and replace fonts with one click. This integration has helped my enterprise clients maintain consistency in global presentations without extra hassle.
What if I need more than 31 slides?
Duplicate existing ones as needed; the template's modular design supports expansion. In my experience, starting with these 31 covers most scenarios, from brief overviews to in-depth analyses.
How does this handle data from spreadsheets?
Link or paste from Excel - the balls update dynamically. This feature streamlines updates for quarterly reports, saving time in fast-paced business settings.
Are animations pre-set for cycles?
Yes, with options for rolling paths that emphasize progression. Customize timing to fit your narrative pace, enhancing engagement in live sessions.