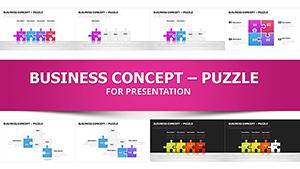
3D Puzzle PowerPoint Charts Template - Download Now


In high-stakes boardrooms or intensive strategy sessions, I've seen how flat charts fail to capture the complexity of interlocking business elements. That's where the 3D Puzzle PowerPoint Charts Template changes the game, turning abstract connections into tangible, three-dimensional visuals that make your audience lean in and truly grasp how pieces fit together.
This collection delivers 45 fully editable slides designed specifically for illustrating interdependent components, whether mapping out supply chain dependencies, aligning team roles in a merger, or demonstrating how marketing initiatives interlock to drive revenue. The depth of 3D puzzle pieces adds a layer of sophistication that standard 2D graphics simply can't match, helping executives and stakeholders instantly see relationships and potential gaps.
As someone who builds decks for C-level reviews and investor updates every week, I rely on tools like this to elevate data storytelling without spending hours on custom design work.
Exploring the Core Layouts in This 3D Puzzle Collection
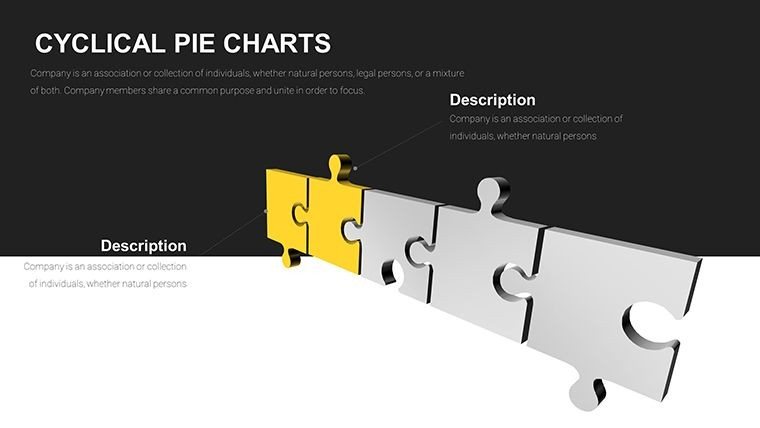
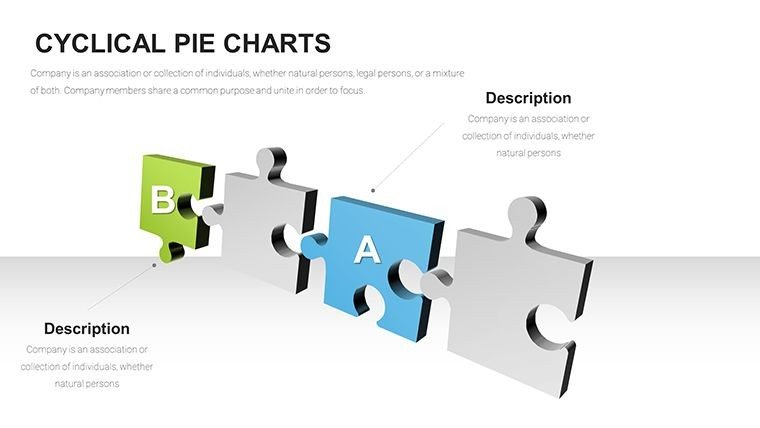
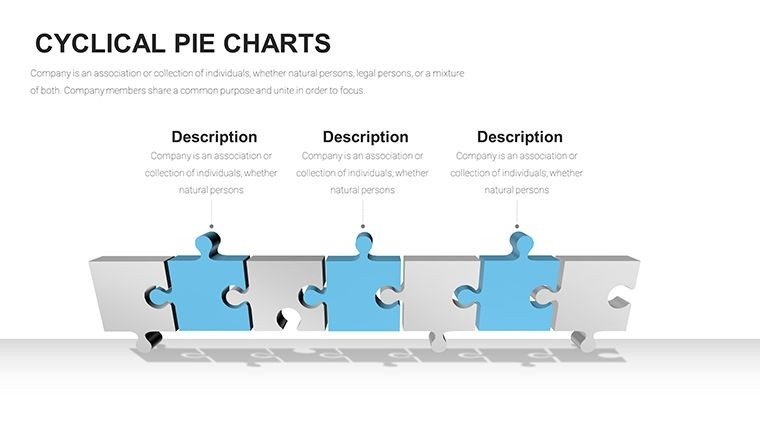
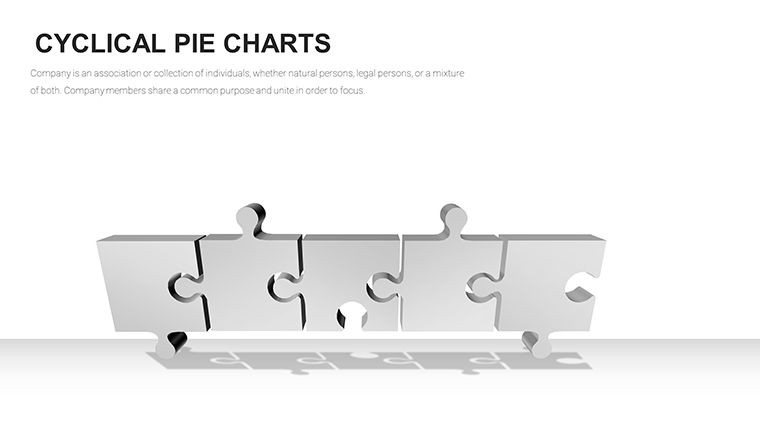
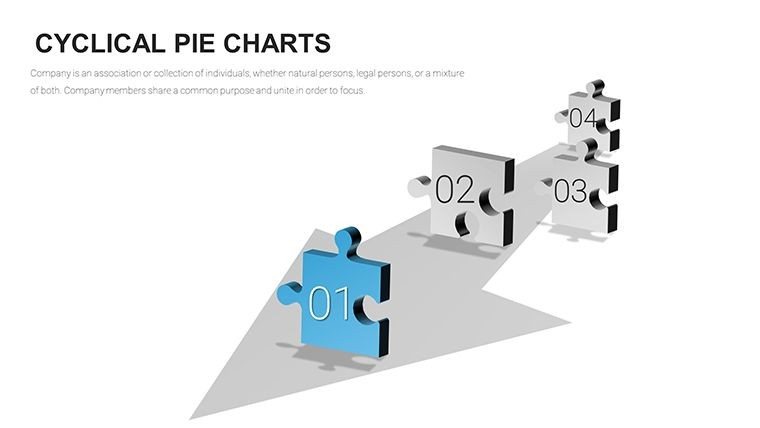
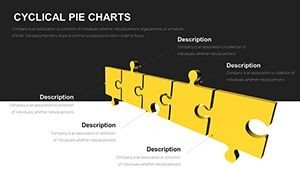
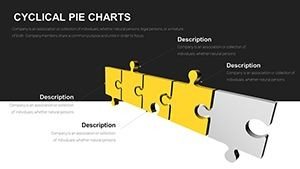
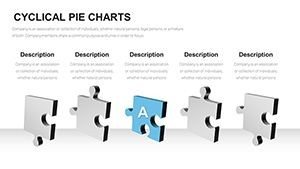
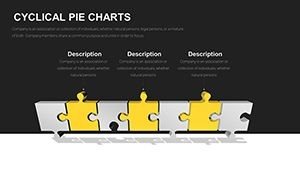
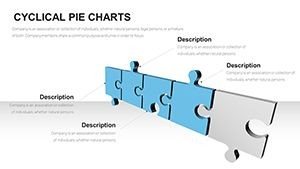
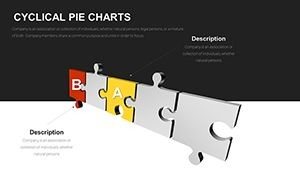
The template centers on versatile 3D puzzle piece configurations, each crafted to highlight connectivity and assembly.
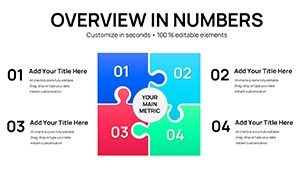
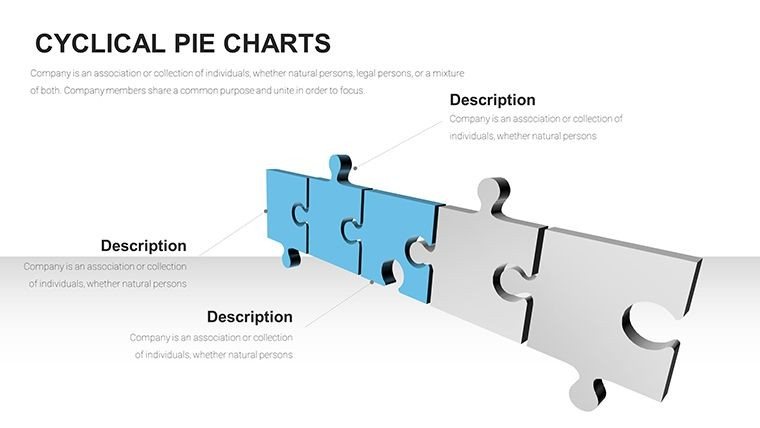
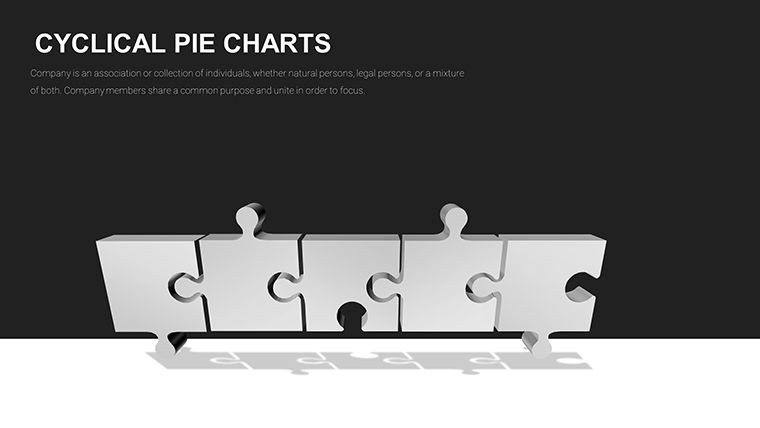
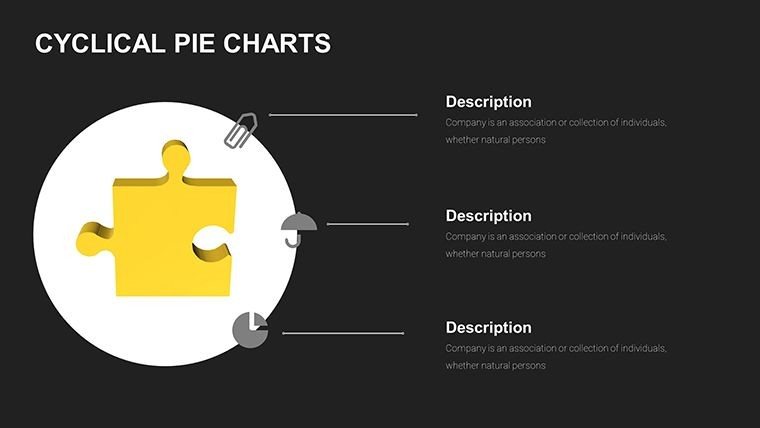
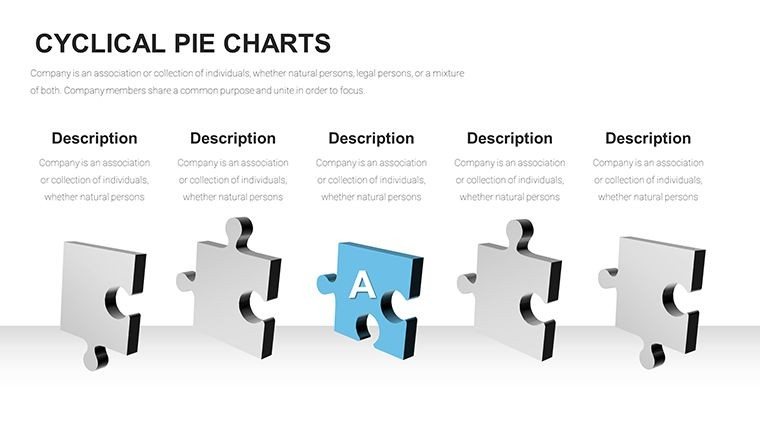
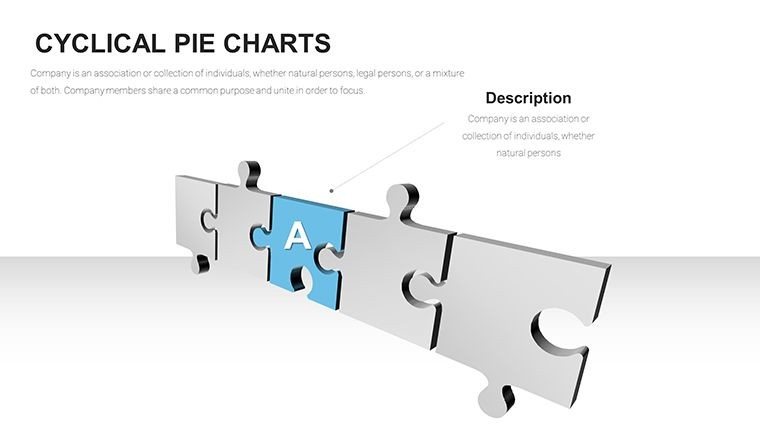
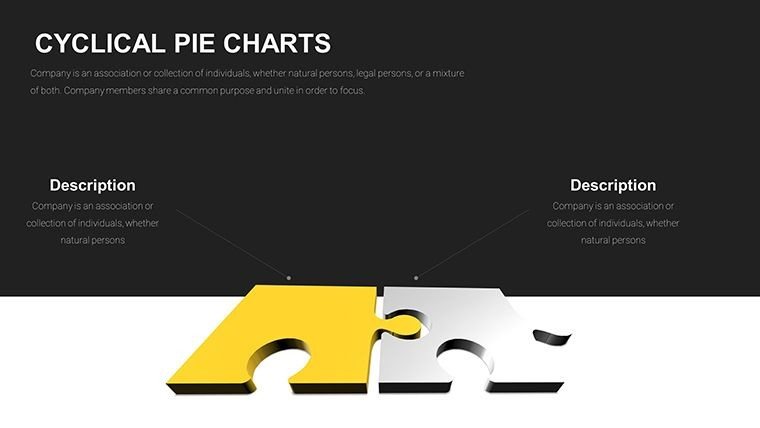
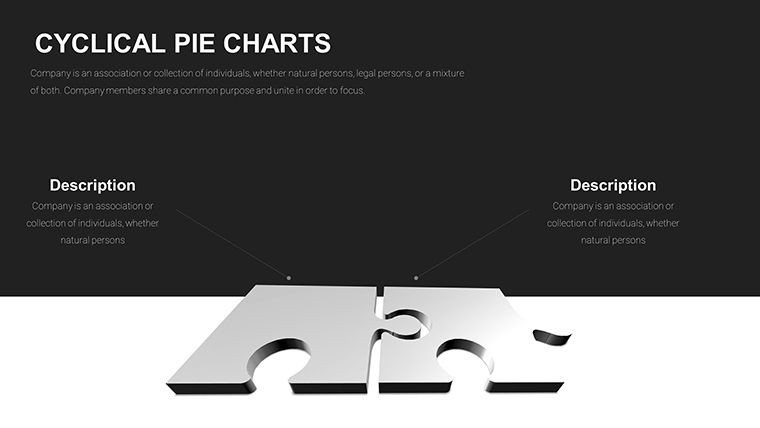
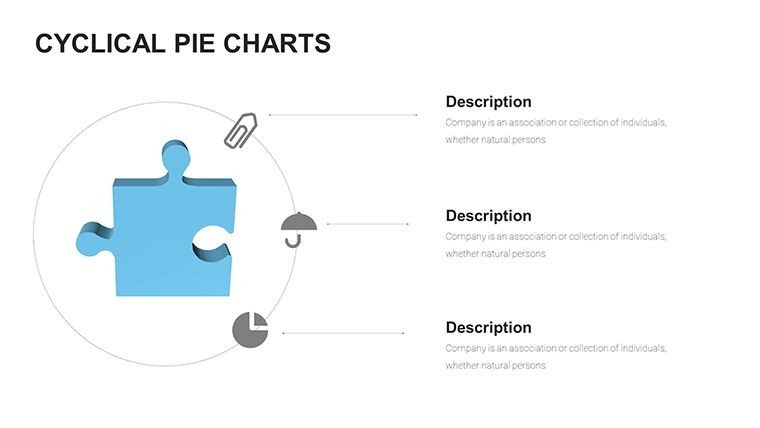
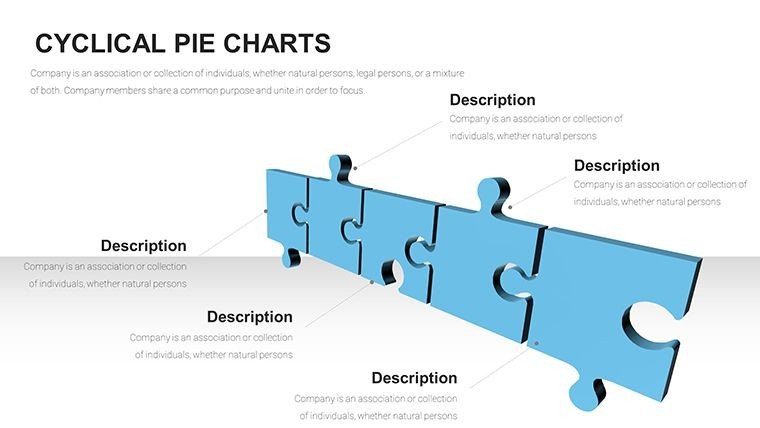
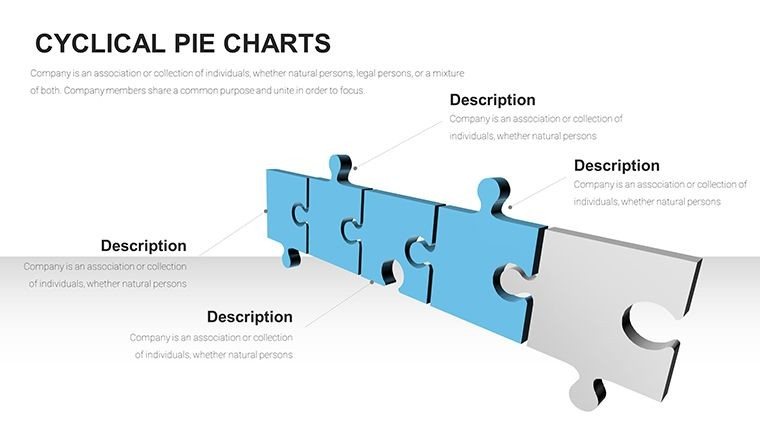
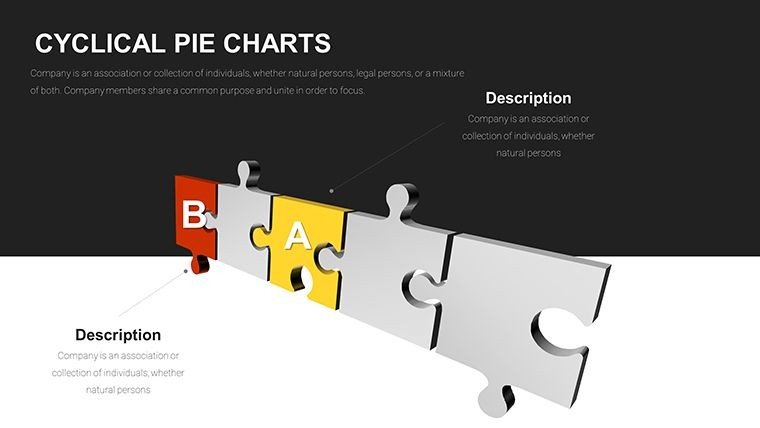
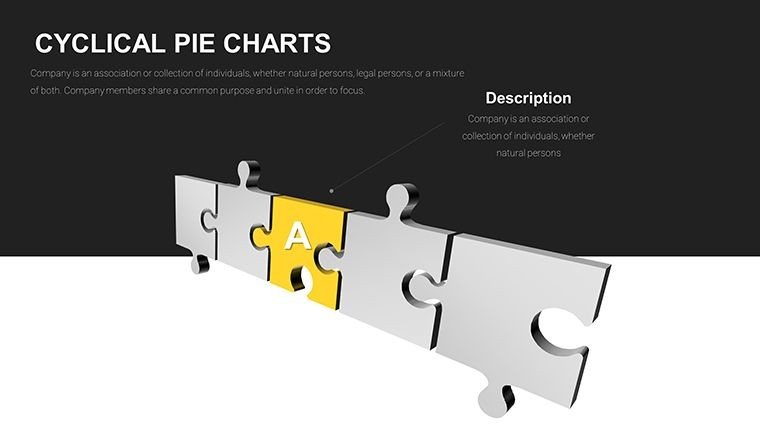
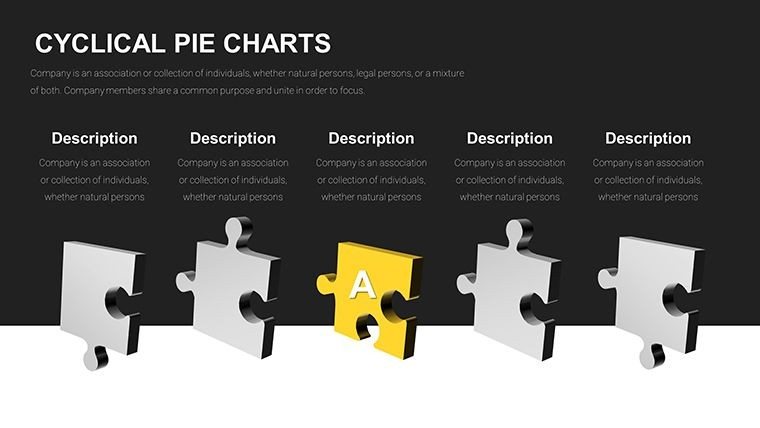
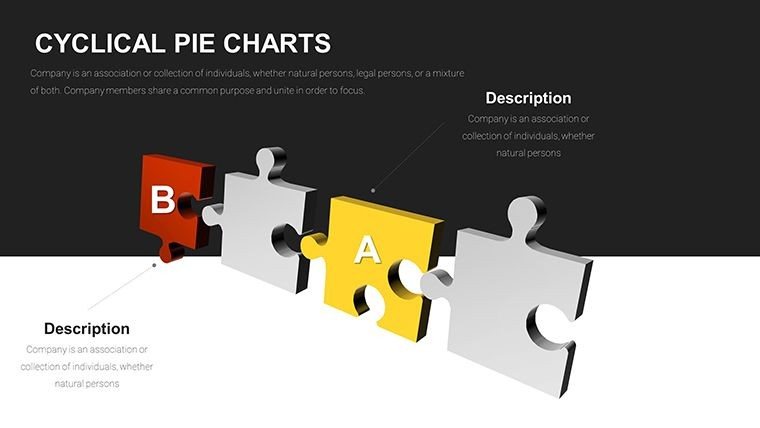
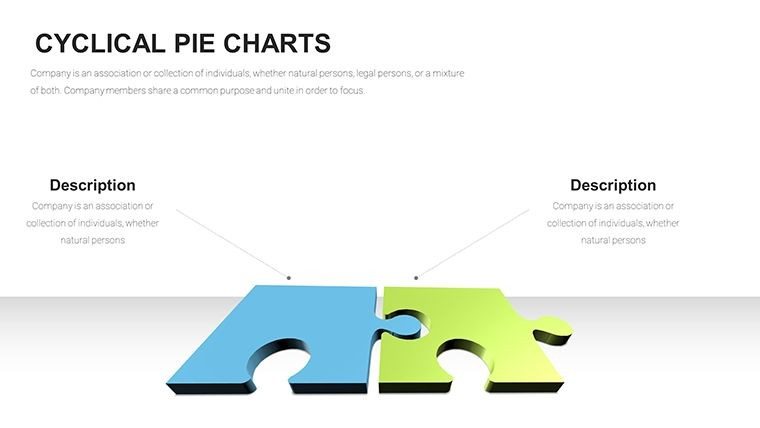
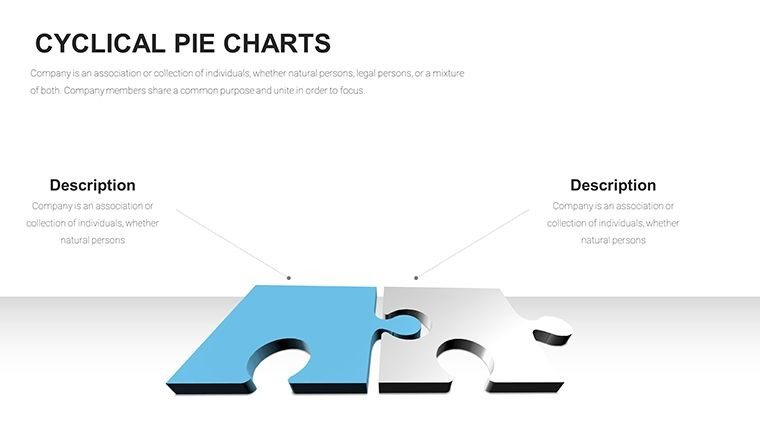
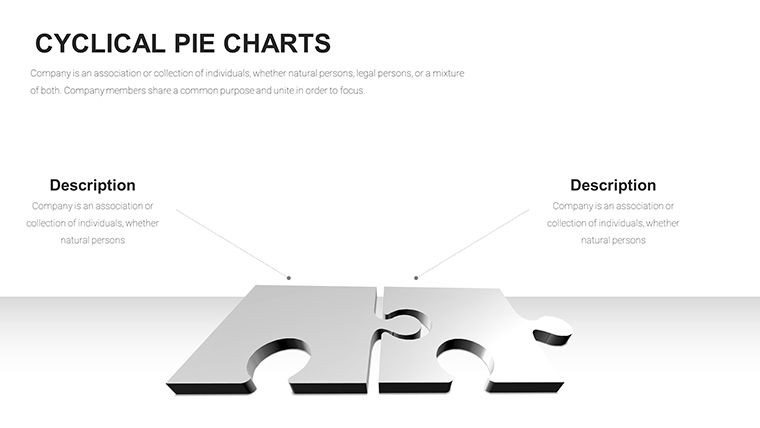
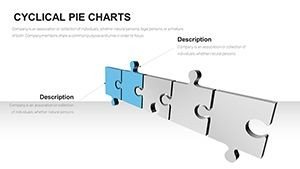
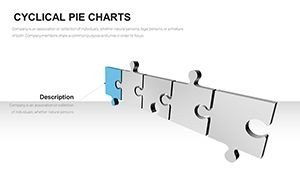
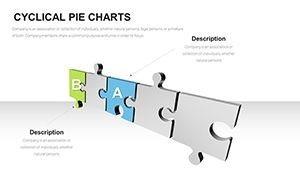
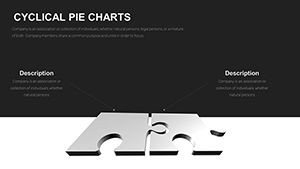
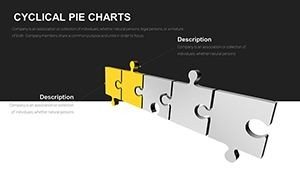
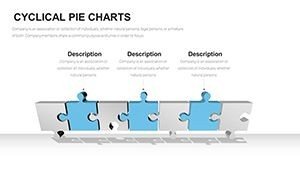
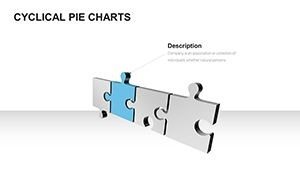
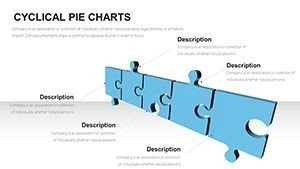
- Single interlocking clusters: Perfect for showing core teams or primary revenue streams coming together, with room for labels on each piece and central hubs for key metrics.
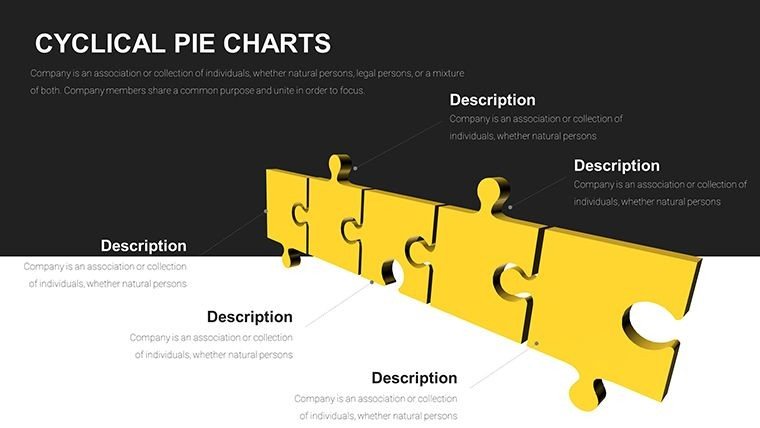
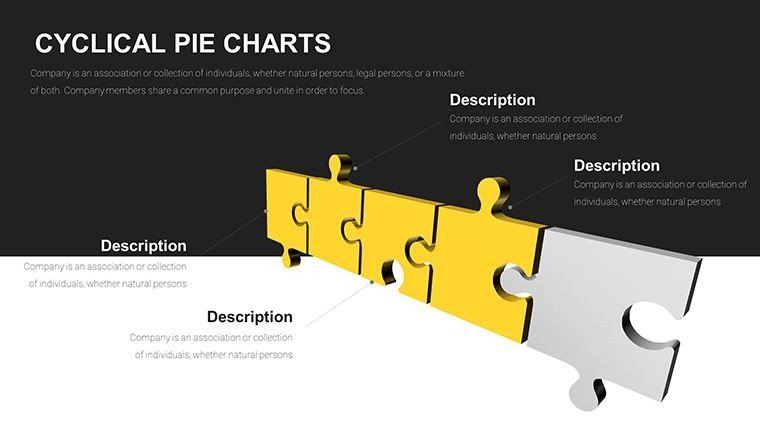
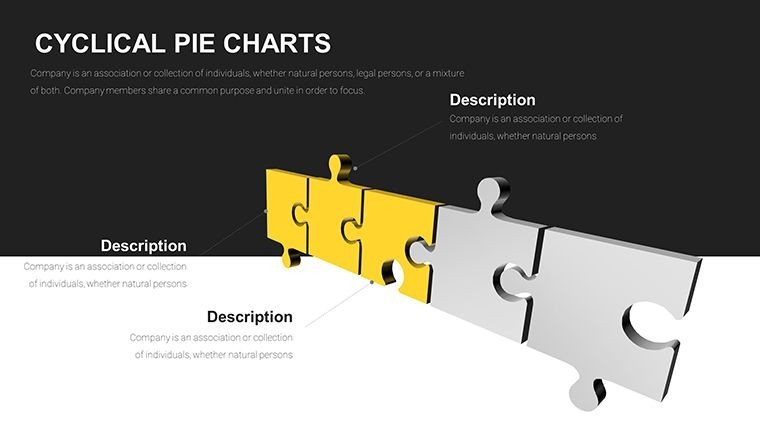
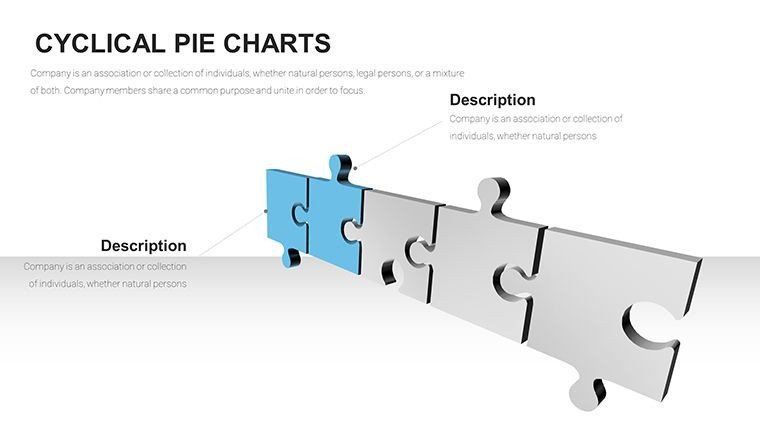
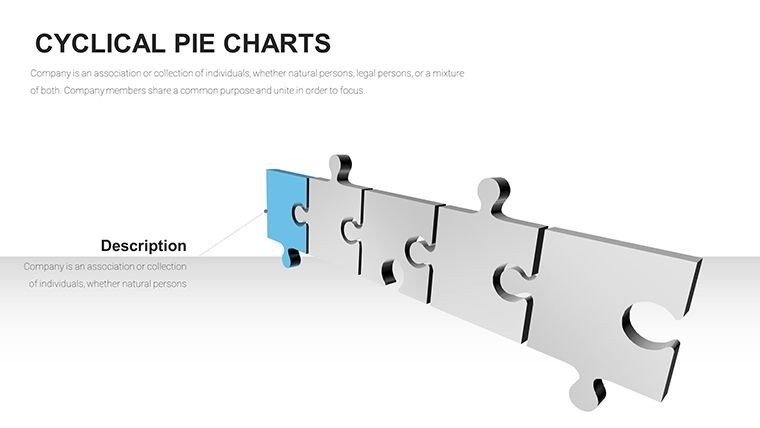
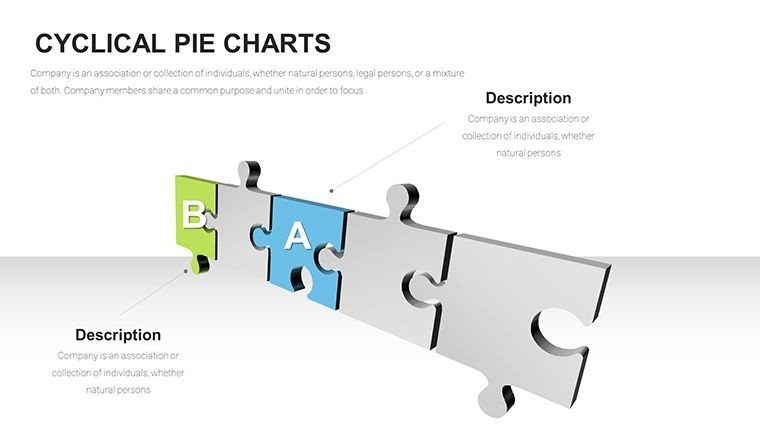
- Multi-layer assemblies: Build progressive views where initial pieces form foundations and additional layers represent growth phases or added capabilities.
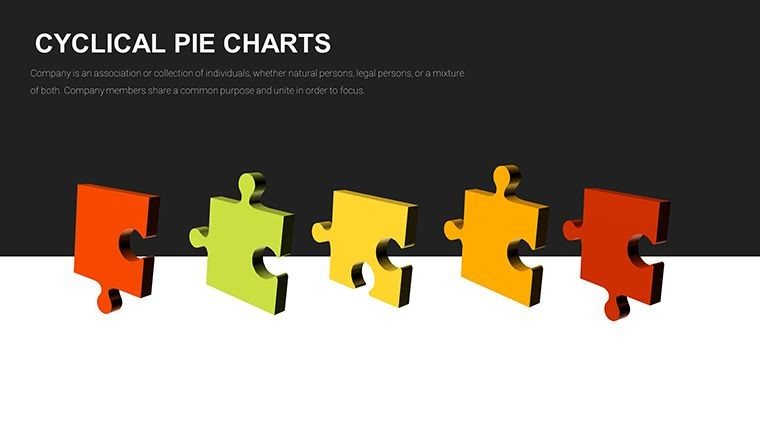
- Scattered to complete transitions: Animate the puzzle coming together to depict integration roadmaps or problem-solving sequences.
- Circular and grid arrangements: Arrange pieces in patterns that emphasize cycles, ecosystems, or matrix structures common in enterprise planning.
Every slide features high-resolution 3D renders with subtle shadows and bevels for realism. You can easily recolor individual pieces to match brand guidelines, adjust sizes for emphasis, or add text overlays for specific data points.
Strategic Applications for Executive and Team Presentations
During quarterly business reviews for multinational clients, I've used similar 3D puzzle visuals to map out how regional operations interlink with global supply chains, making it clear where bottlenecks exist.
In investor pitch decks, these charts effectively demonstrate how product features, market positioning, and go-to-market tactics form a cohesive strategy that drives valuation.
For internal training sessions with government agencies, the puzzle metaphor helps illustrate policy components fitting into broader regulatory frameworks, ensuring alignment across departments.
Enterprise teams preparing for digital transformation initiatives find these layouts invaluable for visualizing how legacy systems, new technologies, and process changes must interconnect seamlessly.
Seamless Integration into Your Existing Workflow
This 3D puzzle PowerPoint charts template drops right into your standard preparation process. Open in PowerPoint 2016 or later, and you'll find all elements fully vector-based for crisp scaling on any screen size.
While primarily optimized for PowerPoint, the clean structure allows straightforward import into Keynote or Google Slides for collaborative teams.
Customization takes minutes - swap colors via theme settings, duplicate pieces for larger puzzles, or incorporate your data directly into placeholders. This saves precious hours when deadlines loom, letting you focus on refining the narrative rather than wrestling with design tools.
With a one-time download, you gain lifetime access to these 45 slides for unlimited projects across your organization.
Real-World Scenarios from Client Decks I've Built
A tech startup founder used interlocking puzzle clusters to show investors how engineering, sales, and customer success teams align around product roadmap milestones, securing Series B funding.
In a healthcare consulting project, we depicted compliance requirements, clinical protocols, and reimbursement models as fitting puzzle pieces to highlight integration challenges for hospital administrators.
Educators delivering leadership workshops have assembled progressive puzzles to walk participants through organizational change models, making theoretical concepts immediately relatable.
Financial analysts presenting portfolio diversification strategies arranged puzzle grids to illustrate how asset classes interconnect to mitigate risk during market volatility discussions.
How This Template Stacks Up Against Common Alternatives
| Aspect | Default PowerPoint Tools | Building Puzzle Charts from Scratch | This 3D Puzzle Template |
|---|---|---|---|
| Visual Depth and Engagement | Basic 2D shapes lacking realism | Time-intensive 3D modeling required | Professional 3D renders with natural shadows |
| Number of Ready Layouts | Limited to simple connectors | Unlimited but hours per slide | 45 pre-built editable variations |
| Customization Speed | Quick but generic results | Slow with inconsistent quality | Minutes to brand and populate |
| Interlocking Accuracy | Manual alignment prone to errors | Precise but expert skills needed | Perfectly fitted pieces every time |
Industry-Specific Ways to Deploy 3D Puzzle Charts
In finance, map how risk factors, investment vehicles, and regulatory requirements interlock within portfolio construction.
Technology teams visualize microservices architecture, showing how APIs and databases connect to form robust applications.
Healthcare professionals illustrate patient journey touchpoints, from diagnosis through treatment and follow-up care coordination.
Educational institutions depict curriculum modules fitting together to build comprehensive learning pathways.
Marketing departments show campaign elements - content, channels, and analytics - assembling into unified customer experiences.
Consultants delivering strategy roadmaps use progressive assembly to outline phased implementations across client organizations.
Ready to bring dimensional clarity to your next interconnected data story? Download the 3D Puzzle PowerPoint Charts Template today and start assembling presentations that truly connect with your audience.
Frequently Asked Questions
How many different puzzle configurations are included?
The template provides 45 distinct slides, ranging from simple 4-piece clusters to complex multi-layer assemblies with up to 20 interlocking elements, giving you flexibility for everything from quick overviews to detailed breakdowns.
Can I animate the puzzle pieces coming together?
Yes, each slide supports PowerPoint's built-in animations. Apply entrance effects sequentially to individual pieces for a dynamic build-up that emphasizes how components integrate step by step.
Is this template suitable for Google Slides or Keynote?
While native in .pptx format for optimal PowerPoint performance, the vector elements transfer well when imported into Google Slides or Keynote, maintaining editability for cross-platform teams.
How do I change colors to match my company branding?
Select any puzzle piece or group, then use PowerPoint's shape fill options to apply exact hex codes. For global changes, modify the slide master or theme colors to update all pieces simultaneously.
Are the 3D effects editable or just flat images?
The puzzle pieces are fully vector-based 3D renders, allowing rotation, resizing, and recoloring without quality loss, unlike inserted images that limit flexibility.
What types of data work best with these puzzle charts?
They're ideal for interdependent relationships - think strategic initiatives linking to outcomes, team roles supporting objectives, or process steps building on each other - anywhere you need to show how separate elements form a complete whole.