42-Slide Building Blocks PowerPoint Chart Template - Instant Download for Investor Presentations


Building block PowerPoint charts give your presentation the visual structure that keeps investors and executives engaged. With 42 editable slides, this template delivers enough variety for comprehensive decks - quarterly business reviews, strategic planning sessions, product roadmaps - while maintaining the consistent "assembly" metaphor that makes complex information approachable. I've built countless investor decks where the difference between funding and rejection came down to clarity, not just numbers.
These charts work because stakeholders think in building blocks naturally. When presenting market entry strategy, show geographic expansion as sequential blocks. When pitching SaaS revenue models, stack recurring revenue blocks by customer segment. The visual language is intuitive - everyone understands foundations, layers, and modular construction without needing a legend.
Complete Slide Breakdown: 42 Chart Variations
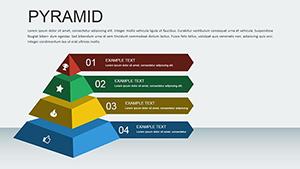
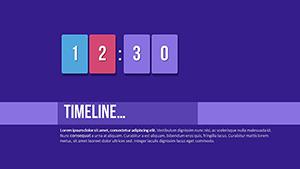
You get pyramid structures for hierarchy visualization, puzzle configurations for interconnected strategies, cube arrangements for option comparison, and timeline sequences for phased rollouts. Every slide is a native .pptx file with unlocked shapes - no image restrictions, no proprietary software required. Change colors to match investor deck templates, resize blocks to emphasize key metrics, duplicate slides for similar workflows.
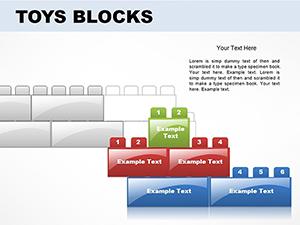
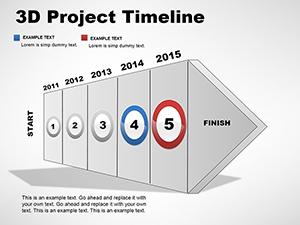
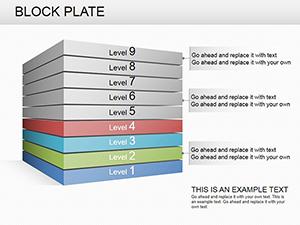
Specific examples: Slide 8 shows a 5-level pyramid perfect for market segmentation analysis. Slide 15 offers interconnected puzzle pieces ideal for partnership ecosystem diagrams. Slide 23 provides horizontal block progression for product development timelines. Slide 34 delivers vertical stacks for organizational reporting structures. The variety means you're not forcing one chart type across different data scenarios.
When to Deploy Block-Based Visuals
Use these charts when presenting conceptual frameworks, strategic roadmaps, or process architectures. A venture capital pitch showing how you'll build market share across three years benefits from sequential block additions - Q1 foundation, Q2 expansion, Q3 scale. A board presentation explaining new organizational structure uses stacked blocks to show reporting hierarchy.
When NOT to use: Financial deep-dives requiring precise trend lines, scientific presentations needing detailed data plots, minimalist pitches where simple text slides maintain focus. Block charts excel at big-picture strategy, not granular analytics. If you're presenting quarterly revenue variance to the penny, traditional column charts serve better.
Professional Editing Across Platforms
Download the .pptx file and open in PowerPoint 2016 or newer (Windows or Mac). Every block is a standard PowerPoint shape object - right-click any element, select Format Shape, and access full customization: gradient fills, custom borders, shadow effects, 3D rotation. Insert text boxes directly onto blocks for data labels. Use PowerPoint's built-in color picker to match exact brand Pantone values.
Cross-platform workflow: Customize slides in desktop PowerPoint where formatting tools are most robust. Upload completed deck to Google Drive, open in Google Slides for cloud collaboration with remote teams - formatting transfers cleanly because the template uses standard shape libraries. Export to Keynote on Mac for client presentations - most visual properties survive the conversion, though verify complex shadows and gradients render correctly.
Real-World Application Scenarios
Investor pitch: Series A fundraising deck explaining go-to-market strategy. Use ascending block pyramid to show customer acquisition - base layer is product-market fit, middle layers are channel expansion, top is brand leadership. Investors see strategic progression, not just hockey-stick projections.
Board strategy session: Annual planning presentation to board of directors. Deploy interconnected puzzle blocks showing how three business units must collaborate - sales, product, customer success - with overlapping sections representing shared KPIs. Board members visualize integration requirements immediately.
Executive workshop: Leadership team aligning on digital transformation priorities. Use the priority pyramid slide as interactive framework - leaders vote on which initiatives earn foundation placement vs. nice-to-have top tier. The chart becomes a decision tool, not just a display.
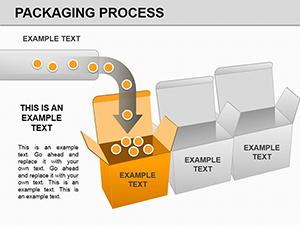
Client proposal: Agency pitching integrated marketing campaign. Show timeline with sequential block builds - month 1 content foundation, month 2 adds social amplification blocks, month 3 completes with performance analytics layer. Client sees deliberate phasing, not scattered tactics.
Chart Type Selection Matrix
| Chart Configuration | Primary Use Case | Ideal Audience | Expected Outcome |
|---|---|---|---|
| 5-Tier Pyramid | Priority frameworks, needs hierarchy | C-suite, board members | Strategic alignment on resource allocation |
| Puzzle Interconnections | Partnership ecosystems, team dependencies | Operations, cross-functional teams | Workflow coordination clarity |
| Horizontal Sequences | Timelines, product roadmaps | Product teams, investors | Milestone tracking and accountability |
| Stacked Cubes | Budget components, resource distribution | Finance, executive leadership | Spending transparency and justification |
| Modular Grids | Capability matrices, feature comparisons | Sales, strategic planning | Competitive differentiation |
Industry-Specific Applications
Technology startups use these for product architecture diagrams - microservices shown as interconnected blocks, API layers as stacked components. Management consulting firms deploy them in capability maturity assessments - clients see current state vs. target state as block gap analysis. Healthcare organizations visualize patient journey stages as sequential care blocks. Real estate developers present project phases with foundation-to-completion block timelines.
The building metaphor works across sectors because growth, assembly, and construction are universal business concepts. If your narrative involves building revenue, constructing partnerships, or assembling capabilities, these charts reinforce that message viscerally.
Customization for Brand Consistency
Professional decks require brand alignment. Click View > Slide Master in PowerPoint to access template-wide formatting. Update color schemes by selecting Design > Colors > Customize Colors - map your corporate palette to template defaults. Change fonts via Home > Replace Fonts for global updates. Insert company logo on slide master so it appears on all 42 slides automatically.
For investor decks, match the existing pitch deck theme precisely. If your standard deck uses sans-serif fonts and flat colors, apply those to block charts before integrating. Consistency builds credibility - investors notice when slide 12's chart looks like it came from a different presentation.
Download now and access 42 professional building block charts that transform strategic concepts into visual clarity stakeholders actually understand.
Frequently Asked Questions
How do I choose which of the 42 slides to use in my presentation?
Start by mapping your content structure. If you're explaining hierarchical priorities, filter for pyramid slides. Showing process dependencies? Look at puzzle interconnection layouts. For timelines, use horizontal sequence blocks. Most decks use 3-5 different chart types maximum to maintain visual consistency - select charts that reinforce your narrative metaphor. For a product roadmap, stick with sequential builds; for organizational strategy, focus on pyramids and stacks. Avoid chart variety for its own sake - repetition of similar chart types actually strengthens audience comprehension.
Can I customize individual blocks within each chart independently?
Yes, every block is an individual PowerPoint shape object. Click once to select the entire chart group, click again to select specific blocks. Right-click and choose Format Shape to change that block's fill color, border, size, or position independently. This lets you emphasize key data points - make your most important metric a bold color while keeping supporting blocks muted. You can also delete unnecessary blocks if your data has fewer components than the template provides, or duplicate and rearrange blocks to expand the chart.
Will these block charts look too informal for serious investor presentations?
Block charts work in investor decks when executed professionally. I've used similar layouts in Series B fundraising presentations where institutional investors appreciated the strategic clarity. The key is context and quality: use your standard pitch deck color scheme, keep labeling professional and data-focused, and deploy blocks only where the building metaphor adds strategic insight. Skip them for detailed financial projections where traditional charts set expectations, but leverage them for market positioning, competitive moats, or go-to-market architecture where conceptual frameworks matter. Professional design execution - not clip-art styling - makes the difference.
How do I combine these slides with my existing PowerPoint investor deck?
Open your current investor deck in PowerPoint. File > Open the downloaded .pptx template as a second window. Navigate to slides you want to import, select them (Ctrl+click for multiples), right-click > Copy. Switch back to your investor deck window and Paste. PowerPoint imports with formatting intact. Then right-click the imported slides > Format Background > Apply theme colors from your main deck to ensure consistency. Use the Format Painter tool (Home tab) to copy text formatting from existing slides to new block chart slides for unified typography.
Do these charts animate well for pitch presentations?
Yes, block-based layouts animate effectively for progressive disclosure. In PowerPoint, select the entire chart, go to Animations tab, and apply entrance effects like Fade or Wipe to individual blocks. Set animations to "On Click" so you control pacing during investor Q&A - reveal foundation blocks first, then build upward as you explain strategy layers. For puzzle charts, animate pieces to appear sequentially showing how partnerships interconnect. Avoid overly elaborate animations (spinning, bouncing) that undermine professional credibility. Subtle fade-ins with 0.5-second duration maintain executive presentation standards while adding visual interest.
Can I use these charts in Google Slides for remote investor meetings?
Yes, upload the .pptx file to Google Drive and open with Google Slides for cloud-based presenting. Most formatting transfers successfully - standard shapes, colors, and text convert cleanly. After conversion, verify alignment and spacing on master slides, as Google Slides' rendering engine occasionally shifts elements slightly. Test animations if you've added them, since Google Slides supports fewer animation options than PowerPoint. For critical investor pitches, rehearse in Google Slides presenter view at least once to catch any conversion issues before the live meeting. The cloud benefit - multiple team members can edit simultaneously and you can present from any device with internet access.