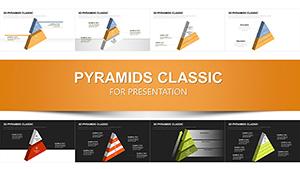
Triangle Pyramid Chart Template PowerPoint Download


Type: PowerPoint Charts template
Category: Pyramids
Sources Available: .pptx
Product ID: PC01097
Template incl.: 28 editable slides
When you need to show progressive stages in a product development roadmap or explain how foundational work supports high-level outcomes, standard bullet lists fall flat. Triangle pyramid charts deliver instant visual logic: narrow apex for strategic vision, widening base for operational execution. This 28-slide collection gives you clean, editable pyramid structures specifically designed for business presentations where hierarchy, dependency, or sequential progression matters.
I've used these layouts in dozens of transformation projects with mid-market manufacturing clients and SaaS leadership teams. The triangle format solves a persistent boardroom challenge - showing how tactical initiatives connect to strategic objectives without creating flowchart chaos. Finance directors use them for budget allocation presentations, showing how operating expenses funnel toward revenue targets. HR teams deploy them in talent development decks, illustrating career progression from entry-level roles to C-suite positions.
Each slide in this template offers fully customizable pyramid structures with three to seven segmented levels. You control color schemes, text placement, and icon integration. Compatible with PowerPoint 2016 and later versions, plus Keynote and Google Slides through standard import. Download once, use indefinitely across unlimited projects - no recurring fees or attribution requirements.
Anatomy of Each Pyramid Slide: What You're Actually Getting
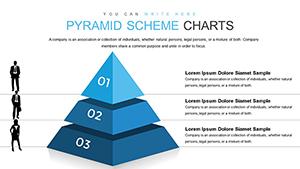
This collection delivers 28 distinct pyramid configurations, not variations of the same basic shape. You'll find three-tier pyramids ideal for simple strategic frameworks, four-tier structures for operational planning, and expansive seven-level designs when you need granular detail in process documentation.
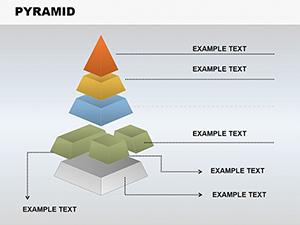
Slide one through seven feature classic stacked pyramid designs with horizontal segmentation. Each tier includes dedicated text placeholder boxes positioned either inside the pyramid segments or along the right margin with connecting leader lines. The internal text zones work brilliantly when you're presenting to smaller groups where screen proximity allows detailed reading. External text placement shines in large conference rooms or webinar formats where readability at distance becomes critical.
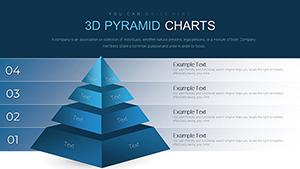
Slides eight through fourteen introduce 3D perspective pyramids with depth shading and dimensional rendering. These elevated designs add visual sophistication to investor presentations and executive briefings where aesthetic polish matters as much as information clarity. The 3D effect creates natural emphasis on upper tiers, drawing audience attention to strategic priorities while still acknowledging foundational elements.
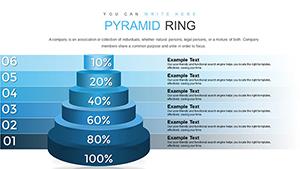
Slides fifteen through twenty-one present inverted pyramid structures - widest section at top, narrowing toward bottom. I've deployed these layouts in risk management presentations showing how broad market uncertainties funnel down to specific operational vulnerabilities. They're equally effective for filtering processes, demonstrating how extensive initial data sets get refined into actionable insights through successive analysis stages.
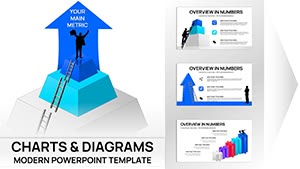
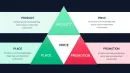
The final seven slides offer pyramid hybrids: triangles integrated with circular elements, cube-based foundations, or ribbon wraps around traditional pyramid forms. These specialty designs serve niche presentation needs - product lifecycle stages, customer journey mapping, or quality assurance frameworks where standard pyramids feel too rigid.
Where Corporate Teams Deploy These Pyramid Structures Daily
Marketing directors at enterprise software companies use triangle pyramids for demand generation strategy decks. The pyramid base represents broad awareness campaigns across digital channels, middle tiers show lead nurturing through email sequences and content offers, and the apex captures qualified opportunities ready for sales handoff. Board members grasp the funnel logic instantly without requiring verbal explanation.
Operations managers in manufacturing plants apply these charts to quality control presentations. Foundation level details raw material inspection protocols, subsequent tiers outline assembly line checkpoints, middle sections address packaging standards, and the pyramid peak represents final product certification. The visual progression reinforces how quality failures at any level compromise everything above.
Healthcare administrators use pyramid layouts in accreditation presentations for regulatory bodies. Base sections document compliance infrastructure - policies, training records, audit trails. Middle tiers showcase clinical protocols and patient safety measures. The apex highlights outcome metrics and continuous improvement initiatives. Surveyors can trace how foundational documentation supports superior patient care results.
Financial services teams building pitch decks for institutional investors deploy pyramids to illustrate portfolio construction strategies. Broad base represents diversified asset allocation across equities, fixed income, and alternatives. Middle sections detail sector weighting and risk-adjusted return targets. The apex shows concentrated positions in high-conviction opportunities. The geometry itself communicates prudent risk management - stable foundation supporting strategic upside exposure.
Integration Into Your Existing Presentation Workflow
Download the PPTX file and extract it to your presentations folder. Open the file in PowerPoint - every pyramid element appears as grouped shapes, not static images. Click any pyramid segment to access individual shape formatting. Change fill colors through standard PowerPoint color picker, matching your corporate brand guidelines precisely.
Text editing works like any native PowerPoint text box. Click placeholder text, delete the sample content, and type your actual information. The text automatically centers within each pyramid tier by default, but you can adjust alignment through Home tab paragraph controls if left or right justification better serves your layout needs.
Resizing maintains proportional pyramid geometry thanks to grouped shape architecture. Select the entire pyramid structure, grab a corner handle, and scale up or down while holding Shift. The pyramid expands or contracts uniformly without distorting segment relationships or creating awkward spacing issues.
Copy any pyramid slide into your existing presentation deck through standard copy-paste commands. The shapes transfer cleanly with all formatting intact. For maximum efficiency, open the template file alongside your active presentation, identify the pyramid layout that matches your content needs, select everything on that slide except the background, copy, then paste into your target deck. Total time investment: under thirty seconds per slide.
Color customization happens at group or individual level depending on your needs. Recolor entire pyramids by selecting the full shape group and applying new theme colors. For gradient effects or segment-specific colors, ungroup the pyramid, select individual tiers, and apply unique formatting to each level. This flexibility accommodates both quick edits during deadline pressure and detailed customization for high-stakes presentations.
Real Presentation Scenarios Where Pyramid Charts Solve Communication Problems
A chief revenue officer building the annual go-to-market plan needs to show how field sales, inside sales, channel partners, and digital self-service all contribute to revenue targets. She uses a four-tier pyramid with dollar values assigned to each level, demonstrating how foundational high-volume low-touch channels support strategic enterprise deal pursuit at the apex. The board immediately understands resource allocation rationale without wading through budget spreadsheets.
An instructional designer creating compliance training for a pharmaceutical company must explain tiered response protocols for adverse event reporting. A five-level pyramid shows immediate actions at the base, escalation procedures in middle tiers, and executive notification requirements at the peak. Trainees grasp the hierarchy instantly, reducing confusion during actual adverse events when decision speed matters most.
A management consultant presenting organizational redesign recommendations faces skeptical middle managers worried about reporting structure changes. He uses inverted pyramid charts to illustrate how decision-making authority flows from frontline teams upward to senior leadership, visually reinforcing the empowerment message. The format itself communicates respect for operational expertise rather than top-down decree.
A cybersecurity analyst preparing a board presentation on defense-in-depth strategy deploys pyramid layouts to show layered security controls. Network perimeter defenses form the base, application security occupies middle tiers, and data encryption sits at the apex. Board members lacking technical backgrounds see how multiple defensive layers protect critical assets even if individual controls fail.
A product manager launching a SaaS platform roadmap presentation faces C-suite questions about development priorities. She uses a pyramid to show how infrastructure work and API development at the base enable mid-tier feature releases, which support strategic enterprise capabilities at the apex. The visual logic justifies why the team must complete foundational work before delivering marquee features executives want immediately.
Pyramid Template Performance Versus Standard Alternatives
| Evaluation Factor | This Template Collection | PowerPoint SmartArt Pyramids | Building From Scratch |
|---|---|---|---|
| Initial Setup Time | Under 2 minutes per slide | 5-8 minutes including text formatting | 15-25 minutes for basic pyramid |
| Design Variety | 28 distinct layouts included | 6 basic pyramid types | Limited by personal design skill |
| Customization Control | Full access to individual shape properties | Restricted to SmartArt formatting options | Complete control but time-intensive |
| 3D Visual Options | Multiple 3D pyramids with professional shading | Basic 3D effects available | Requires advanced PowerPoint skills |
| Text Placement Flexibility | Internal and external text options pre-configured | Limited to SmartArt text panes | Manual positioning required |
| Specialty Pyramid Types | Inverted pyramids, cube hybrids, ribbon wraps included | Standard upward pyramids only | Depends on design expertise |
| Brand Color Integration | Quick recoloring through standard PowerPoint tools | Works with theme colors | Full control once built |
| Learning Curve | Immediate use, standard PowerPoint editing | Requires SmartArt interface familiarity | Steep for shape manipulation novices |
Cross-Industry Applications for Triangle Pyramid Frameworks
Technology Sector: Software development teams use pyramid structures for technical architecture documentation, showing how infrastructure layers support application services and user interfaces. DevOps engineers present continuous integration pipelines as pyramids, with code commits at the base flowing through automated testing, staging environments, and production deployment at the apex. Product teams illustrate feature prioritization frameworks using pyramid tiers to separate must-have core functionality from nice-to-have enhancements.
Healthcare Systems: Hospital administrators present care delivery models as pyramids, with population health management forming the broad base, primary care in middle tiers, and specialized services at the apex. Nursing leadership uses pyramids for competency progression frameworks, showing how foundational clinical skills support advanced practice capabilities. Medical educators structure curriculum presentations as pyramids, building from basic sciences through clinical rotations to residency specializations.
Financial Services: Wealth advisors use pyramid charts for client education on portfolio construction, demonstrating appropriate asset allocation for different risk profiles. Compliance officers present regulatory framework hierarchies, showing how federal regulations cascade through state requirements down to firm-specific policies. Credit analysts structure lending criteria presentations as pyramids, with broad initial screening at the base narrowing to final underwriting decisions.
Education Administration: University provosts present academic program development as pyramids, showing how general education requirements form the base supporting major coursework and culminating experiences at the apex. Professional development coordinators structure teacher training frameworks as progressive pyramids, moving from classroom management fundamentals through pedagogical strategies to leadership development. K-12 superintendents use pyramids for literacy initiative presentations, illustrating how foundational phonics instruction supports reading comprehension and critical analysis skills.
Manufacturing Operations: Plant managers structure continuous improvement presentations around pyramid charts, with lean fundamentals at the base supporting Six Sigma methodologies and total productive maintenance at higher tiers. Supply chain directors present supplier management frameworks as pyramids, showing how broad supplier bases narrow through qualification tiers to strategic partnerships. Quality directors use pyramids for root cause analysis presentations, demonstrating how specific defects trace back through process steps to fundamental system gaps.
Professional Services: Management consultants structure diagnostic frameworks as pyramids for client presentations, with broad data collection at the base narrowing through analysis tiers to strategic recommendations. Law firms use pyramids to present case strategy, showing how evidence collection and legal research support arguments and trial strategy. Accounting firms deploy pyramid structures for audit methodology presentations, illustrating how detailed transaction testing rolls up through financial statement validation to opinion formation.
Making Strategic Content Decisions With Pyramid Geometry
The visual weight of pyramid structures carries inherent communication implications beyond simple information display. Audiences unconsciously interpret pyramid base as foundation, middle tiers as progression, and apex as destination or goal. Your content placement decisions should leverage these built-in associations rather than fight against them.
Place stable, enduring, or high-volume elements in pyramid base sections. These might include core competencies, established infrastructure, broad customer segments, or fundamental principles. The geometry itself suggests these elements support everything else, so audiences expect foundational characteristics in lower tiers.
Assign middle pyramid sections to transitional elements, progressive stages, or qualitative improvements building on the foundation. This is where process maturity models shine, showing how organizations move from basic capabilities through intermediate development toward advanced performance. Middle tiers naturally suggest journey rather than starting point or final destination.
Reserve pyramid apex for strategic priorities, ultimate outcomes, or concentrated focus areas. This positioning leverages the natural eye movement pattern as audiences scan pyramid charts from bottom to top. The narrow apex visually reinforces scarcity, selectivity, or strategic importance - exactly what you want to communicate about priorities, goals, or elite performance tiers.
For inverted pyramids, these associations reverse. Wide top sections now suggest broad inputs, extensive initial options, or comprehensive starting conditions. The narrowing toward bottom communicates filtering, refinement, or focused outcomes. I've used inverted pyramids effectively when presenting how organizations distill vast market data into specific strategic decisions, or how broad talent pools narrow through successive screening to final hires.
Start building presentations that communicate hierarchy, progression, and strategic logic with visual clarity your audience grasps in seconds. Download this template collection and customize pyramid structures to match your specific business context, whether you're presenting to boards, training staff, or pitching clients.
Frequently Asked Questions
Can I change the number of pyramid tiers in these templates?
Yes, through shape editing you can add or remove pyramid segments. Select the pyramid structure, ungroup it to access individual tier shapes, then delete unnecessary segments or duplicate existing ones to add levels. After making changes, regroup all shapes to maintain easy positioning and resizing. Most presenters find the included tier variations cover their needs without modification, but PowerPoint's native shape tools give you full flexibility when custom tier counts matter for your specific content requirements.
Do these pyramid charts work for process flows or only hierarchical structures?
Triangle pyramids excel at both applications. Hierarchical uses are most common - organizational structures, priority frameworks, skill progression models. However, process flows work equally well when your process involves progressive refinement, filtering, or building complexity. Marketing funnels, quality assurance workflows, and product development stages all translate effectively to pyramid formats. The key consideration is whether your process logically moves from broad to narrow or simple to complex. If yes, pyramid geometry reinforces your narrative.
What's the fastest way to match these pyramids to corporate brand colors?
Select the entire pyramid shape group, right-click, and choose Format Shape. In the Format Shape panel, click the paint bucket icon, select Solid Fill, then choose your brand color from the color picker. For gradient effects matching brand guidelines, select Gradient Fill instead and customize gradient stops with your specific brand palette. To recolor multiple pyramids consistently across slides, make changes to the first pyramid, copy the formatting using Format Painter, then apply to remaining pyramid structures. Total time for brand-matching an entire 28-slide deck: under five minutes.
Can I combine multiple pyramid layouts on a single slide?
Absolutely, and this creates powerful comparative presentations. Copy pyramids from different template slides and paste them side-by-side on a new slide. This works brilliantly for before-and-after scenarios, competitive comparisons, or showing how different departments approach similar challenges with distinct frameworks. Resize each pyramid smaller to fit multiple structures on screen. I've used three pyramids across a single slide to compare product lines, regional strategies, or maturity models simultaneously, giving executives direct visual comparison without flipping between slides.
Are these pyramid templates compatible with widescreen 16:9 presentation formats?
The template uses standard PowerPoint slide dimensions and adapts automatically when you change your presentation's aspect ratio. If you're working in widescreen 16:9 format, simply open the template, go to Design tab, click Slide Size, and select Widescreen. PowerPoint will reflow all pyramid elements to fit the new dimensions. You might need minor adjustments to text sizing or positioning after the conversion, but the pyramid structures themselves scale cleanly without distortion or quality loss.
How do these compare to using PowerPoint's built-in SmartArt pyramid tools?
SmartArt pyramids offer quick creation but limited design variety and restrictive formatting constraints. These templates provide professionally designed pyramid structures with sophisticated visual treatments - 3D effects, color gradients, specialty layouts - that SmartArt cannot easily replicate. More importantly, these pyramids are standard PowerPoint shapes, giving you complete control over every visual element without fighting SmartArt's automatic formatting rules. For quick internal drafts, SmartArt works fine. For client presentations, board meetings, or any high-stakes communication, these templates deliver polish and flexibility SmartArt cannot match.