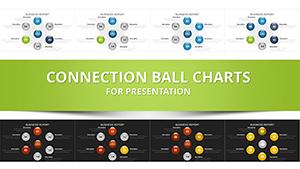
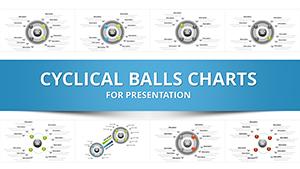
Connected Balls Chart Template for PowerPoint - 26 Slides

Type: PowerPoint Charts template
Category: Cycle, Relationship, Pie
Sources Available: .pptx
Product ID: PC01084
Template incl.: 26 editable slides
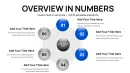
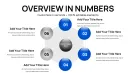
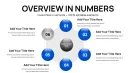
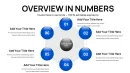
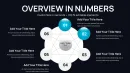
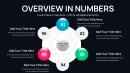
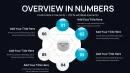
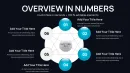
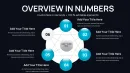
From my years crafting presentations for startup founders and government agencies, I've seen how hard it is to convey networked ideas without losing the thread. This connected balls chart template changes that with spherical hubs joined by adaptable pathways, creating coherent visuals that guide viewers through data mazes. Boasting 26 editable slides, it empowers quick adaptations for tight deadlines.
It's a go-to for illustrating operational ties in strategy sessions or conceptual frameworks in workshops, drawing on design principles that enhance comprehension and recall in high-stakes environments.
Detailed Examination of Slide Categories
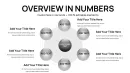
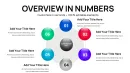
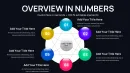
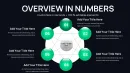
Organized for efficiency, the first six slides present foundational loop diagrams using balls to symbolize stages in ongoing operations, such as product development phases or training modules, with editable flow indicators.
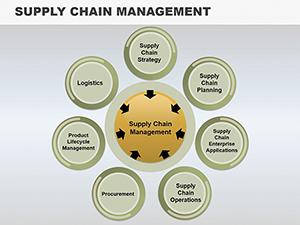
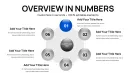
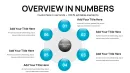
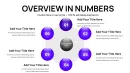
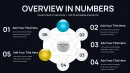
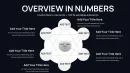
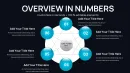
Slides 7 to 16 delve into linkage blueprints, where nodes denote components like supply chain partners, linked by variable paths to show influence or sequence, which I've applied in partner negotiations to clarify mutual benefits.
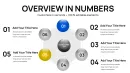
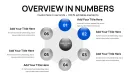
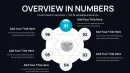
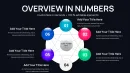
From 17 to 21, embedded segment charts inside balls enable detailed breakdowns, like budget allocations within departmental networks, streamlining multi-level analysis.
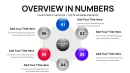
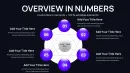
The last five slides offer versatile frameworks with import-ready slots for spreadsheet data and resizable graphics suited for diverse display formats.
How Experts Deploy This Tool
In investor forums, it excels at charting ecosystem dynamics, revealing opportunity clusters. Trainers use it to outline skill progression paths, fostering interactive learning.
Policy makers diagram regulatory interconnections, aiding compliance strategies. Corporate leaders apply it in performance evaluations to trace goal alignments.
Fitting into Established Processes
Compatible with PowerPoint 2016+, Keynote, and Google Slides, it integrates via straightforward data insertion and element adjustments, no steep learning curve.
Based on my routine client revisions, it accelerates iterations, with perpetual licensing for repeated deployments across initiatives.
Actual Deployment Stories
A marketing analyst used it to plot campaign ecosystems, connecting channels to outcomes for optimized budgets. In education, professors map literary themes, linking characters and plots visually.
Consultants in energy sector depict grid connections, from sources to consumers. Entrepreneurs illustrate business model canvases with interconnected value propositions.
Researchers show study variable relationships, enhancing grant proposals with clear dependencies.
Superiority Over Other Options
| Feature | This Template | Built-in Tools | Custom Build | Competing Products |
|---|---|---|---|---|
| Setup Speed | Rapid tweaks | Prolonged configuration | Extended development | Subscription-dependent |
| Adaptability | Vector-based edits | Rigid forms | Full but laborious | Restricted by design |
| Aesthetic Appeal | Refined linkages | Basic connectors | Skill-reliant | Provider-specific |
| Pricing | Single payment | No cost but inefficient | Labor-heavy | Recurring charges |
Grab this template to craft engaging, connected narratives in your presentations.
Tailored for Various Sectors
Finance experts chart risk interconnections among assets. IT teams visualize network topologies, from servers to endpoints.
Medical educators outline disease progression stages. Academics construct argument structures for theses.
Advertisers map funnel stages with touchpoint balls. Advisors develop client portfolio webs.
Frequently Asked Questions
What's the best way to add custom icons to the balls?
Insert from PowerPoint's library or upload your own, resizing to fit within nodes for thematic enhancement without clutter.
Does it support Keynote for Mac users?
Yes, full compatibility ensures smooth transitions and edits across platforms.
How to adjust line thickness for emphasis?
Select the connector and use format options to vary widths, highlighting key relationships effectively.
Can I export these charts to PDF reports?
Easily save as PDF, preserving vector quality for print or digital sharing.
What about collaboration in real-time?
In Google Slides, multiple users can edit simultaneously, ideal for team-based refinements.
Are there animation presets for virtual demos?
Pre-loaded sequences animate paths sequentially, keeping online audiences focused.