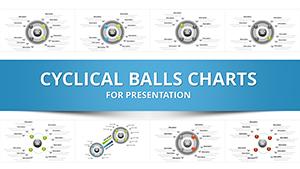
Cyclical Balls Charts Template for PowerPoint - 40 Slides


From my years crafting decks for startup founders and government analysts, I've seen how standard cycle diagrams often fail to capture the fluidity of ongoing processes. This 41-slide Cyclical Balls template changes that by using rounded, interconnected orbs to represent stages in a flowing orbit, making abstract repetitions tangible and engaging. It's tailored for those who regularly present operational rhythms, innovation pipelines, or curriculum sequences, turning potential monotony into captivating visuals.
The strength lies in its extensive slide variety, allowing detailed explorations of multifaceted loops without overcrowding. In investor updates or workshop facilitations, these charts have helped me convey continuity effectively, fostering deeper discussions and quicker alignments.
Drawing from practical design trends in agile methodologies, it elevates your content to professional standards, ensuring every presentation delivers impact.
In-Depth Slide Structure Overview
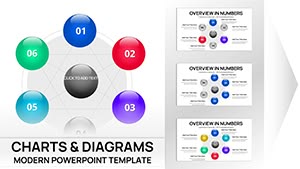
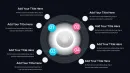
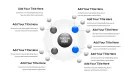
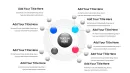
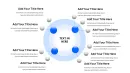
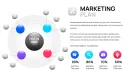
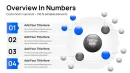
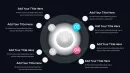
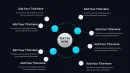
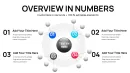
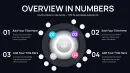
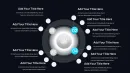
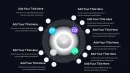
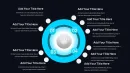
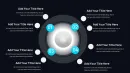
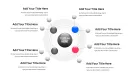
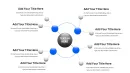
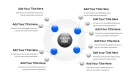
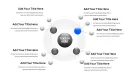
The opening slides feature core orbital setups with 5-8 balls, suited for depicting annual budget cycles where each orb highlights allocation, spending, evaluation, and revision phases. Data entry triggers automatic orbital adjustments, with shading to indicate intensity.
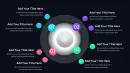
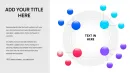
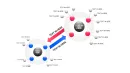
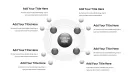
Intermediate sections offer branched configurations, employing linked orbs for illustrating parallel sub-loops, such as department synergies in enterprise planning. Editing is user-friendly: select to modify shapes, hues, or text, preserving high-resolution vectors.
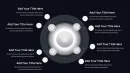
Later slides introduce layered orbits for depth, excellent for showing evolution in product lifecycles, with built-in transitions for orbital movements that simulate real progression.
Key Contexts for Deployment
During quarterly reviews, these visuals map out inventory turnover patterns, enabling managers to identify efficiencies in logistics chains. In pitch sessions, they demonstrate startup growth trajectories, assuring partners of scalable models.
Trainers utilize them to outline skill development paths, making abstract progress concrete for participants. Policy makers apply them in status reports to show regulatory compliance iterations.
Large organizations incorporate them in compliance trainings to visualize audit cycles, promoting adherence across teams.
Fitting into Daily Presentation Routines
Integrate effortlessly - load in PowerPoint 2016+, transfer to Google Slides, or adapt in Keynote. Begin with the instant .pptx download, then fill in your specifics; the orbits realign intuitively.
Efficiency gains are substantial: bypass lengthy manual creations for rapid iterations. Ideal for tight timelines in dynamic industries.
Enhance with your fonts or import graphs from tools like Tableau - designed for seamless professional workflows.
Practical Deck Building Instances
- Advisors diagramming market entry strategies in client briefs, speeding up decision-making.
- Supervisors outlining shift rotations in staff meetings, improving operational clarity.
- Instructors charting historical event sequences in seminars, boosting learner involvement.
- Entrepreneurs modeling funding rounds to boards, strengthening case for investments.
- Researchers plotting experiment phases in papers, clarifying methodological flows.
Evaluating Template Superiority
| Feature | This Template | Stock Keynote | Custom Creation | Other Options |
|---|---|---|---|---|
| Aesthetic Appeal | Orbital fluidity with auto-adjust | Simple arrows only | Variable quality | Frequently rigid |
| Edit Speed | Quick with presets | Moderate effort | Extensive time | Hit-or-miss |
| Audience Engagement | Elevated by motion | Standard levels | Skill-dependent | May not focus on cycles |
| Value for Money | Affordable perpetual access | Included but limited | Labor-intensive | Ongoing fees common |
Tailored Applications by Sector
Finance experts use orbs for loan repayment schedules, aiding client consultations. In tech, they represent code deployment pipelines, facilitating team syncs.
Medical fields apply them to treatment protocols, clarifying steps for staff. Academic settings employ them for thesis structure overviews.
Advertising teams diagram ad campaign phases, refining tactics. Advisors leverage them in sustainability assessments, tracking environmental impacts.
Begin using this to refine your cyclical narratives effectively.
Frequently Asked Questions
How can I modify orbital paths for custom cycles?
Use the path editor to curve or extend lines; changes propagate across connected orbs. This allows fitting unique scenarios like 7-phase innovation models, maintaining visual coherence in diverse presentations.
Does it support collaboration in Google Slides?
Absolutely, upload the .pptx for real-time edits. I've coordinated with remote teams this way, ensuring smooth revisions without compatibility issues.
What's the best way to add icons to orbs?
Insert via the shape menu and group with balls for unified movement. This enhancement has made my training decks more intuitive for visual learners.
If I have over 41 slides, how to expand?
Copy slides freely; the design consistency holds. From experience, this base set handles expansive topics like multi-year planning with ease.
Can it link to external data sources?
Yes, embed links or use data import for live updates. Useful for dynamic reports in volatile markets.
Are transition effects customizable for orbs?
Fully, adjust speed and style in the animation pane to match your delivery rhythm, heightening impact in keynotes.