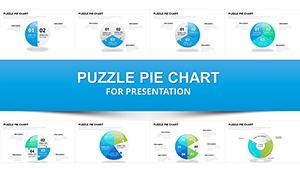
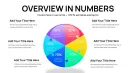
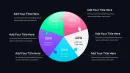
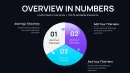
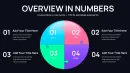
Dynamic Puzzle Pie Charts PowerPoint Template

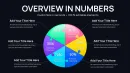


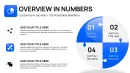
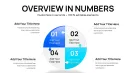
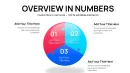
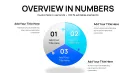
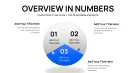


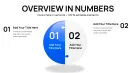
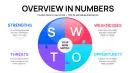
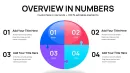


In fast - paced analysis sessions, decision - makers need visuals that go beyond simple shares to reveal underlying connections. This 37 - slide collection delivers dynamic puzzle pie charts that make those links unmistakable, turning potential oversight into immediate insight.
The refined execution has proven invaluable in my work with enterprise clients facing complex data relationships.
Core Visual Elements and Variations
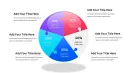
Precision - crafted puzzle integrations define this set.
- Dynamic segment handling: Fluid resizing with maintained connections.
- Animation frameworks: Smooth transitions for emphasis builds.
- Palette flexibility: Coordinated schemes for various branding needs.
- Structural depth: Layered effects for enhanced perception.
Vector construction ensures crisp display across presentation formats.
Deployment in High - Impact Reviews
Operations teams map process dependencies, while finance groups illustrate risk factor interconnections during assessments.
Reporting cycles benefit from clear proportion views that underscore systemic ties.
Streamlined Presentation Integration
Native PowerPoint compatibility from 2016 ensures flawless adoption. Standard chart tools drive updates, with puzzle geometry adapting intelligently.
Real Deliverables Featuring These Charts
Transformation programs used them to outline change component reliance. Compliance reviews highlighted control element integrations.
Performance dashboards incorporated puzzle pies for metric interdependence clarity.
Method Comparison Overview
| Criteria | Traditional Pies | Hand - Crafted Versions | This Dynamic Collection |
|---|---|---|---|
| Connection Clarity | Implicit at best | Potential flaws | Explicit puzzle structure |
| Execution Quality | Functional | Varies widely | Consistently professional |
| Development Speed | Fast but basic | Slow | Rapid with sophistication |
| Insight Depth | Surface | Possible but effortful | Built - in relational emphasis |
Advance your analysis visuals - secure this dynamic puzzle pie charts PowerPoint template and drive clearer decisions.
Industry - Tailored Uses
Supply chain reviews trace supplier linkages. Investment analyses show asset class interactions. Regulatory reporting maps framework components.
Frequently Asked Questions
What makes the dynamic aspects stand out?
Fluid animations and responsive geometry create movement that mirrors real - world data shifts.
How many slides are optimized for different scenarios?
37 variations cover standalone charts, combined views, and animated sequences.
Can pieces be highlighted individually?
Dedicated layouts allow isolation or elevation of specific segments for focus.
Does it support high - resolution exports?
Vector - based elements ensure sharpness in any output format.
Ideal for quarterly business reviews?
Yes - the designs excel at showing performance factor interconnections.