Chemical and Biomedical PowerPoint Charts: Precision for Scientific Impact


Type: PowerPoint Charts template
Category: Medicine - Pharma
Sources Available: .pptx
Product ID: PC01049
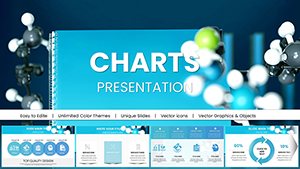
Template incl.: 59 editable slides
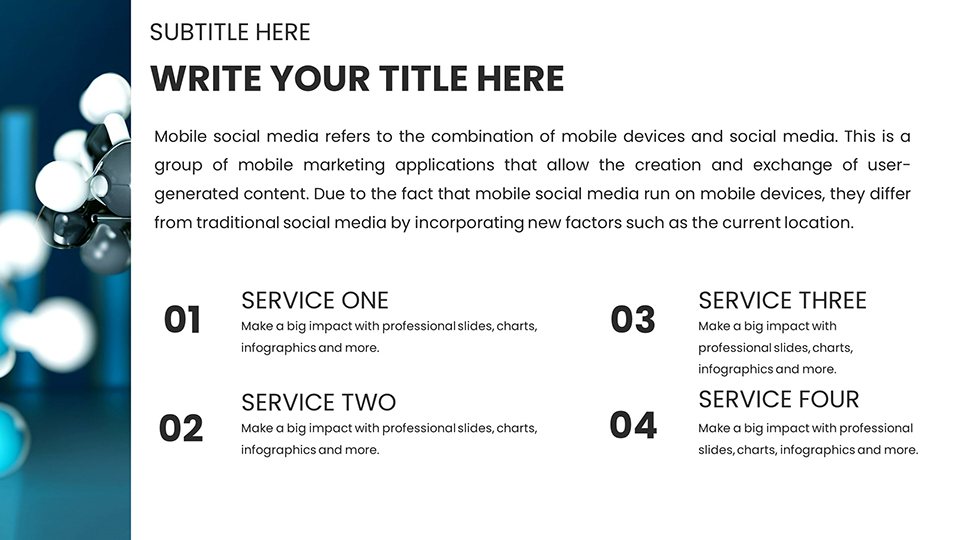
In the rigorous fields of chemistry and biomedicine, where data precision can influence breakthroughs, our Chemical and Biomedical PowerPoint Charts template empowers professionals to present with authority. Featuring 59 editable slides, it specializes in visualizing lab results, molecular interactions, and clinical data, turning dense information into digestible insights. Ideal for researchers unveiling new compounds or physicians discussing treatment protocols, this tool aligns with standards from bodies like the International Union of Pure and Applied Chemistry (IUPAC).
Envision a conference where your slide on pharmacokinetics draws nods of approval, backed by accurate graphs that highlight absorption rates. This template addresses common challenges like data overload by offering clean, scalable designs that enhance comprehension. Drawing from real-world successes, such as how a biotech firm used analogous visuals to secure funding for a novel therapy, it builds credibility and fosters collaboration.
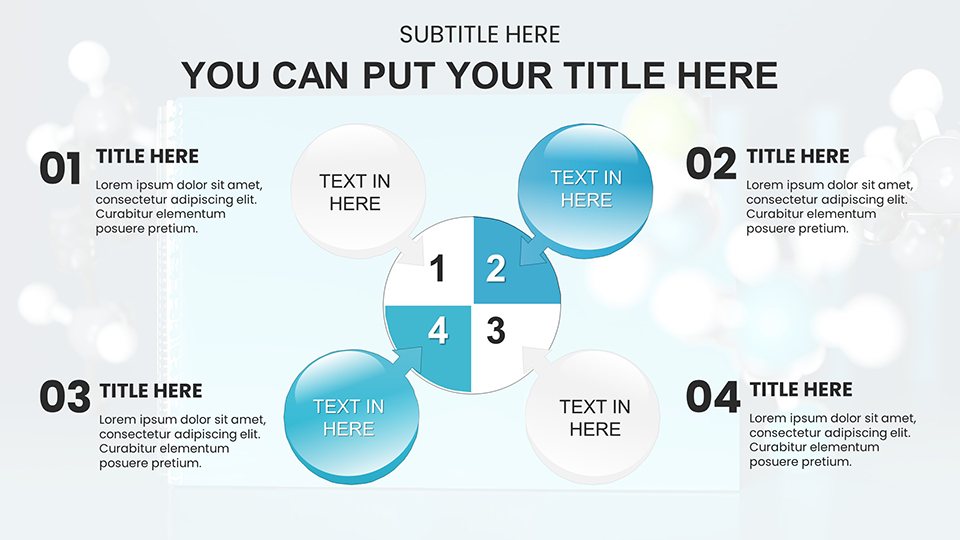
Essential Features for Scientific Storytelling
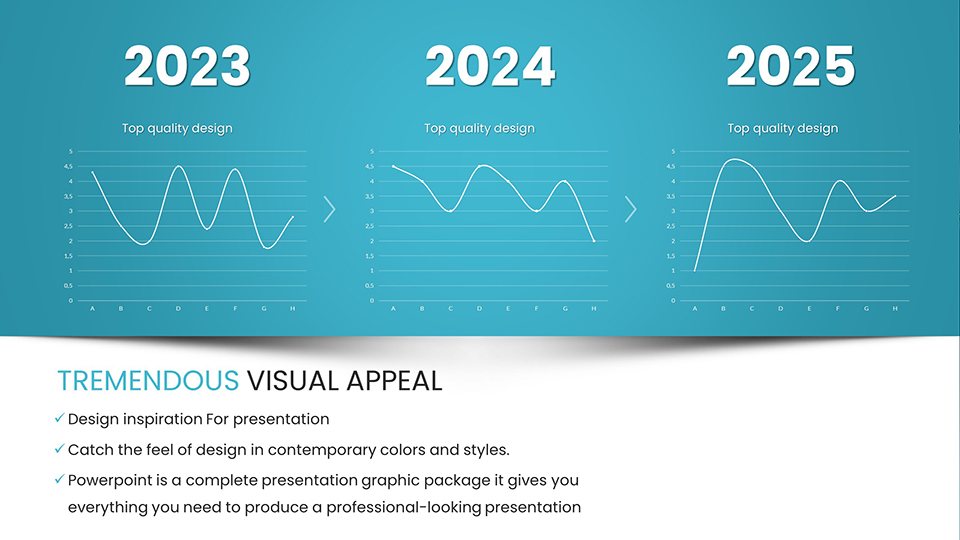
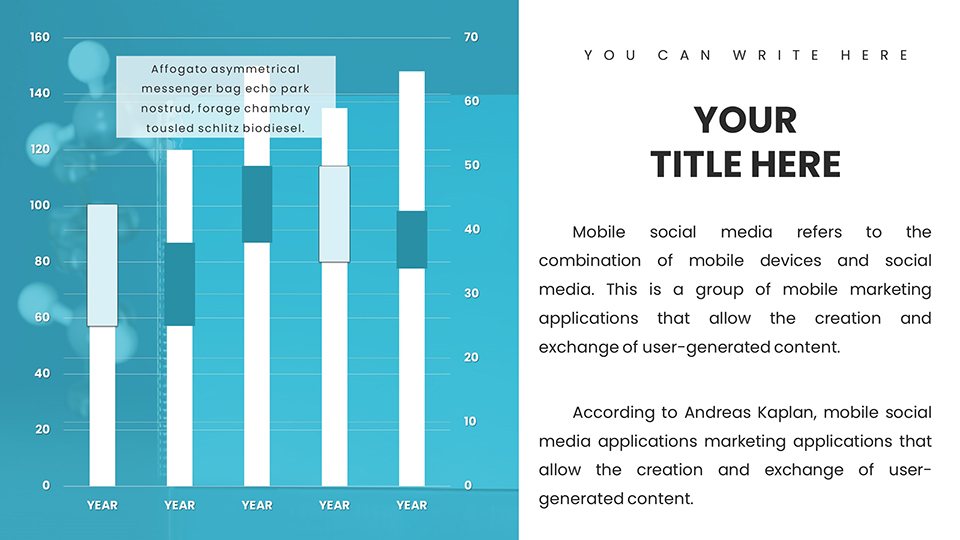
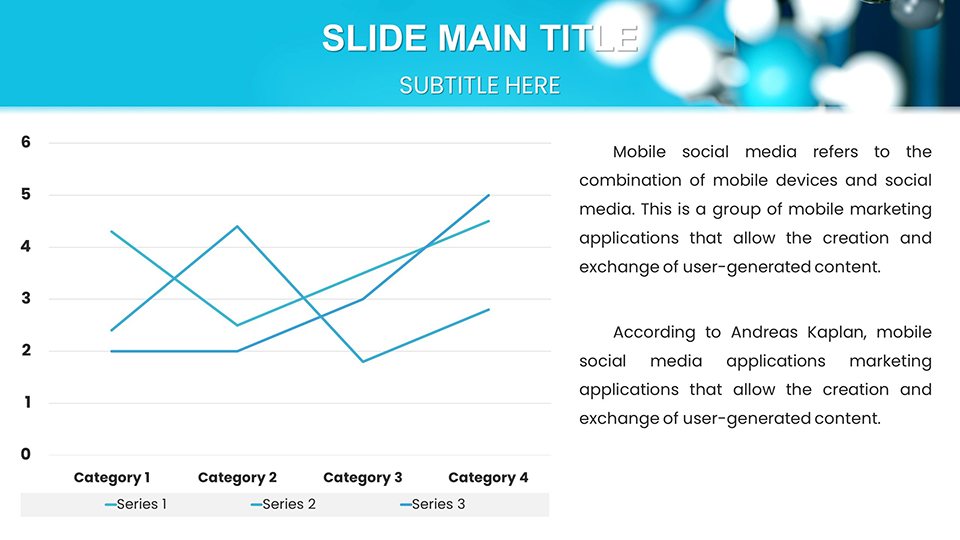
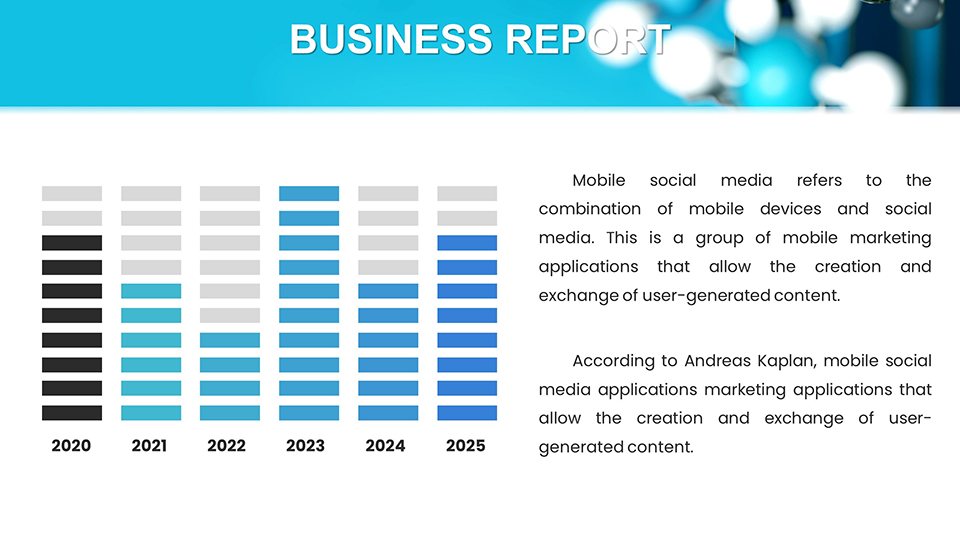
Engineered for accuracy, each slide supports high-fidelity data representation, with options for logarithmic scales or error bars to reflect experimental variability.
Advanced Visualization Capabilities
Craft compelling narratives with charts like dose-response curves or protein-ligand binding diagrams, all with embedded formulas for quick recalculations.
- Reaction Kinetics Graphs: Line plots for rate constants, customizable for enzyme assays.
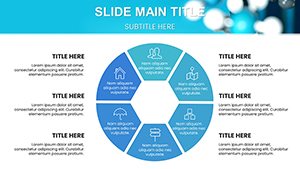
- Structural Biology Slides: 3D model integrations for macromolecules, aiding in drug design pitches.
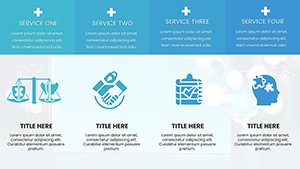
- Clinical Trial Overviews: Bar charts for efficacy metrics, compliant with FDA reporting styles.
- Spectrometry Data: Peak analysis tools, perfect for mass spec interpretations.
Robust Customization and Compatibility
Modify with ease: alter axes for specific units, incorporate logos, or link to databases. Works flawlessly in PowerPoint, Google Slides, and beyond, facilitating global team inputs. As an SEO specialist in sci-tech, integrate phrases like "biomedical data visualization" to capture targeted searches.
For a typical workflow, begin with raw data from lab software, populate a template slide, and refine with annotations - ensuring your presentation mirrors peer-reviewed journal quality.
Applications in Research and Medicine
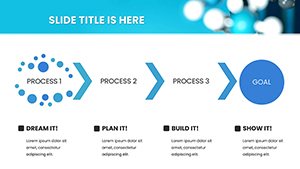
From lab benches to boardrooms, apply these charts to diverse needs. In pharmaceuticals, map out trial phases with Gantt-like timelines; in academia, illustrate metabolic pathways for grant proposals.
- Data Compilation: Aggregate from sources like PubMed or internal logs.
- Design Refinement: Use templates to standardize visuals across teams.
- Presentation Delivery: Employ subtle animations to underscore key findings.
- Post-Event Analysis: Update slides based on feedback for iterative improvements.
A notable example: Biomedical engineers at a university leveraged similar charts to present tissue engineering data, resulting in a published paper and partnership offers. Superior to default tools, it includes precision grids and calibration aids, reducing misinterpretation risks.
Streamlining Professional Workflows
Integrate with tools like MATLAB for data exports or use in virtual symposia. For interdisciplinary ties, adapt for bio-architecture, like chemical stability in building materials.
Expert tips: Opt for sans-serif fonts for readability, limit colors to 4-5 per slide, and include source citations for trustworthiness.
The Edge in Scientific Communication
This template excels with its niche focus, offering more than generic alternatives through specialized biomedical elements. Cost-effective, it accelerates from concept to delivery, with users citing 40% efficiency gains.
Advance your discoveries - secure this essential resource now.
Frequently Asked Questions
- How precise are the data charts?
- Built for scientific accuracy, with options for error bars and logarithmic scaling.
- Suitable for biomedical engineering?
- Yes, includes slides for device simulations and material analyses.
- Can I add custom formulas?
- Easily embed Excel-linked equations for dynamic updates.
- Compatibility with other software?
- Seamless with PowerPoint, Google Slides, and Keynote.
- Any support for beginners in biomed?
- Pre-populated examples guide users through complex setups.