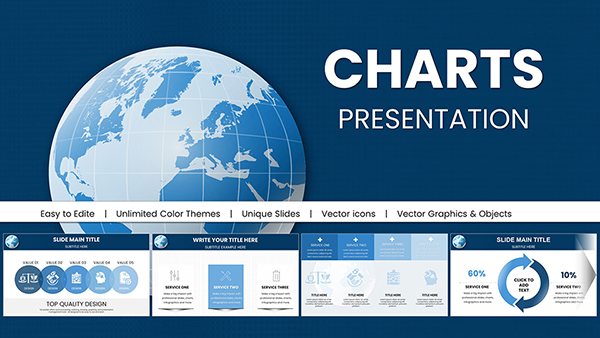
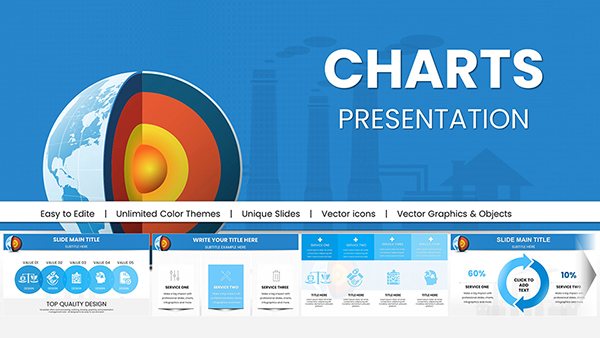
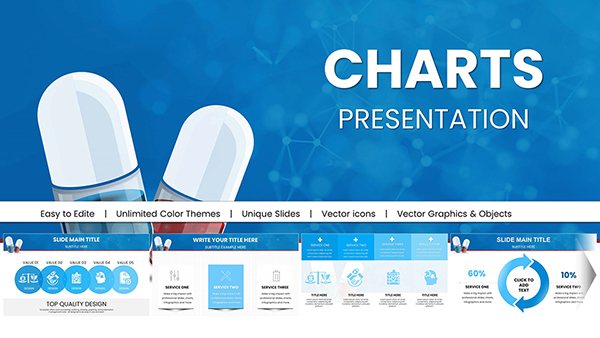
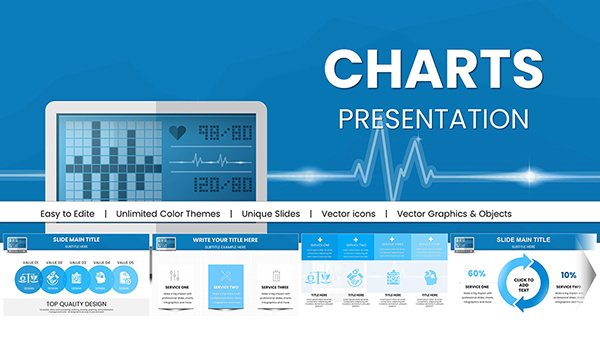
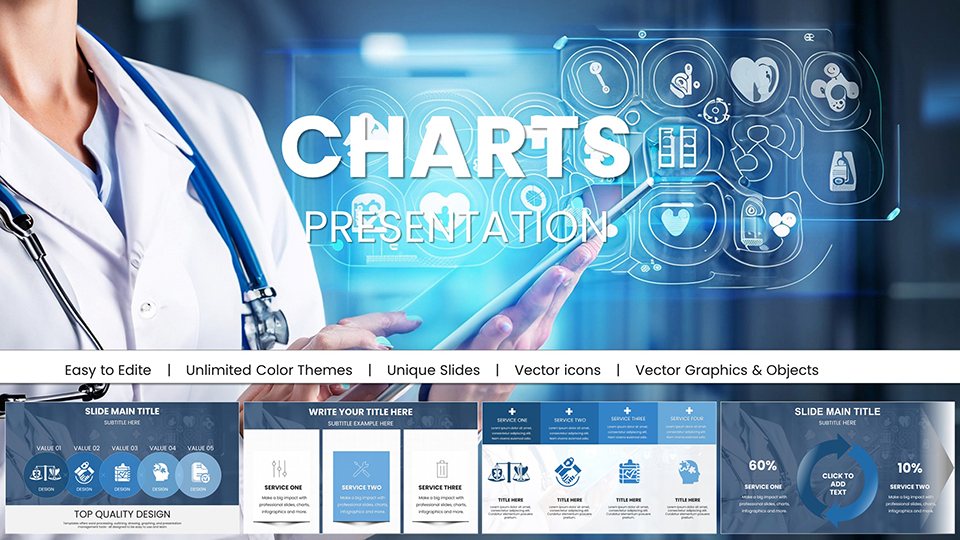
Medical Health PowerPoint Charts Template


Type: PowerPoint Charts template
Category: Medicine - Pharma
Sources Available: .pptx
Product ID: PC01045
Template incl.: 59 editable slides
Navigate the complexities of healthcare communication with our Medical Health PowerPoint Charts Template, a specialized resource crafted for doctors, nurses, researchers, and instructors. Featuring 59 editable slides, this template transforms medical data into digestible, visually compelling narratives. Envision presenting patient outcomes with precision graphs or educating on disease pathways with detailed flowcharts - all while adhering to HIPAA-inspired design principles for confidentiality and clarity. Ideal for conferences like those hosted by the AMA (American Medical Association), it empowers you to focus on expertise rather than slide creation. With PowerPoint and Google Slides compatibility, customize to your practice's needs, ensuring your audience grasps critical information swiftly and retains it effectively.
Harnessing Visuals for Healthcare Excellence
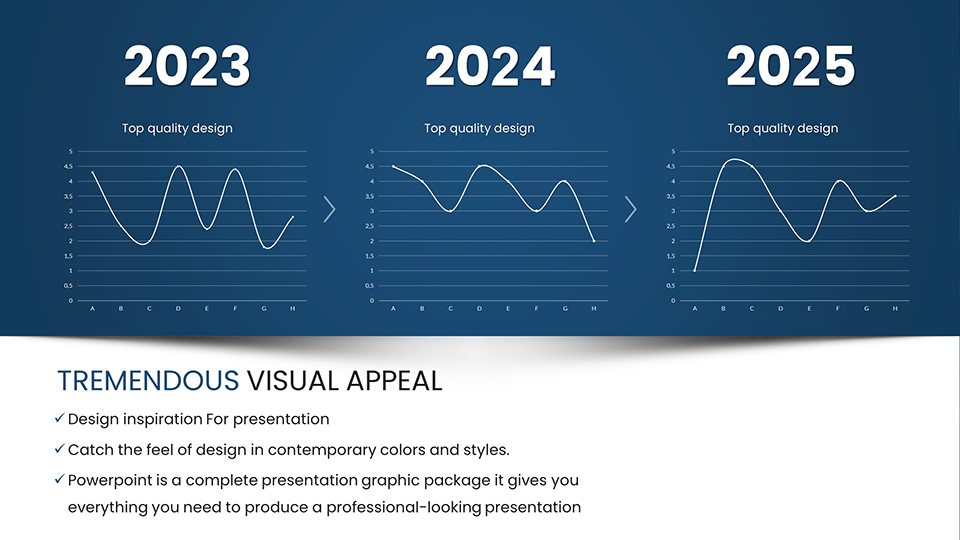
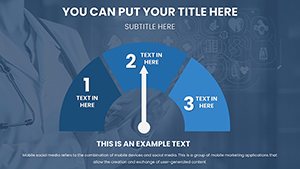
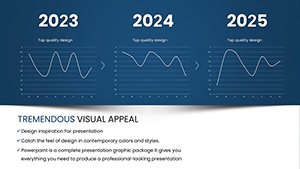
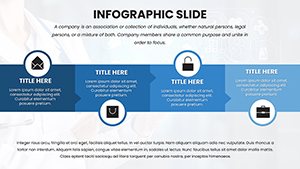
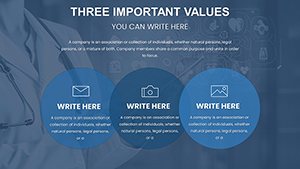
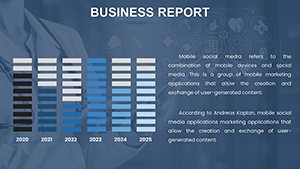
This template excels in rendering intricate health metrics accessible. For epidemiology reports, use area charts to track disease trends over time, with customizable axes for accurate scaling. The design incorporates medical icons like stethoscopes and DNA helices, in a palette of calming blues and whites, adjustable for branding.
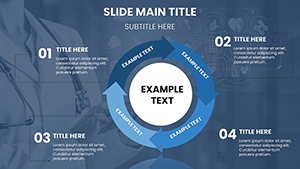
Data-driven slides include radar charts for multi-factor health assessments, superior to generic tools for their specificity. Case studies from medical journals like The Lancet highlight how visuals aid in faster decision-making.
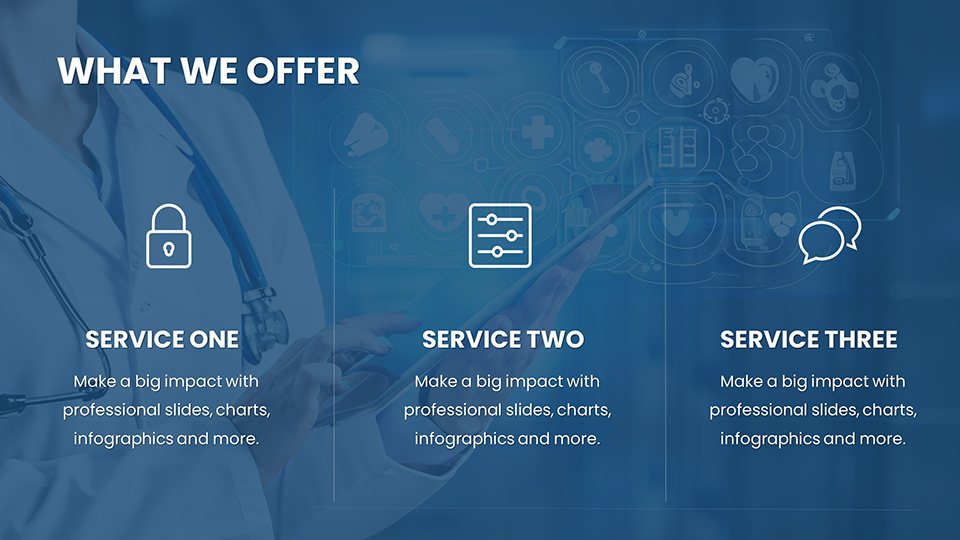
Standout Features for Medical Pros
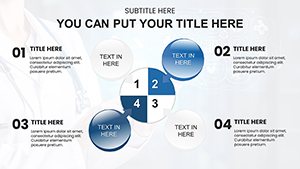
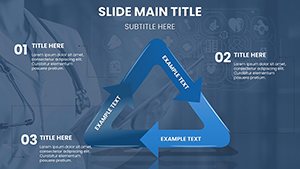
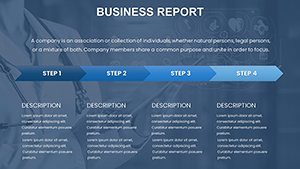
- Specialized Chart Types: From organ diagrams to statistical models.
- Deep Customization: Align with clinical guidelines, add annotations.
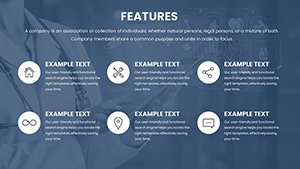
- Icon Library: Health-themed for authentic feel.
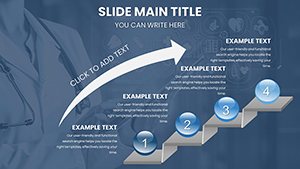
- Animation Support: Simulate processes like blood flow.
- Compliance-Ready: Layouts for secure data presentation.
Benefits include enhanced trustworthiness, as per , with authoritative integrations.
Applications in Medical Scenarios
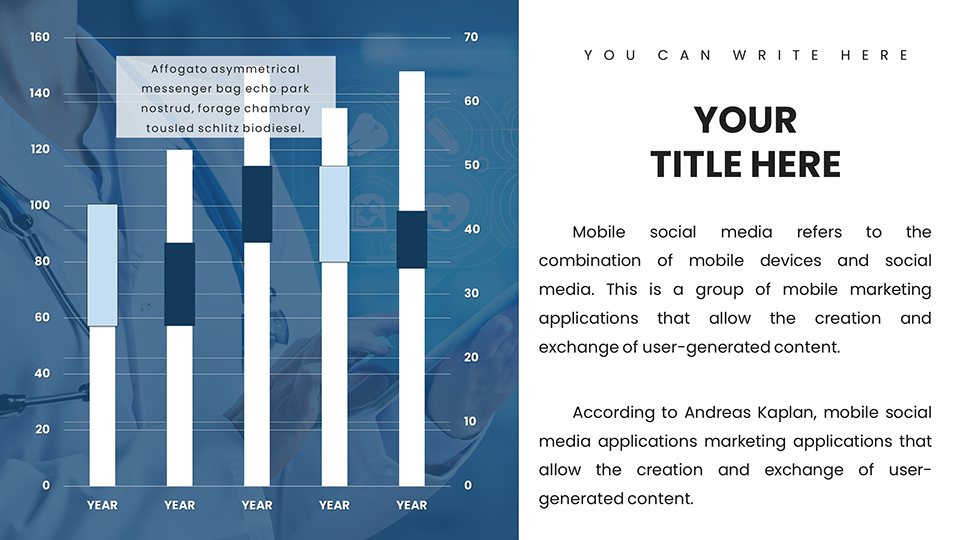
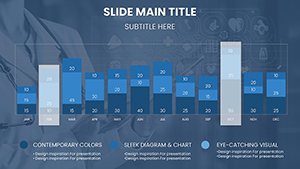
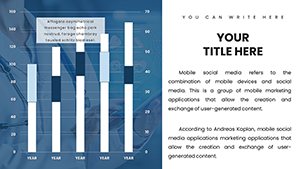
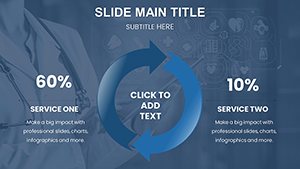
In clinics, use bar charts for treatment efficacy comparisons, as in a hospital's quality improvement project. For research, scatter plots visualize correlations, securing grants effectively.
Educators employ timelines for medical history lessons. CTA: Empower your medical insights - customize this template now.
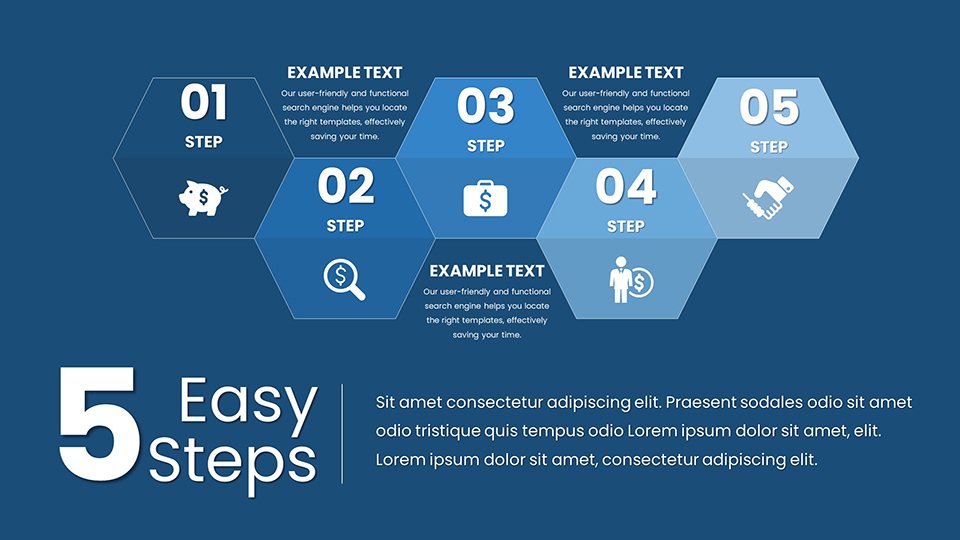
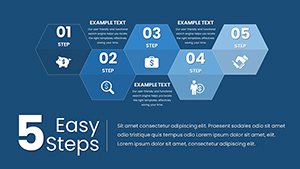
Integration Steps for Efficiency
- Launch in software.
- Select relevant slide.
- Enter health data.
- Modify visuals per case.
- Add dynamic elements.
- Validate accuracy.
- Present securely.
Outperforms basics with health-focused depth.
Tips for Impactful Health Presentations
Weave stories: Begin with patient journeys, use charts to illustrate. Opt for legible fonts. Light humor: "Make your data pulse with life!" Reference NEJM for credibility.
Conclude with action-oriented summaries.
Frequently Asked Questions
How editable are the medical charts?
Completely, for precise health data representation.
Compatible with Google Slides?
Yes, for team collaborations.
Suitable for research?
Ideal, with data-driven tools.
User-friendly for non-designers?
Yes, intuitive setup.
How to ensure data security?
Use built-in placeholders, avoid sensitive info in templates.
Includes health icons?
Yes, extensive library.