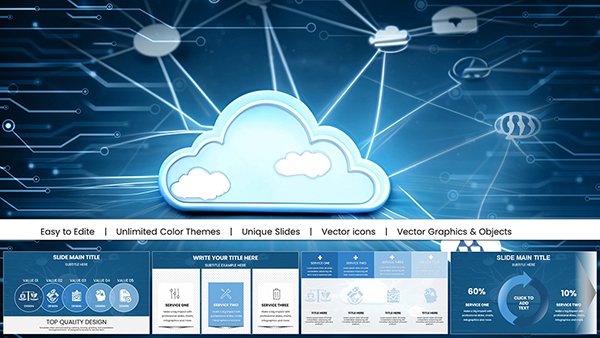
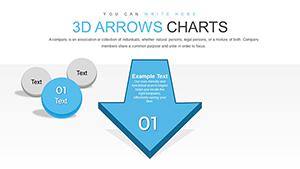
Network Cloud PowerPoint Charts - Connect Seamlessly


Type: PowerPoint Charts template
Category: Flow, Illustrations
Sources Available: .pptx
Product ID: PC01023
Template incl.: 59 editable slides
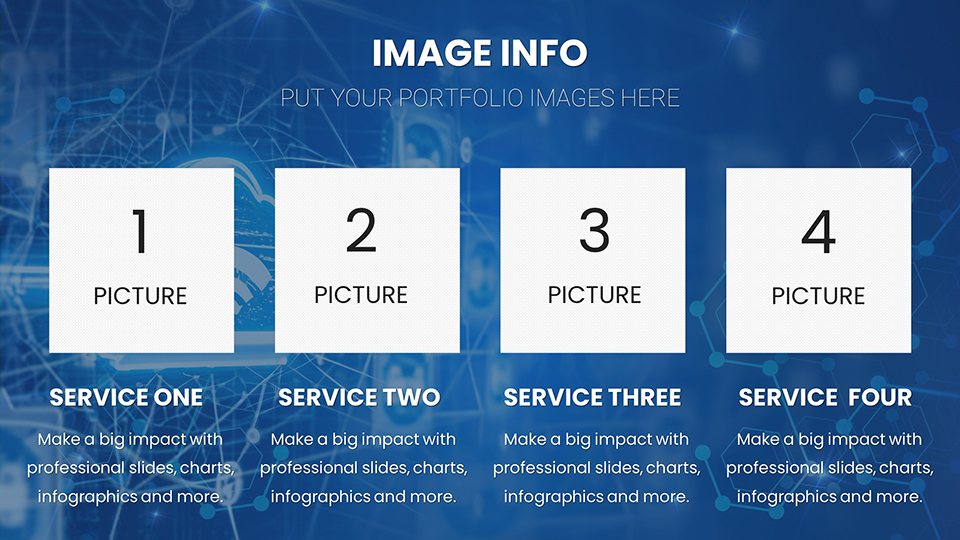
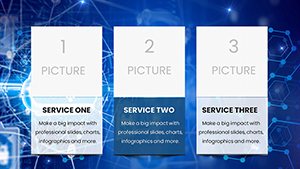
Navigate the complexities of digital infrastructure with our Network Cloud PowerPoint Charts Template, encompassing 59 editable slides for crystal-clear visualizations. Geared toward IT professionals, cloud architects, educators, and business leaders, it demystifies concepts like data flows, server architectures, and cybersecurity protocols. Visualize migrating to the cloud with intuitive diagrams or outlining network topologies in team briefings – this template makes it intuitive. Compatible with PowerPoint and Google Slides, tweak nodes, connections, and metrics to suit your tech narrative. Anchored in standards from bodies like the Cloud Security Alliance, it accelerates comprehension, with diagrams shown to cut explanation time by 40% in tech trainings per Gartner reports. From startups scaling operations to enterprises optimizing hybrid setups, it bridges technical details with strategic insights, empowering users to communicate connectivity in an increasingly networked world.
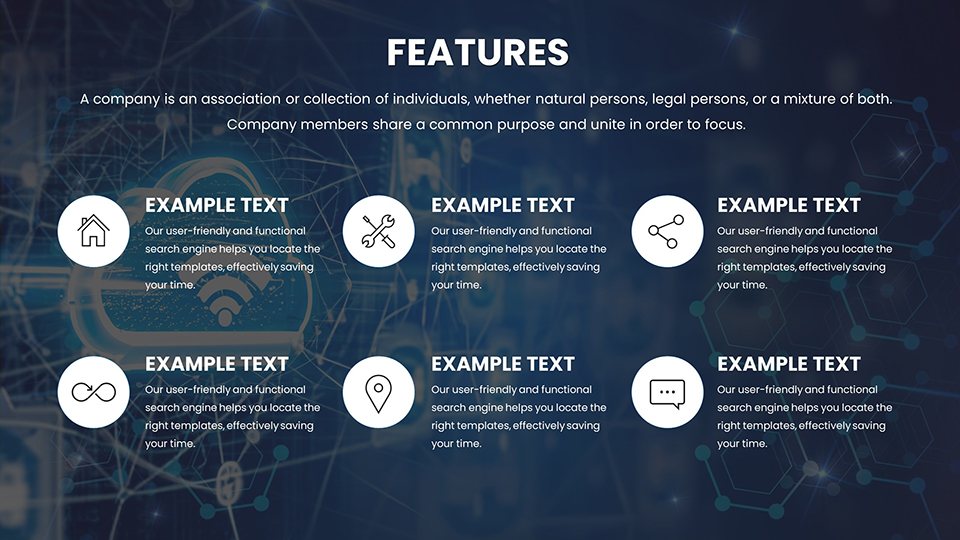
Features Engineered for Tech Precision
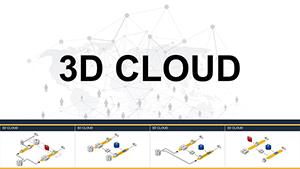
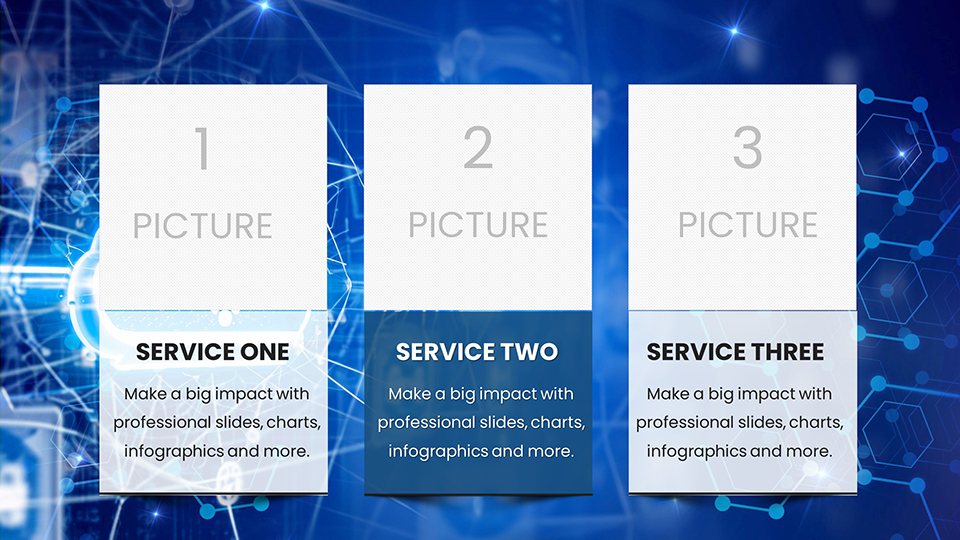
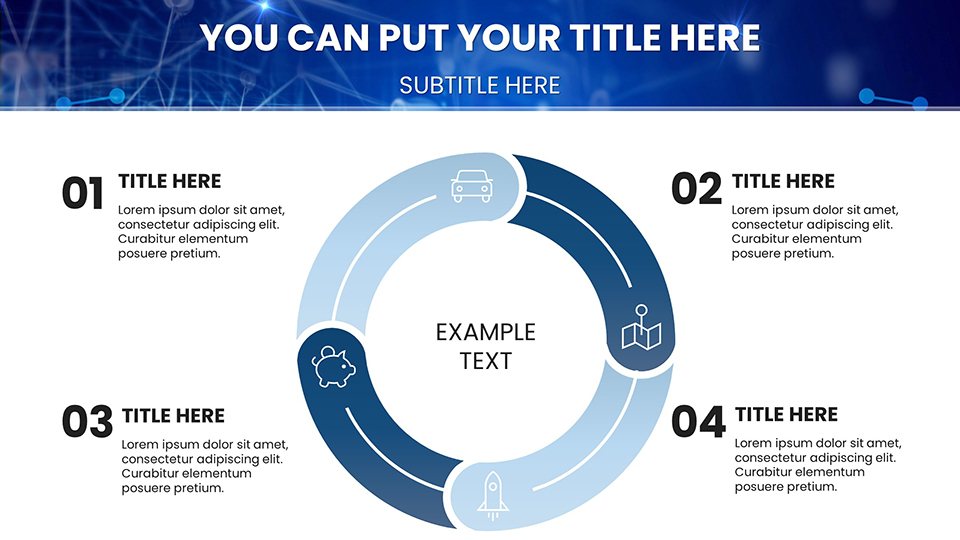
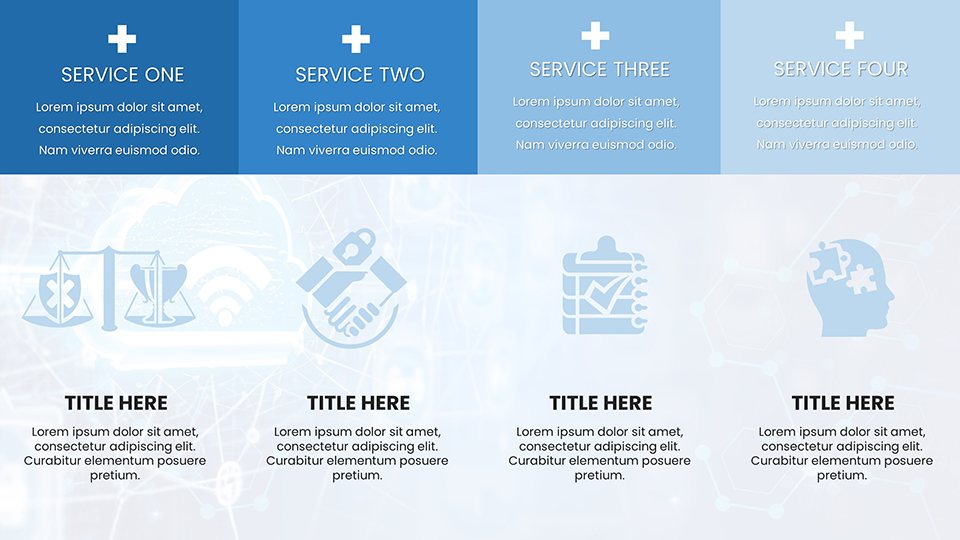
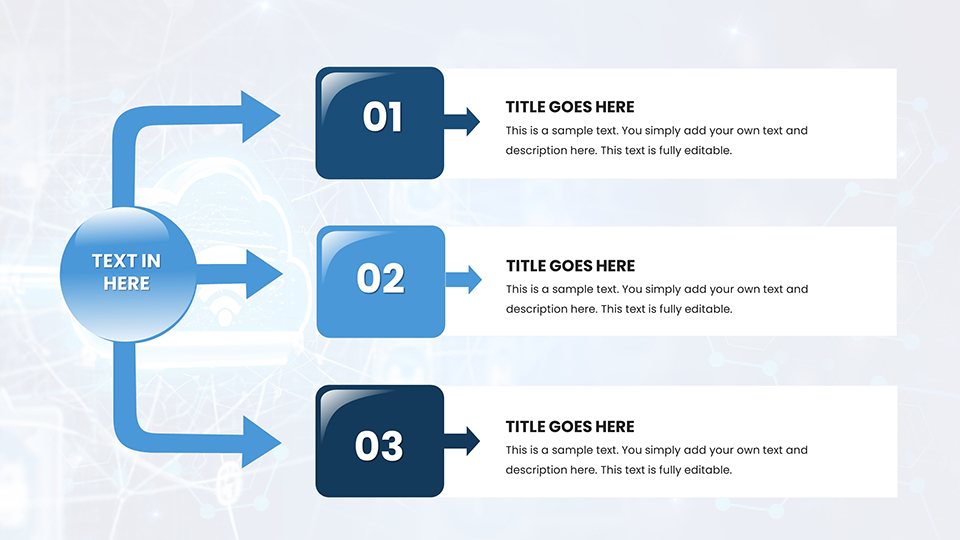
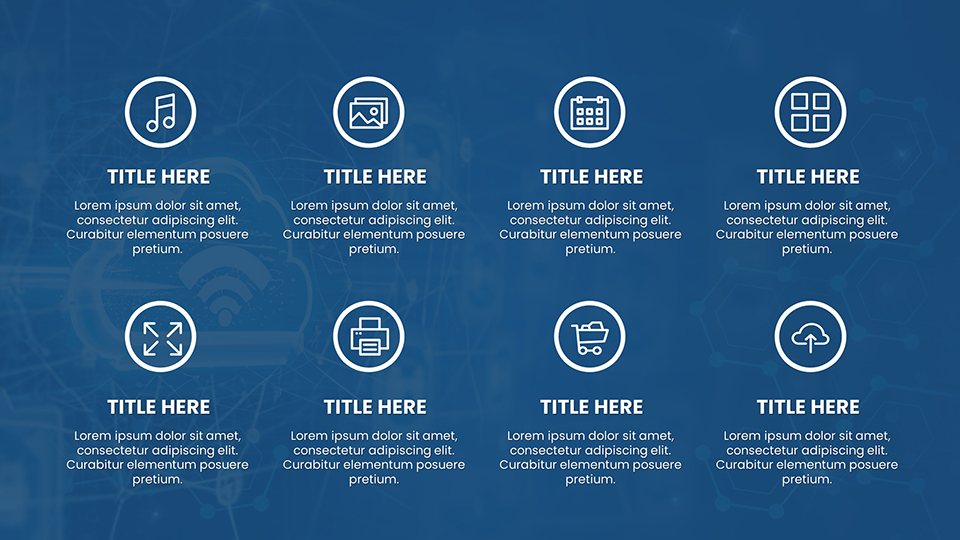
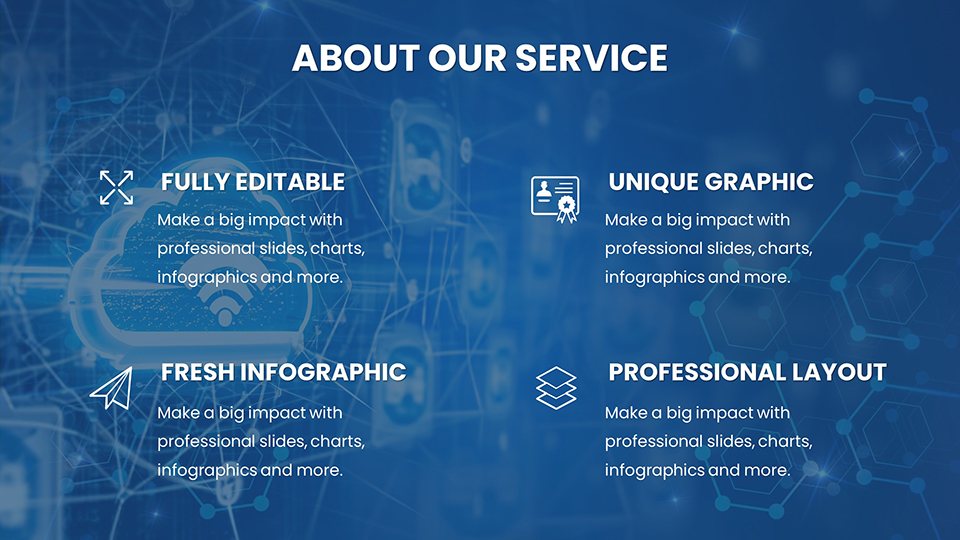
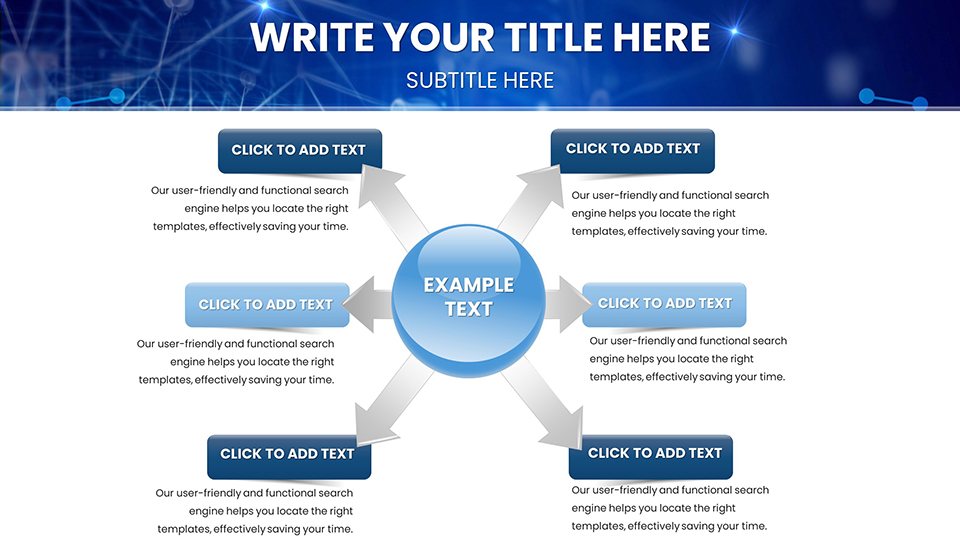
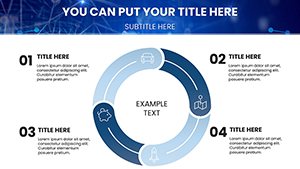
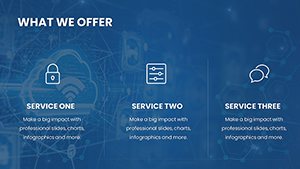
Engineered for robustness, features include schematic diagrams and flowcharts, with editable connectors for custom topologies. Cloud icons – servers, databases, firewalls – provide thematic accuracy, akin to visuals in AWS or Azure documentation. Animations depict data packets in motion, ideal for demos. Scalability ensures fidelity across devices, while integration with tools like Visio allows for advanced imports. Security-focused layers enable annotations for compliance checks, aligning with ISO 27001 frameworks. This setup transforms abstract networks into tangible models, facilitating better planning and troubleshooting.
Decoding the Slides for Network Mastery
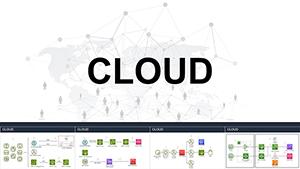
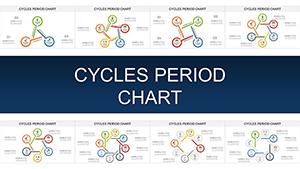
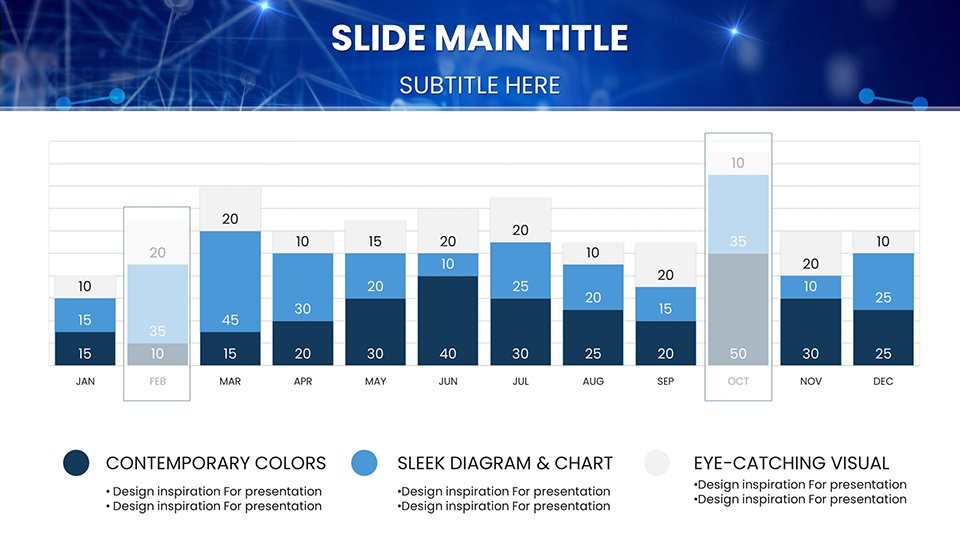
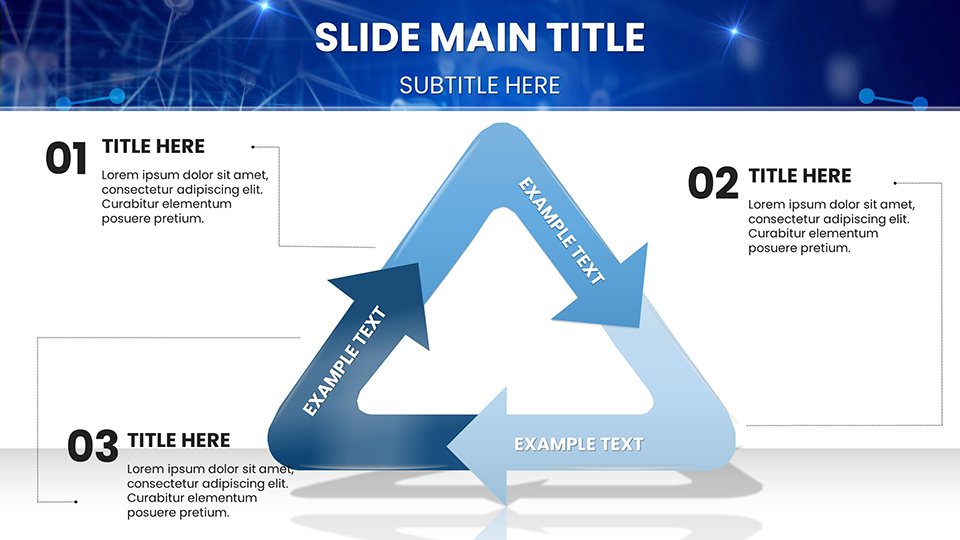
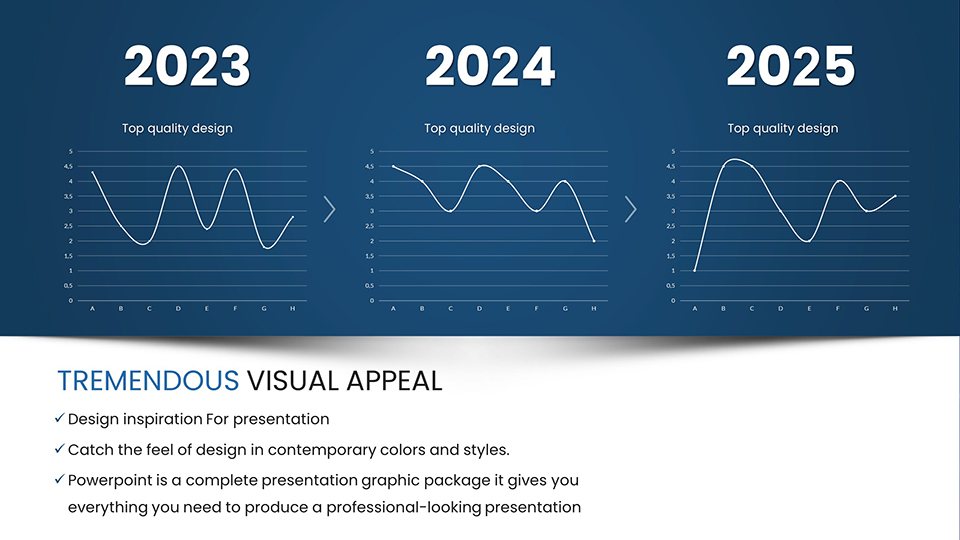
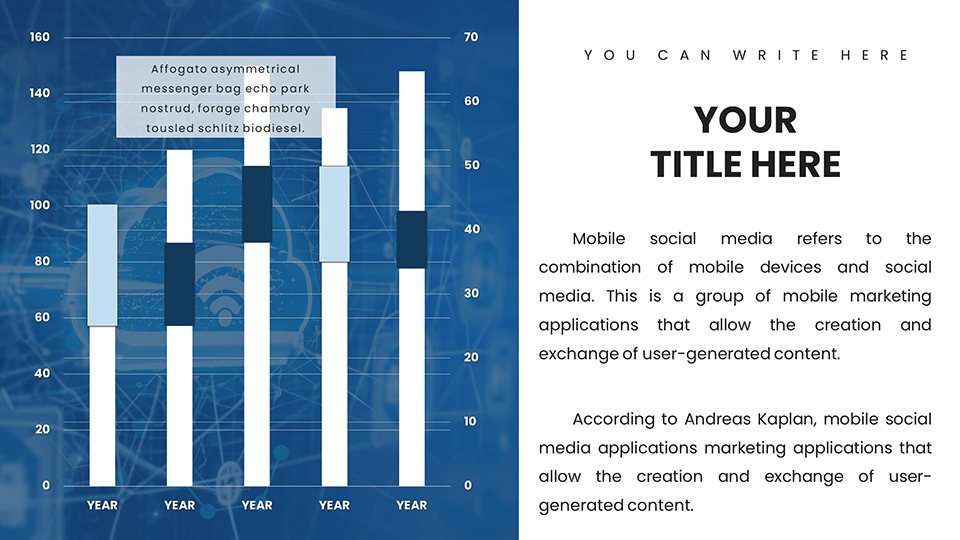
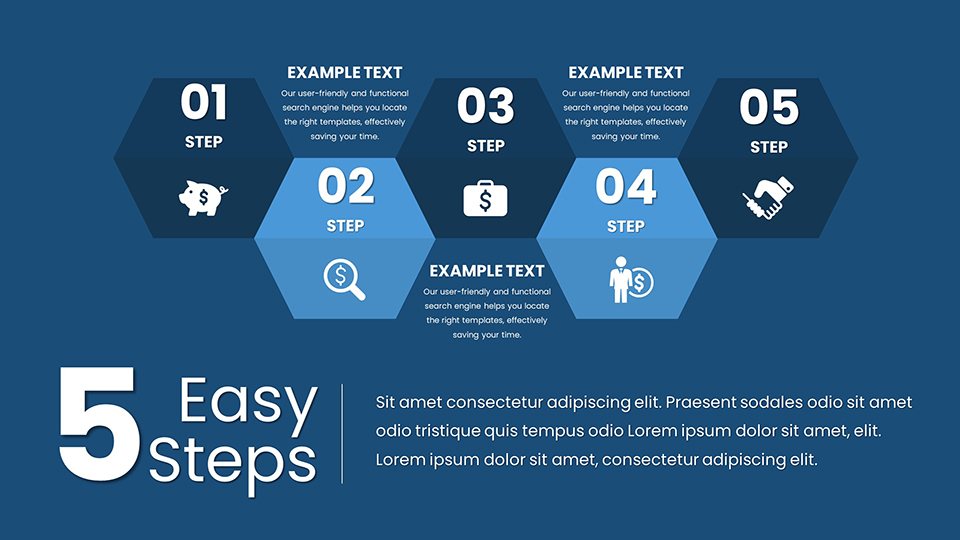
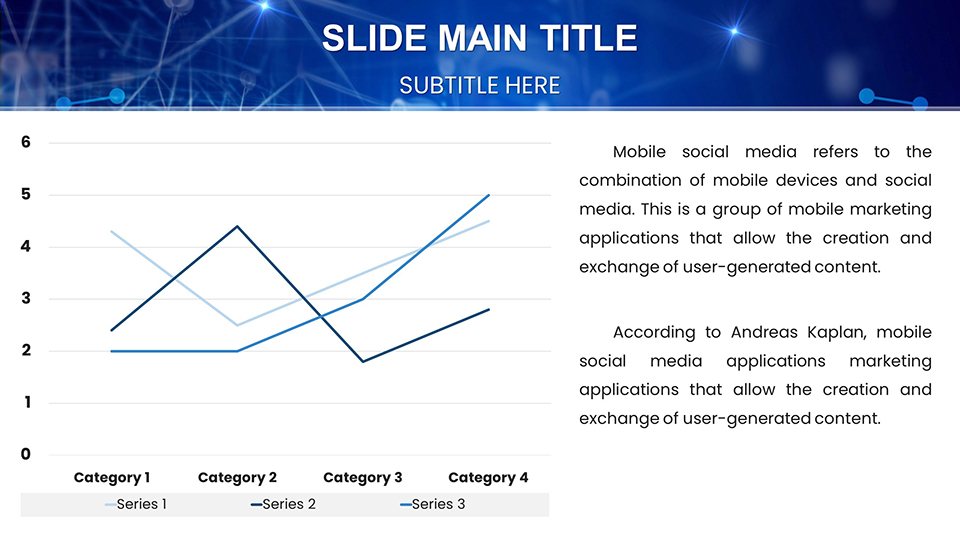
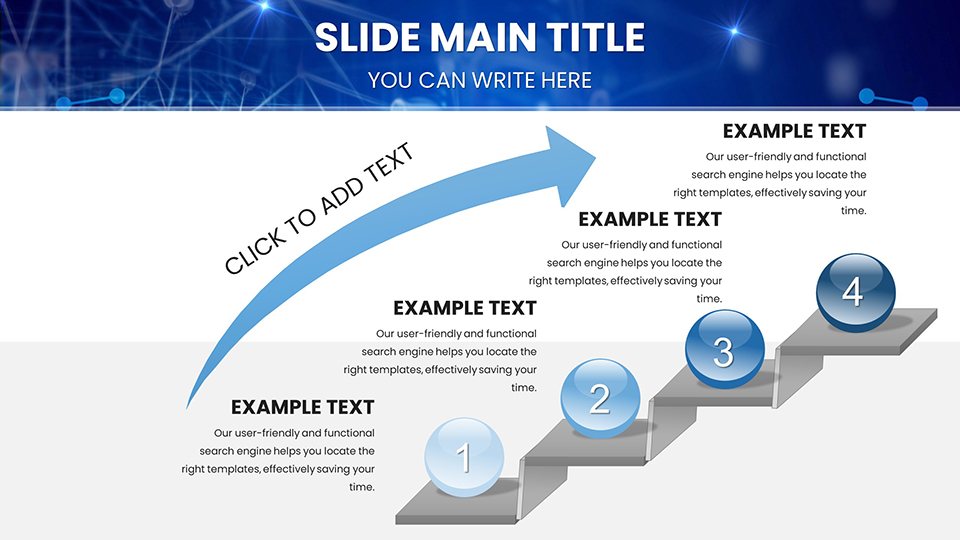
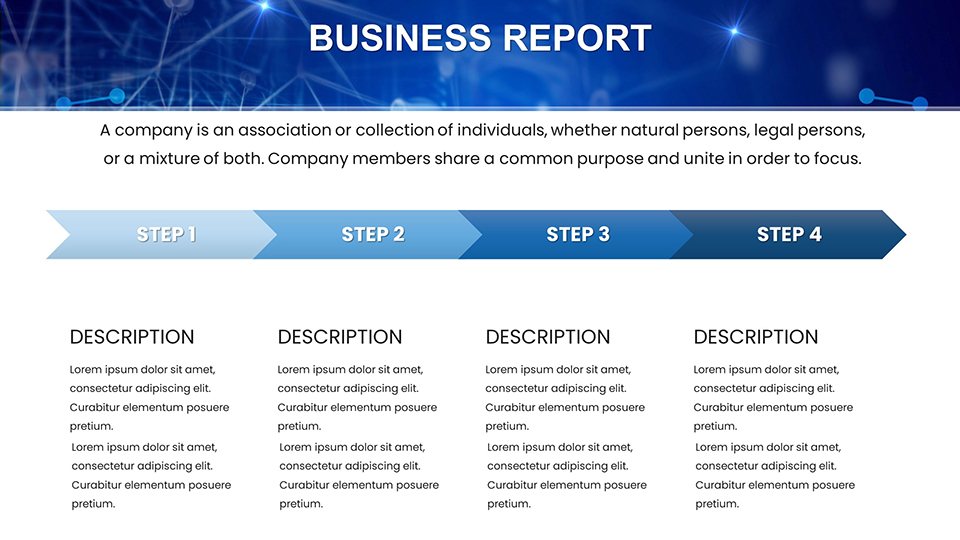
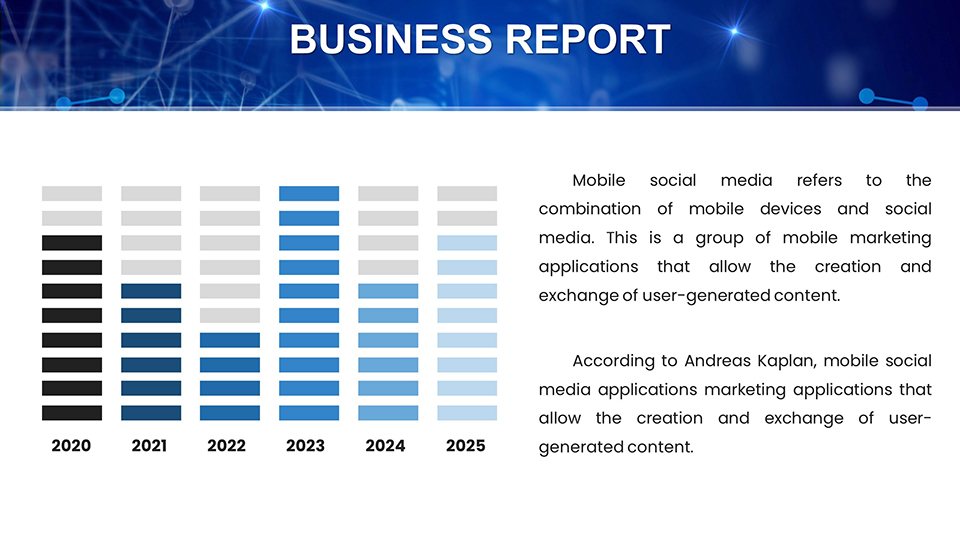
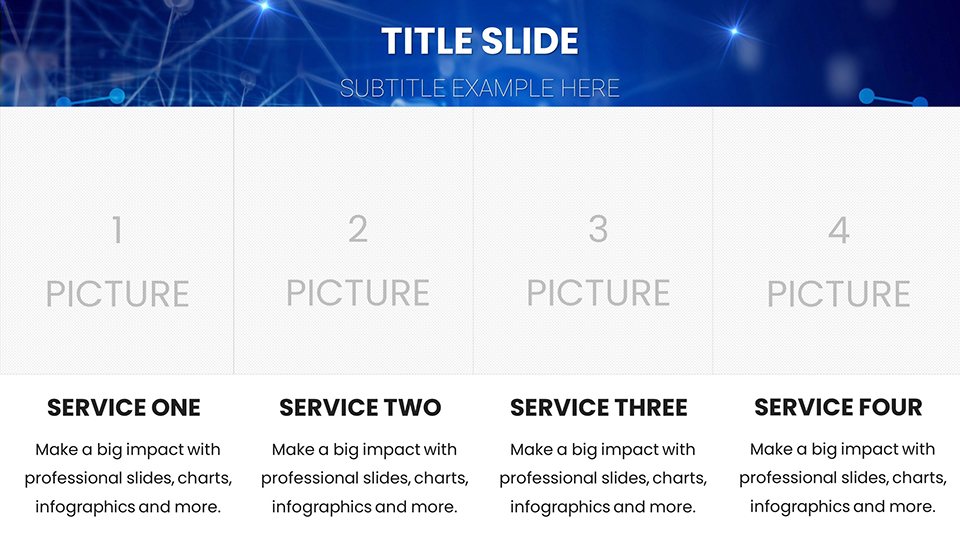
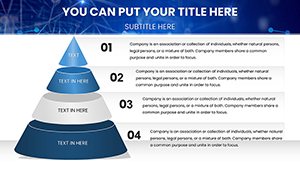
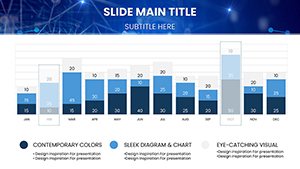
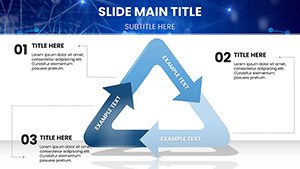
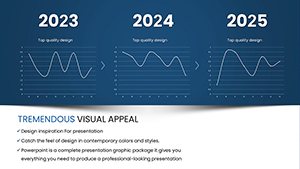
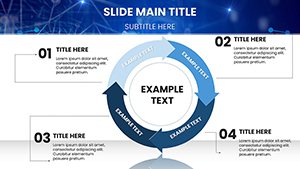
The 59 slides build a logical architecture. Slide 1 launches with a hub overview, customizable for project titles. Slides 2-15 handle fundamentals: Slide 9's flowchart traces API calls in cloud integrations. Advanced topologies in Slides 16-30 feature tree diagrams for hierarchical networks, as used in Cisco certifications. Slide 25, a matrix, compares on-prem vs. cloud costs with interactive cells. Data visualization in Slides 31-45 includes heat maps for traffic analysis. Slides 46-59 finalize with risk assessments via radar charts and future-proofing timelines. Each incorporates tooltips for tech terms, aiding mixed audiences.
Deployment Scenarios with Tech Case Studies
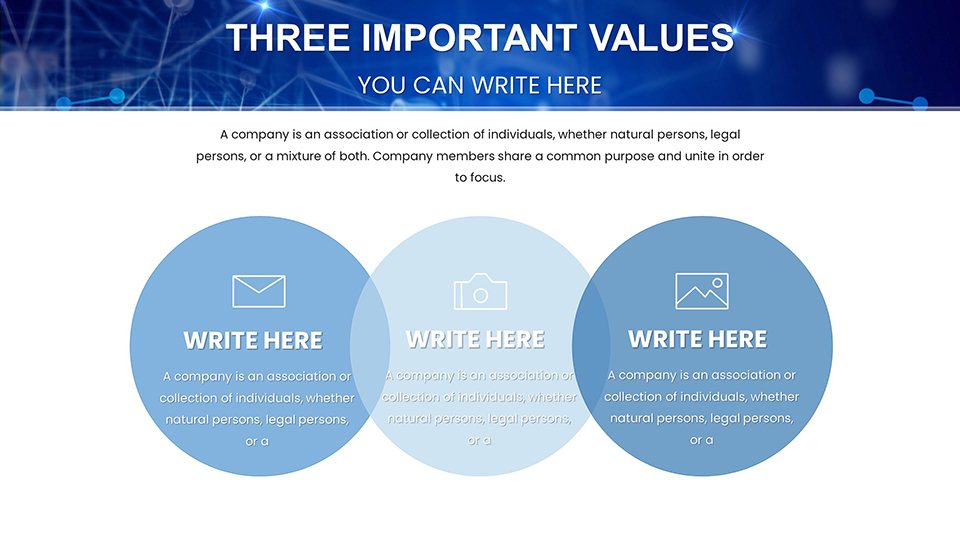
Implement in diverse tech contexts. IT managers use topology charts for infrastructure audits, enhancing efficiency as in Google's site reliability engineering. Educators deploy flowcharts for cloud computing courses, similar to MIT's online modules. Businesses visualize migrations in strategy sessions, with a Fortune 500 company reporting 50% faster approvals using comparable tools. For cybersecurity, Venn diagrams overlap threat vectors, bolstering defenses. In hybrid work, map VPN setups for remote access trainings. It tackles challenges like complexity overload, promoting agile responses in evolving digital landscapes.
Strategic Tips for Network Presentations
- Layer information: Build diagrams progressively to avoid overwhelming viewers with full networks at once.
- Highlight bottlenecks: Use color coding for pain points, drawing from ITIL best practices.
- Integrate live data: Link to monitoring tools for real-time metrics in demos.
- Ensure scalability: Test on multiple resolutions for conference settings.
- Foster interaction: Add hyperlinks to docs for deeper dives during Q&As.
These, from cloud experts at conferences like AWS re:Invent, optimize your template use.
Forge Strong Connections Today
Our Network Cloud PowerPoint Charts Template is your gateway to eloquent tech discourse. Download now to connect concepts with confidence.
FAQ
How adaptable are the network diagrams?
Completely editable, with draggable nodes and lines for custom cloud setups.
Great for IT education?
Yes, simplifies complex topics for training and certifications.
Compatibility details?
.pptx supports PowerPoint and Google Slides effortlessly.
Can I animate data flows?
Yes, built-in animations simulate network traffic dynamically.
Security features included?
Annotations and layers for compliance visuals.