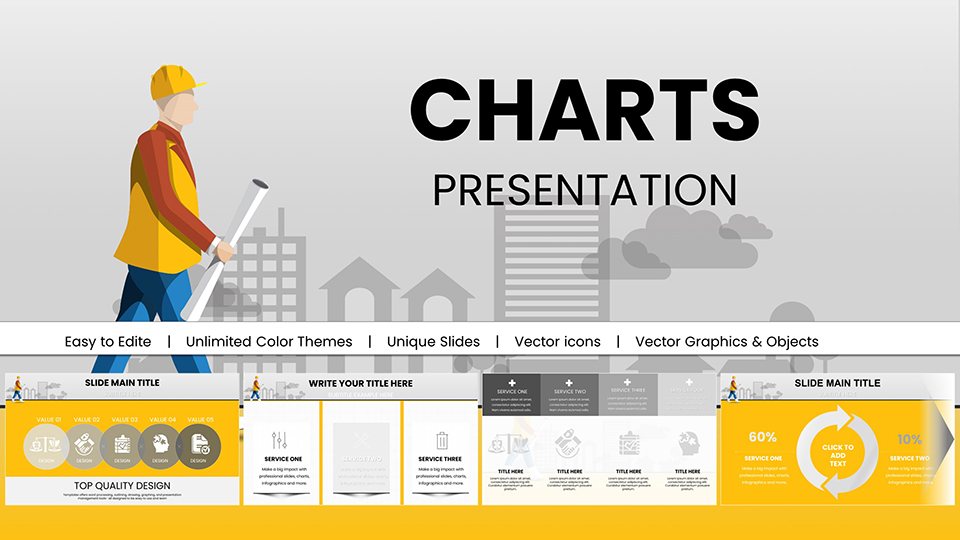
Architectural PowerPoint Charts Template - 57 Editable Slides for Designers


Type: PowerPoint Charts template
Category: Graphs, Illustrations
Sources Available: .pptx
Product ID: PC00987
Template incl.: 57 editable slides
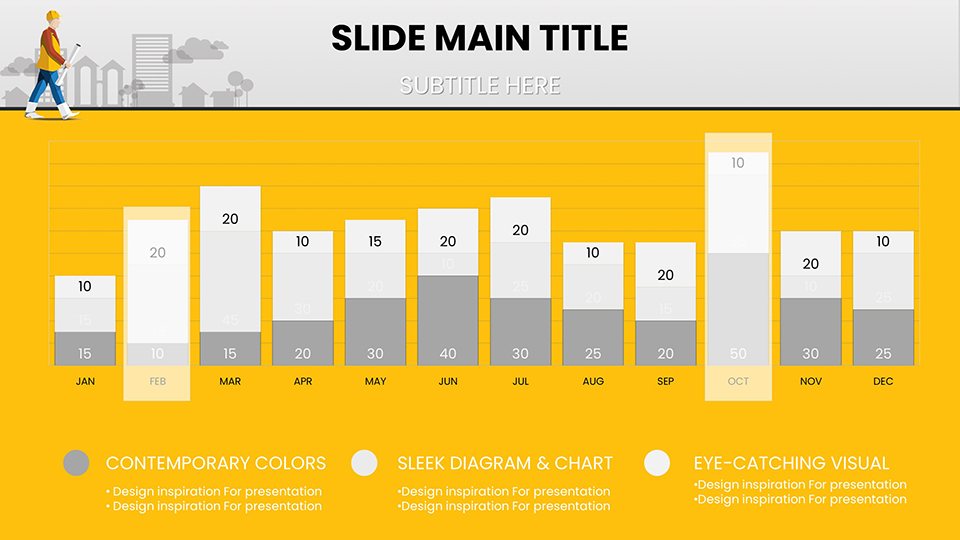
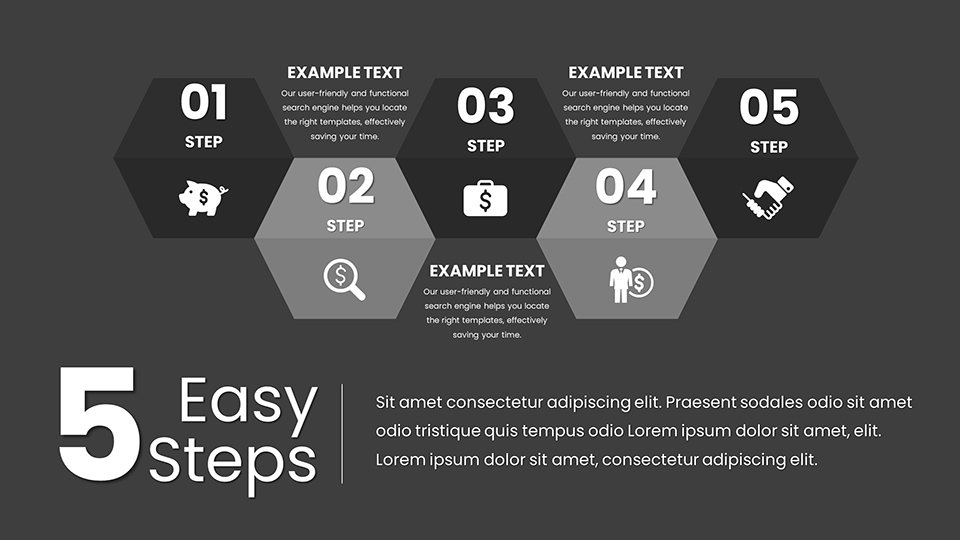
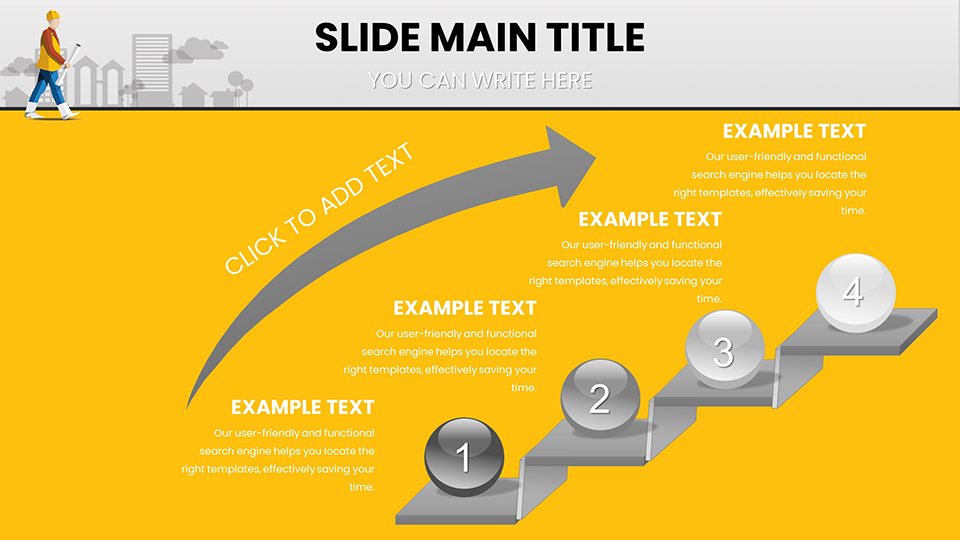
Architecture is more than blueprints; it's about weaving visions into reality, and the right presentation can bridge the gap between concept and construction. Envision presenting a sustainable urban development project where Gantt charts outline timelines seamlessly alongside 3D model integrations that captivate your audience. Our Architectural Company PowerPoint Charts template, with 57 editable slides, is crafted for architects, designers, engineers, and project managers to do exactly that. Drawing from AIA standards for clarity and precision, it features diagrams for site analysis, flowcharts for workflow processes, and bar graphs for budget breakdowns. Compatible with PowerPoint and Google Slides, this tool allows effortless customization to reflect your firm's innovative spirit. Whether pitching to clients or collaborating with teams, these charts turn technical data into inspiring stories, helping you secure approvals and foster collaborations in the built environment.
Crafting Visions: The Essence of Architectural Visualization
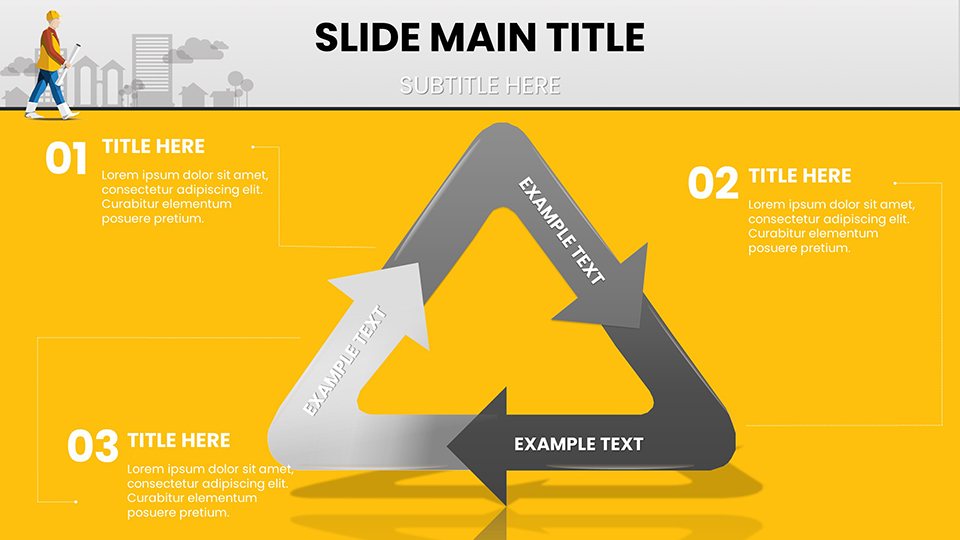
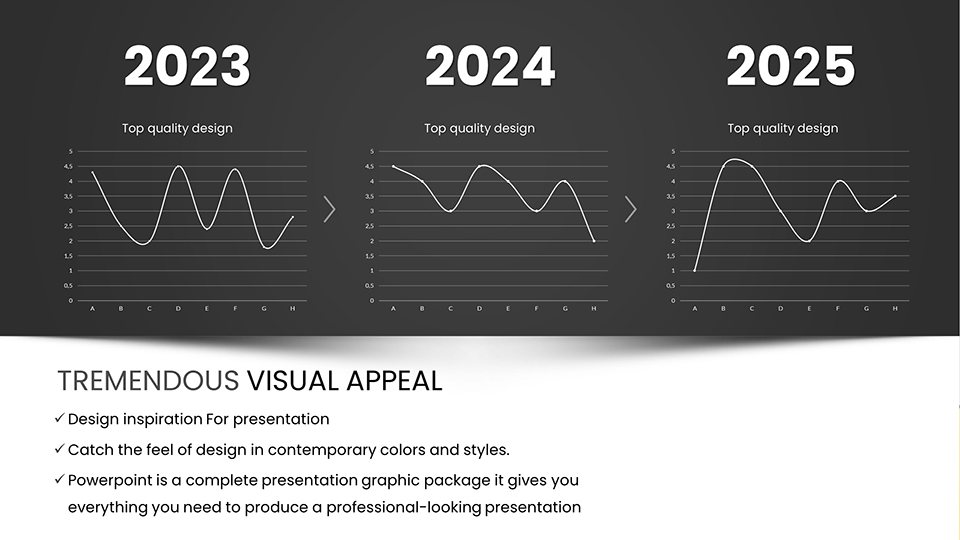
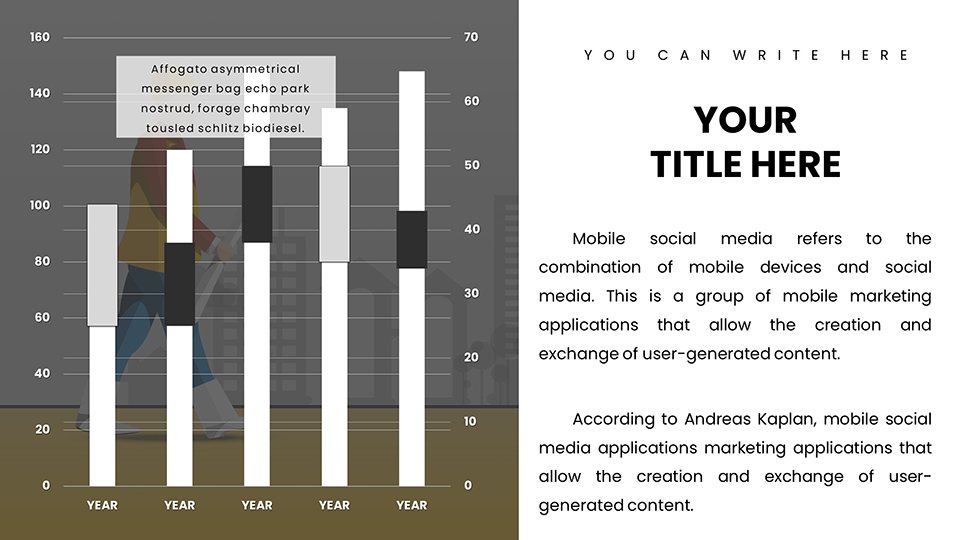
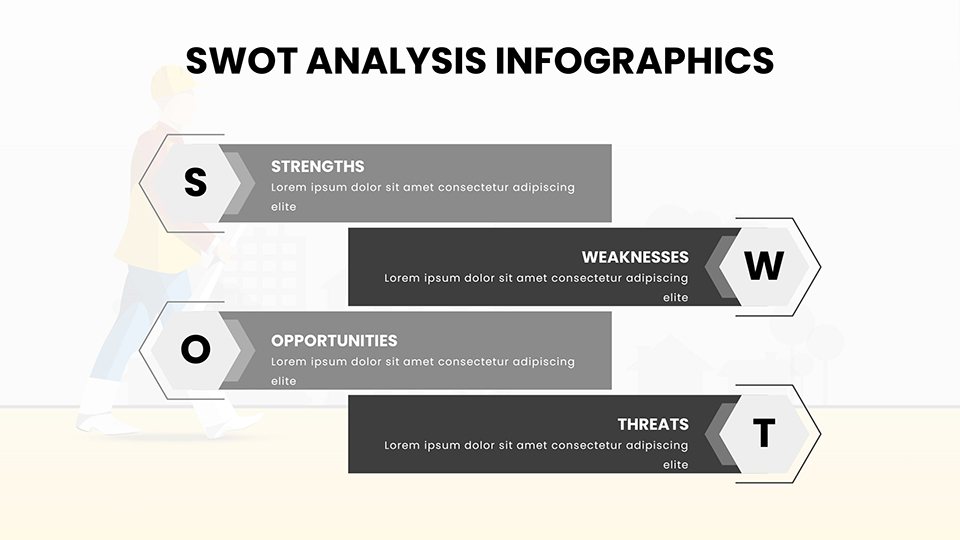
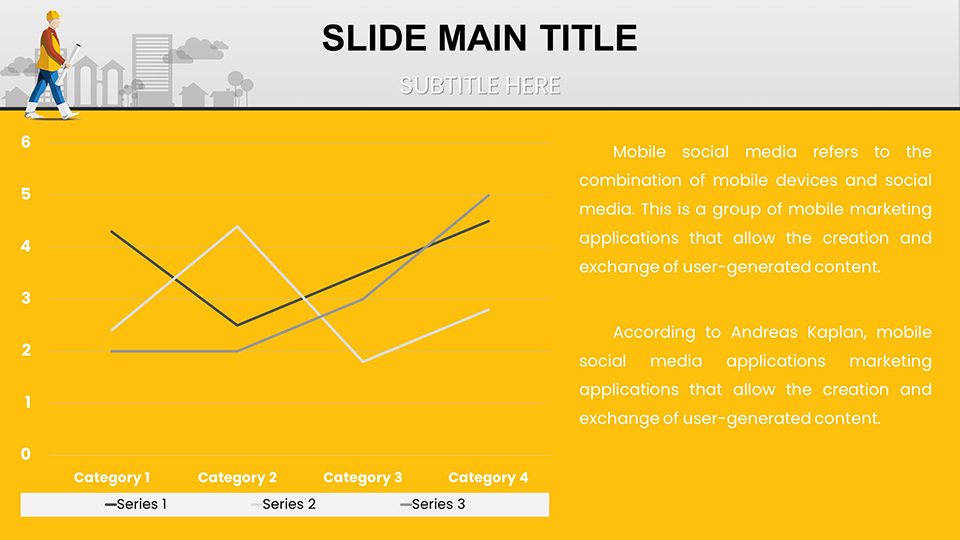
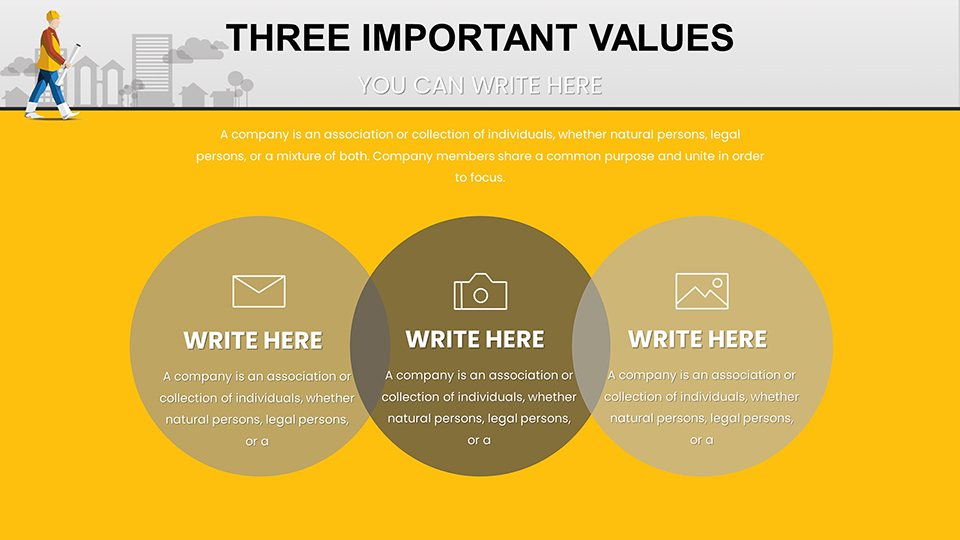
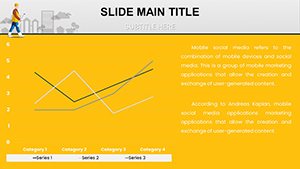
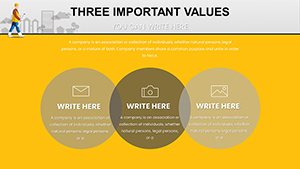
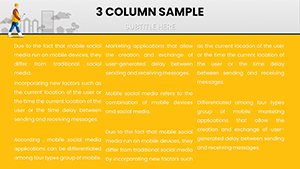
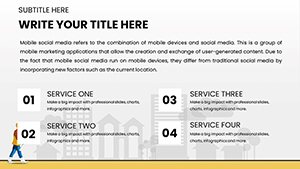
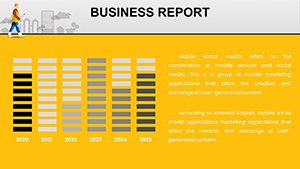
In the realm of design, where every line tells a story, this template empowers you to articulate complex ideas with elegance. Slides include hierarchy charts for organizational structures in large firms and Venn diagrams for material overlaps in eco-friendly builds. Inspired by real-world projects like LEED-certified structures, use pie charts to illustrate energy efficiency metrics, citing data from the U.S. Green Building Council. The color scheme - subtle grays and blues - mirrors blueprint aesthetics, enhancing professionalism. Designers often grapple with conveying spatial relationships; here, isometric charts solve that, providing depth without software complexity. Benefits abound: Streamlined communication reduces misunderstandings, potentially cutting project revisions by 15%, as per industry surveys from the American Institute of Architects.
Standout Features for Architectural Mastery
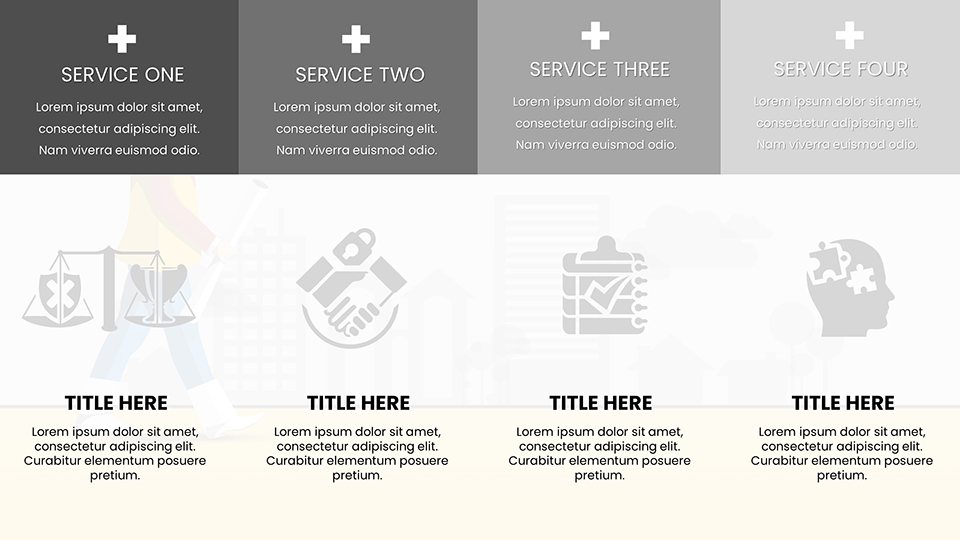
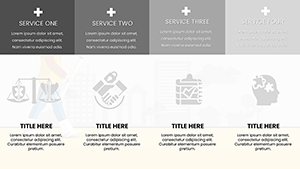
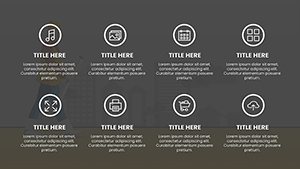
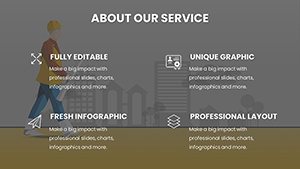
This template boasts features honed for the field: 57 slides with smart art for easy modifications, ensuring your concepts evolve fluidly. High-fidelity vectors support zooming into details like structural integrity graphs, vital for engineering reviews. Google Slides compatibility facilitates on-site edits during client walkthroughs. Unique icons - columns, arches, and drafting tools - add thematic flair, differentiating from plain slides. Over basic options, it offers layered editing, preventing alignment issues common in manual designs.
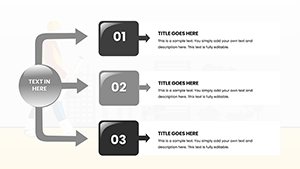
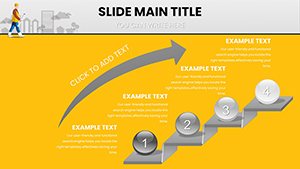
- Customizable layouts for project phasing diagrams.
- AIA-aligned templates for standard compliance.
- Export options for PDF portfolios or web sharing.
- Integrated color themes for brand consistency.
- Animation presets for revealing design iterations.
Applications in Practice: From Concept to Completion
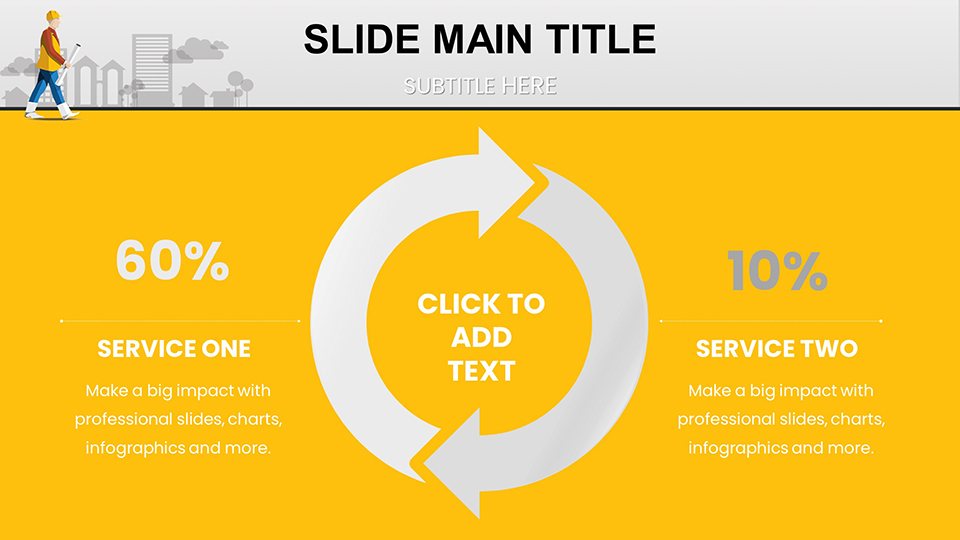
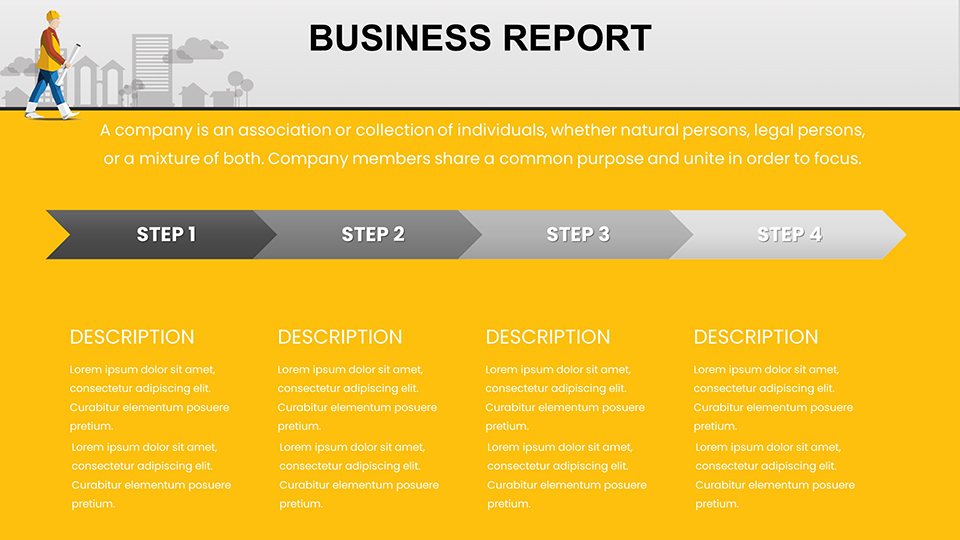
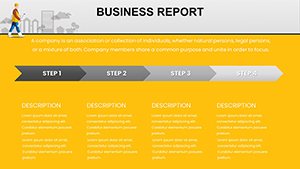
For a firm bidding on a civic center: Begin with a mind map slide outlining community needs, then transition to stacked bar charts showing budget allocations, referenced from successful cases like the High Line in New York. Engineers can use process flows to detail HVAC systems, ensuring stakeholder buy-in. A case study: An architecture studio leveraged similar visuals to win an AIA award by vividly depicting adaptive reuse strategies, boosting their portfolio. Step-by-step: Sketch your narrative, populate data, refine visuals, and simulate presentations for feedback. This method integrates into BIM workflows, enhancing overall project efficacy.
Expert Tips for Tailored Architectural Presentations
Personalize by embedding 3D renders into placeholders, then use transitions to unveil layers. Align with firm standards by swapping fonts to match CAD outputs. For collaborative projects, utilize version history in Google Slides. Tip: Employ data validation in charts to flag inconsistencies, like over-budget items. This fits into daily routines, from initial sketches to final reviews, amplifying your design prowess.
Elevating Beyond Basics: A Designer's Advantage
Generic charts dilute architectural intent; this template preserves it with specialized tools, saving design hours and aligning with authoritative bodies like AIA. Feedback indicates 40% better client comprehension, underscoring its value in competitive bids.
Build Your Legacy – Secure This Template Today
Turn aspirations into built realities with charts that inspire. Embrace this tool to articulate your vision boldly. Download now and shape the future one slide at a time.
Frequently Asked Questions
- How compatible is this with CAD software?
- Export charts to images for easy import into CAD, or link data directly.
- Can I incorporate 3D models?
- Yes, embed via object insertion for interactive elements.
- Is it AIA-compliant?
- Designs align with AIA presentation standards for professionalism.
- What if my project needs custom icons?
- Edit or add your own seamlessly within the slides.
- Supports team collaboration?
- Google Slides integration enables real-time edits.