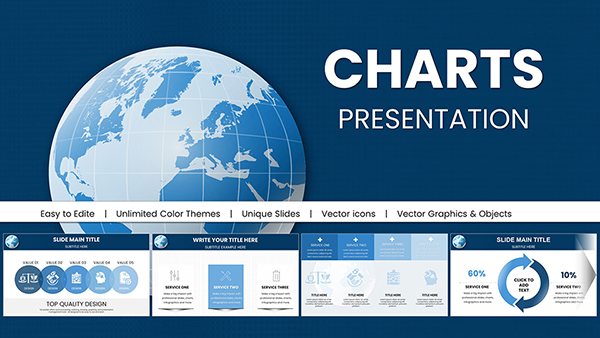
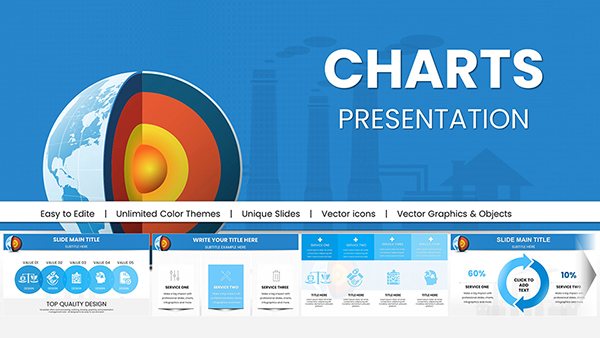
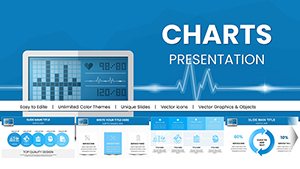
Healthcare PowerPoint Infographics: Master Medical Data Viz


Type: PowerPoint Charts template
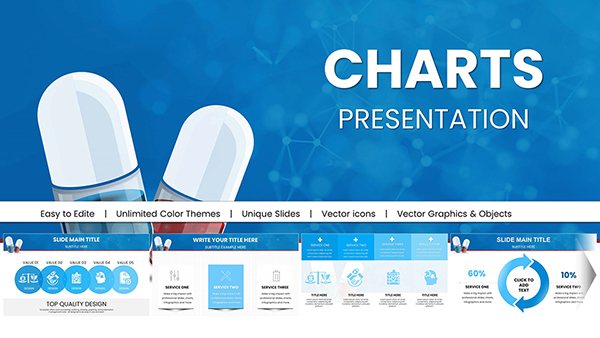
Category: Medicine - Pharma, Illustrations
Sources Available: .pptx
Product ID: PC00978
Template incl.: 49 editable slides
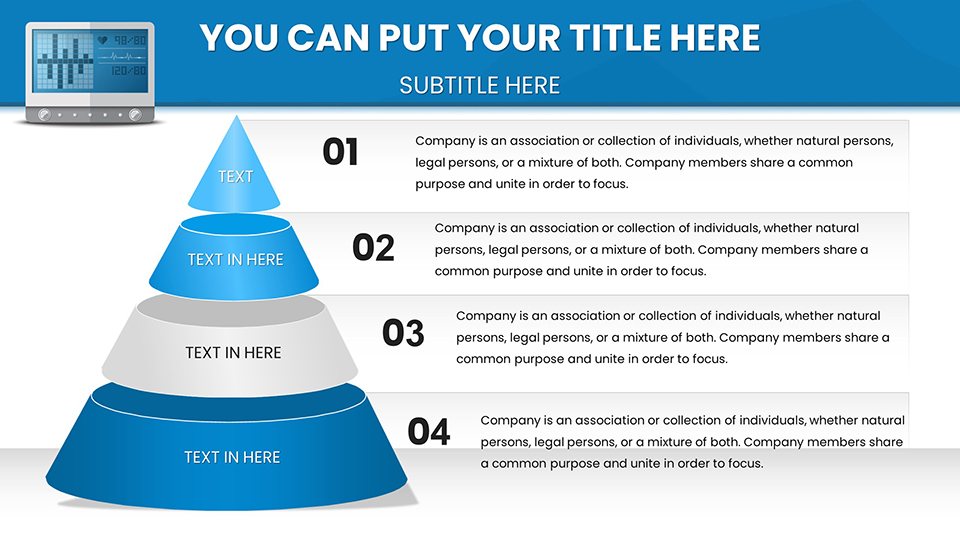
In the fast-paced world of healthcare, where every data point can influence life-changing decisions, our Medical Data Visualization PowerPoint Charts template emerges as a vital ally. Designed specifically for physicians, researchers, and public health officials, this collection of 49 editable slides demystifies complex datasets, turning them into intuitive infographics that foster understanding and innovation. From charting patient trajectories in oncology wards to mapping epidemic spreads in community health programs, these visuals draw inspiration from real initiatives like those in WHO reports or hospital quality improvement projects. Fully compatible with Microsoft PowerPoint and Google Slides, it allows effortless tweaks to align with your insights, ensuring compliance with standards like HIPAA through secure, customizable formats. Move beyond overwhelming spreadsheets; harness visuals that illuminate trends, enhance team dialogues, and ultimately elevate patient care with clarity and confidence.
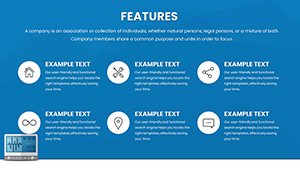
Core Features Driving Healthcare Insights
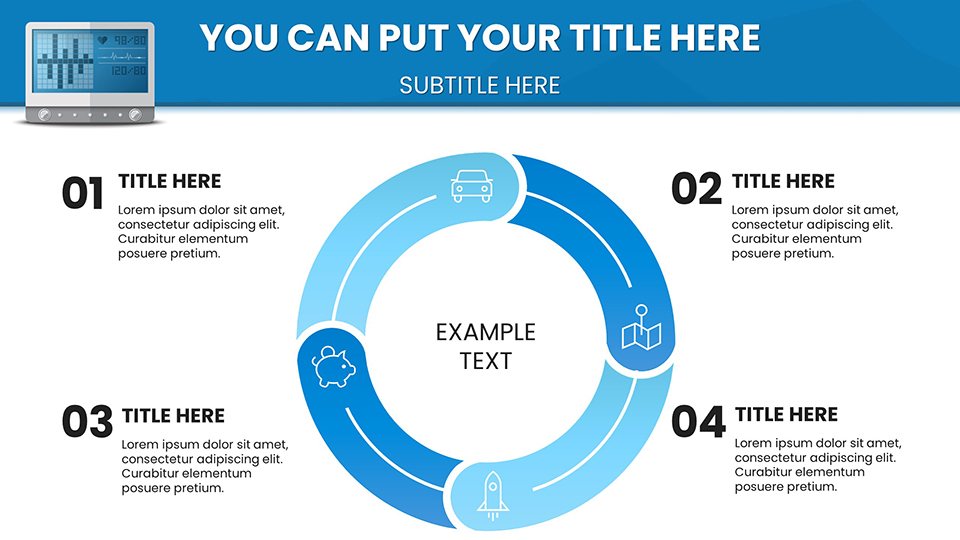
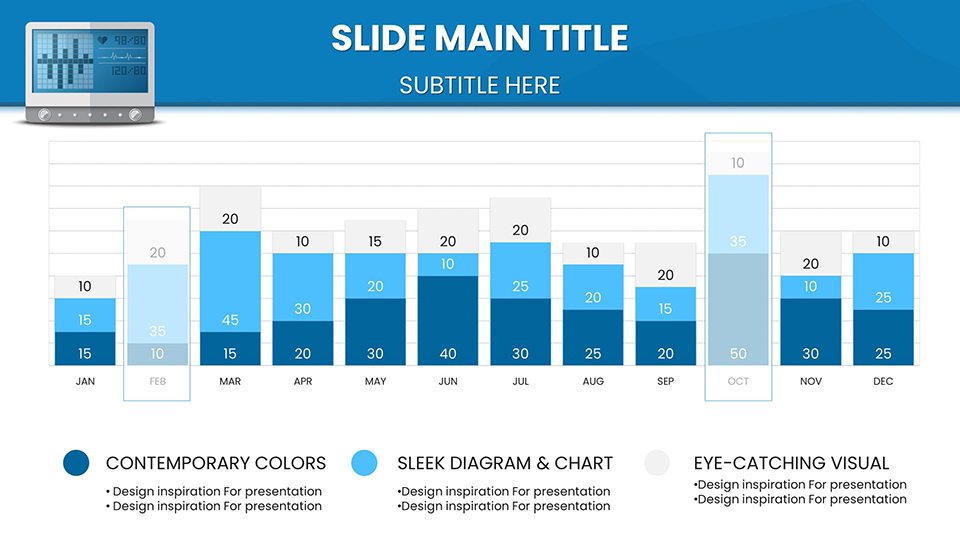
This template's strength lies in its pharma and illustrative focus, offering tools like flowcharts for treatment protocols or scatter plots for correlation studies. Imagine a dashboard slide aggregating vital signs with color-coded alerts, mirroring electronic health record systems used in leading clinics. These designs adhere to evidence-based visualization principles, such as those from the Journal of the American Medical Association, prioritizing readability and accuracy. Customization extends to thematic colors - subtle blues for calm analyses - adjustable fonts for accessibility, and flexible grids for multi-device viewing.
Seamless Adaptation for Clinical Needs
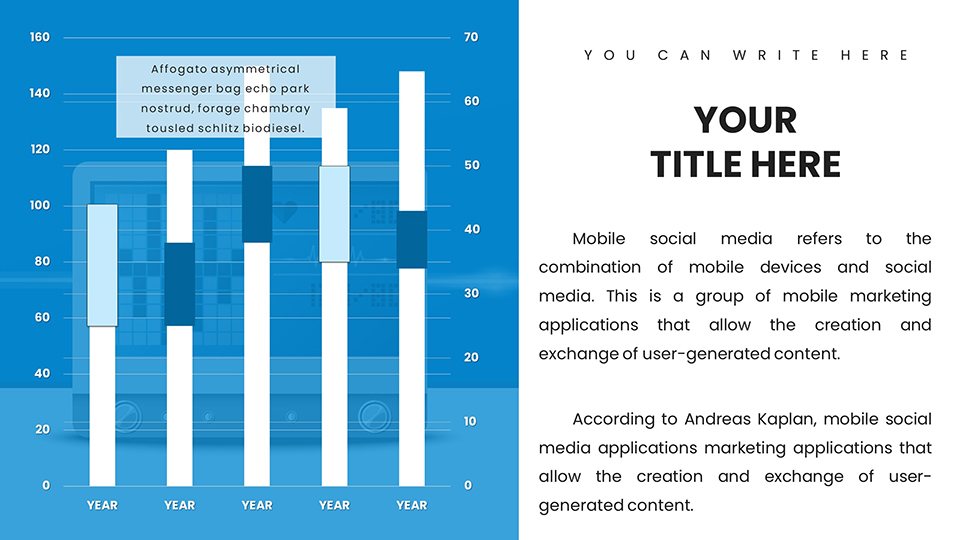
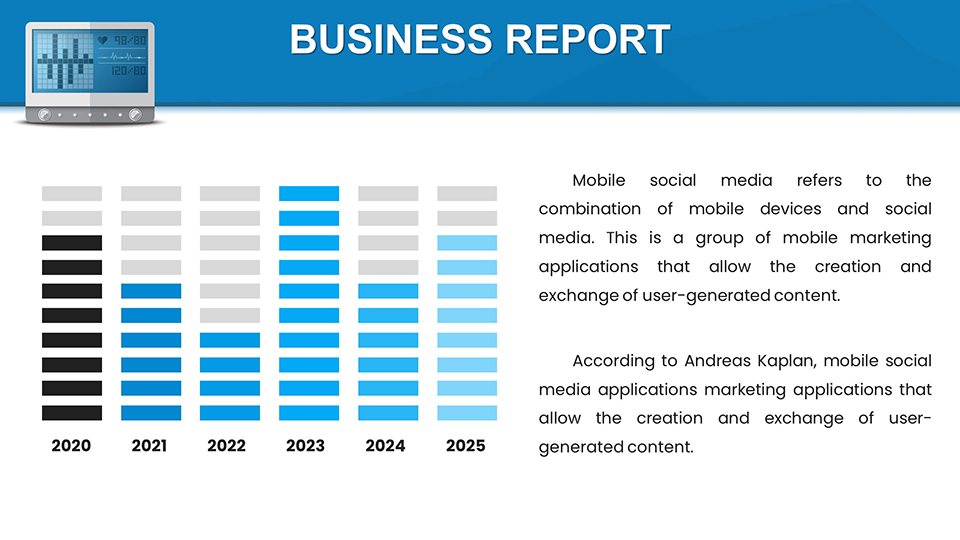
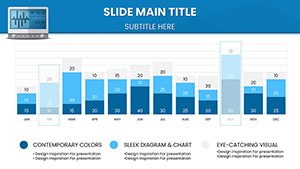
Editing is straightforward: Input trial data into a bar graph to compare efficacy rates, or modify a timeline to track disease progression. This outpaces native PowerPoint, where custom builds risk errors in scaling or alignment; pre-optimized elements here ensure precision. Healthcare pros appreciate the time savings, often redirecting efforts to patient interactions. High-resolution vectors support detailed zooms, crucial for educational seminars or board reviews.
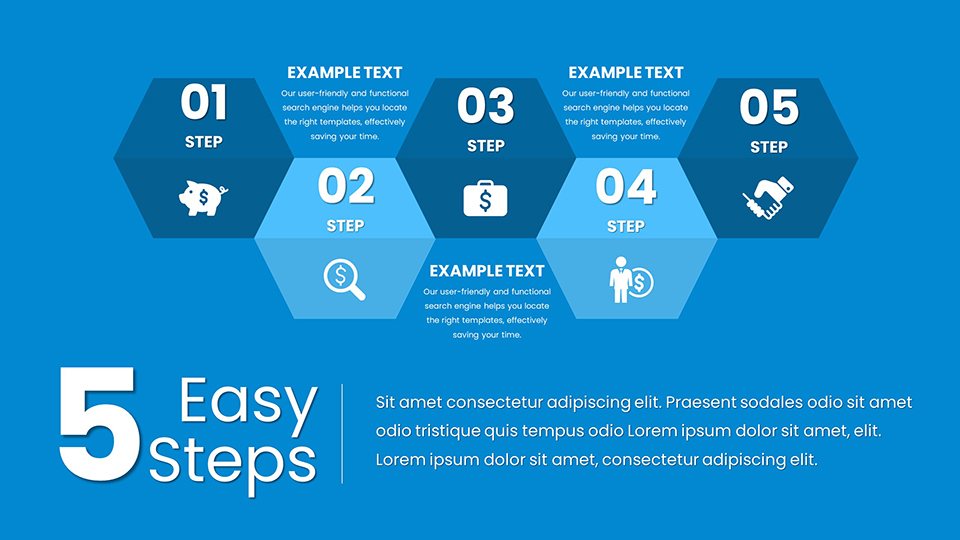
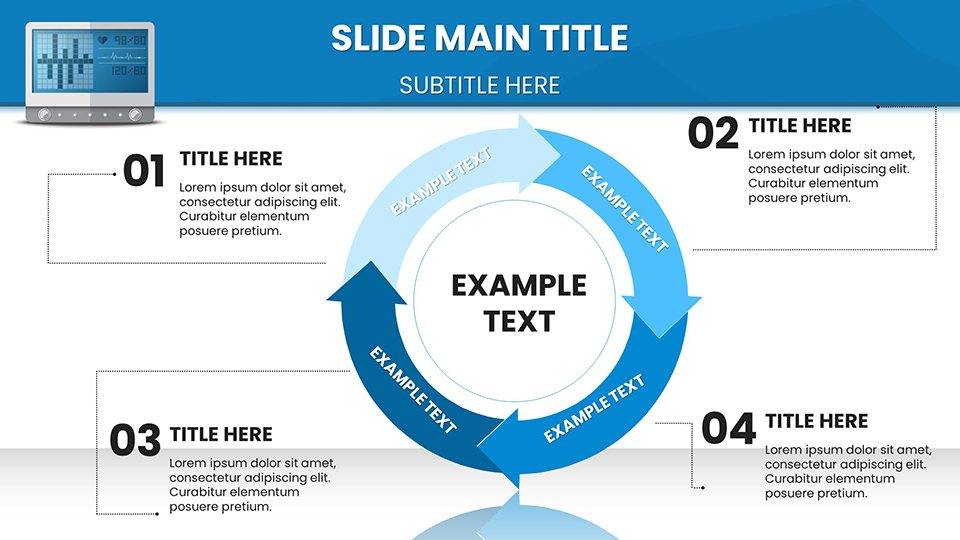
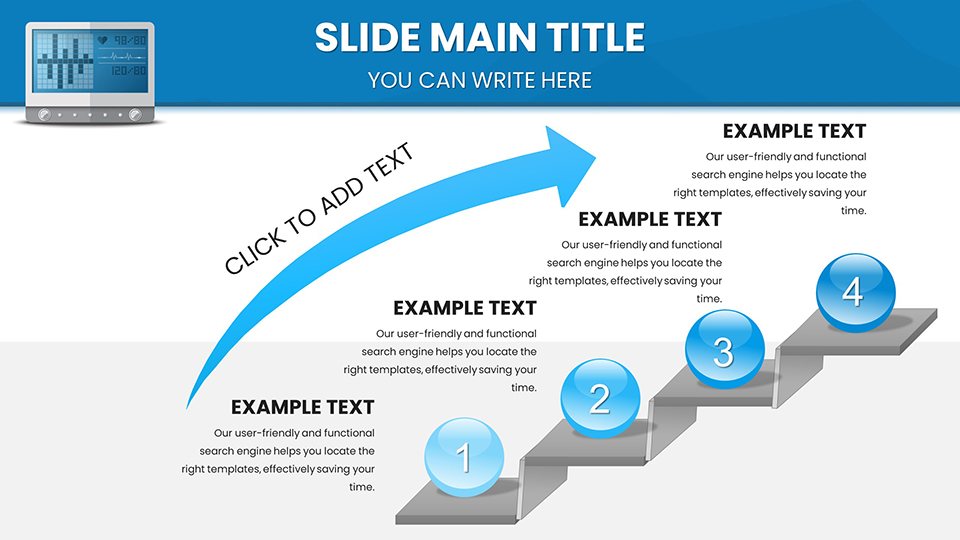
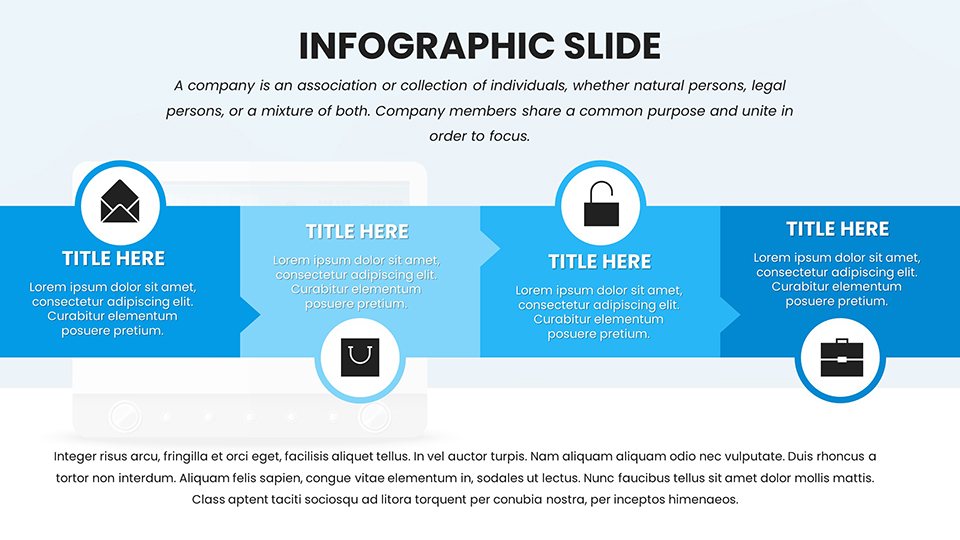
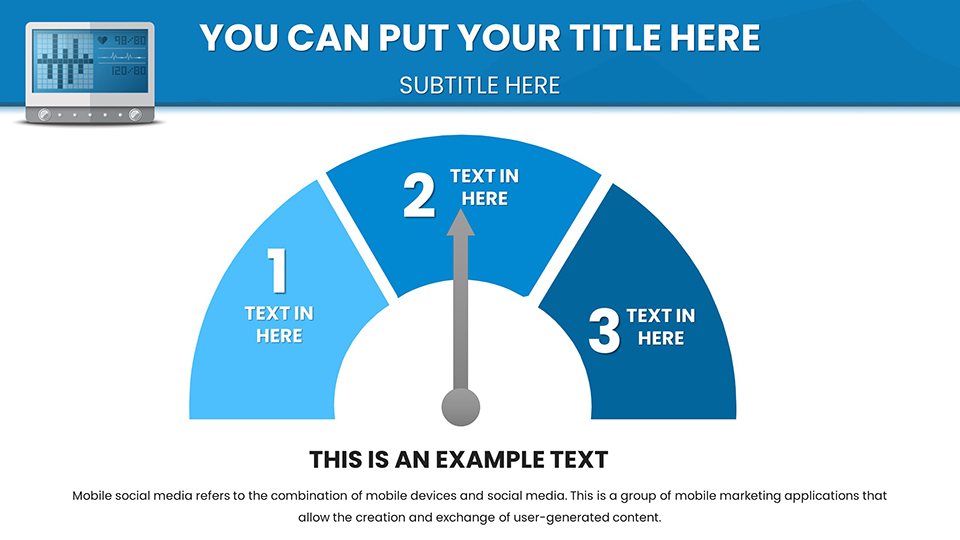
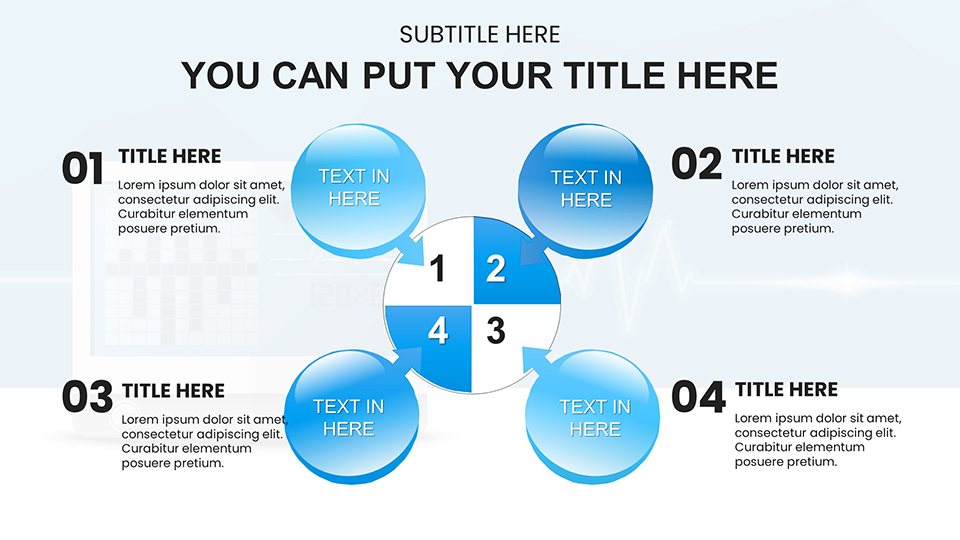
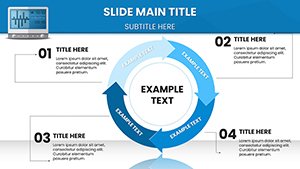
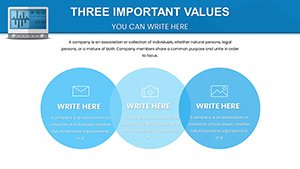
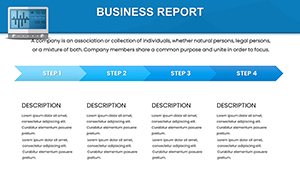
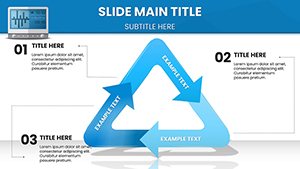
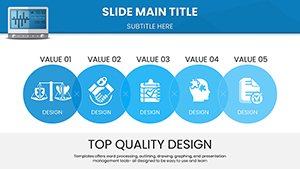
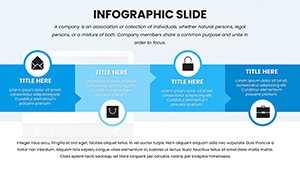
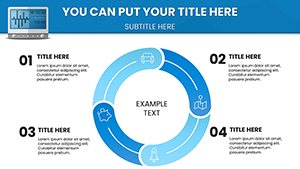
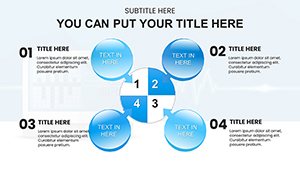
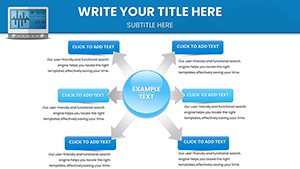
- Flowcharts for Processes: Detail patient journeys from diagnosis to recovery.
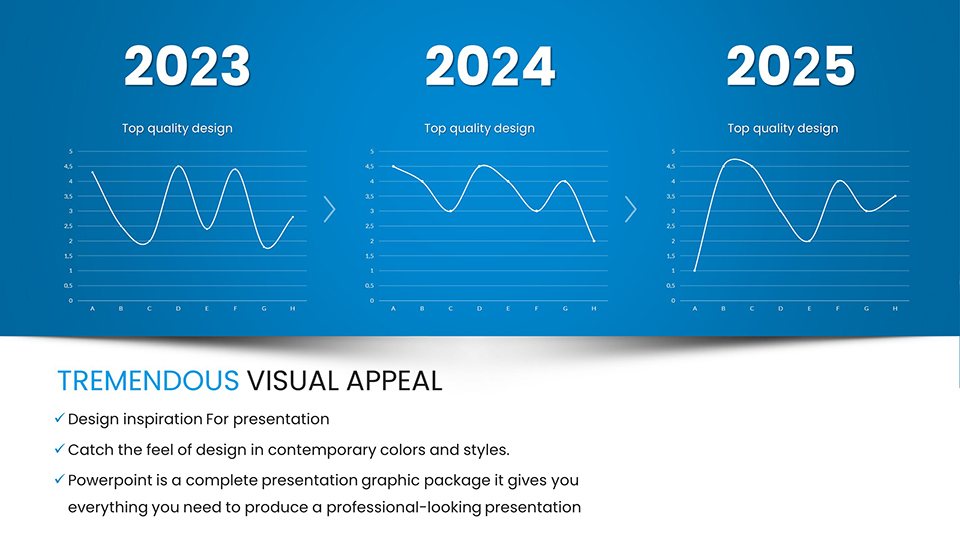
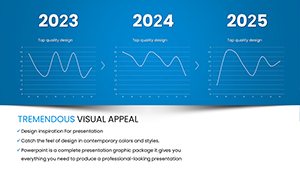
- Scatter Plots for Trends: Identify correlations in symptoms and outcomes.
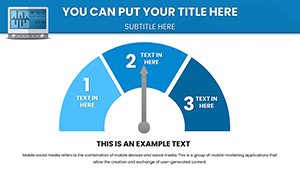
- Heatmaps for Patterns: Visualize infection hotspots in epidemiological data.
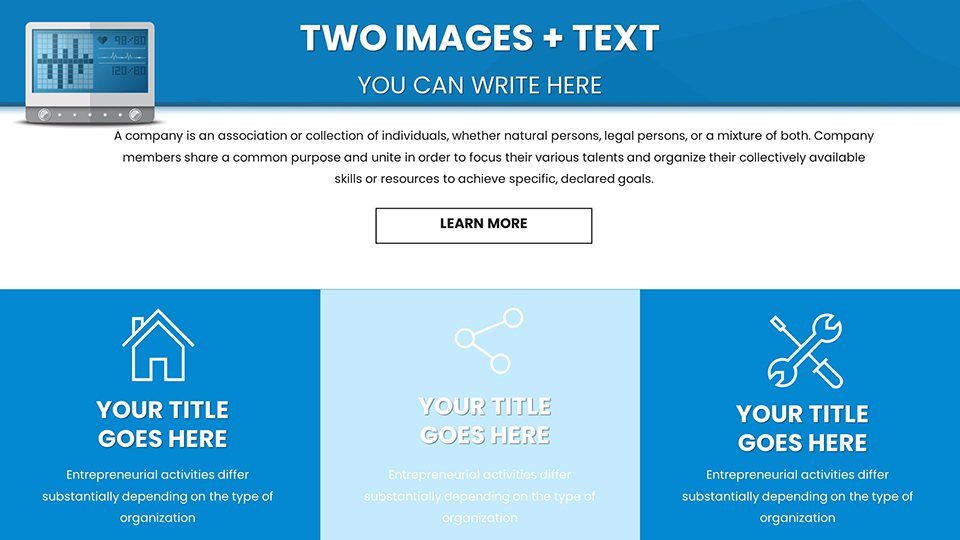
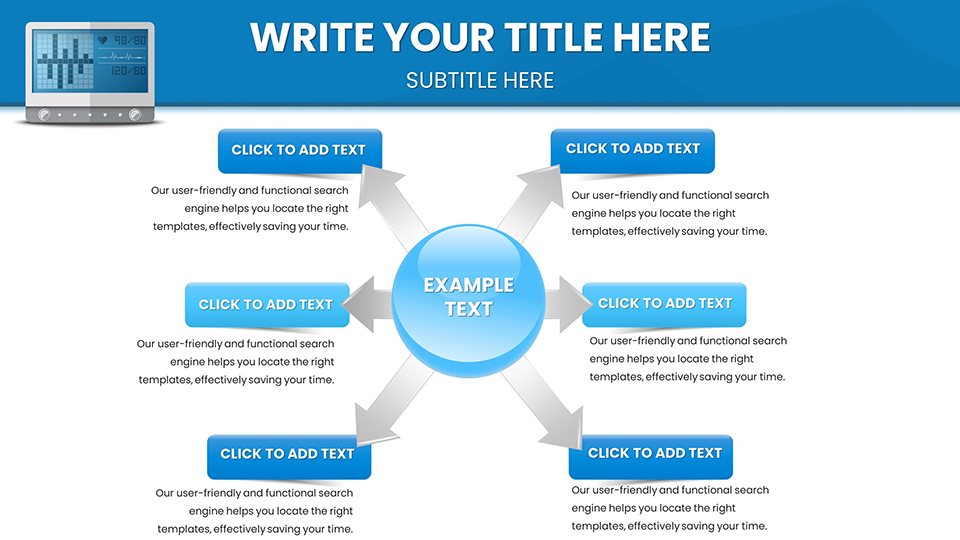
- Iconic Illustrations: Use medical symbols to enhance narrative flow.
Applications in Medical Practice and Research
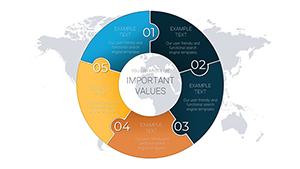
Practically, it excels in diverse settings. A researcher might use pie charts to breakdown demographic impacts in clinical trials, akin to FDA submission visuals that accelerated approvals. For hospital teams, line graphs track recovery metrics, facilitating multidisciplinary rounds. Public health experts leverage maps for resource allocation, echoing strategies in pandemic responses.
Step-by-Step Use Case: Presenting Trial Results
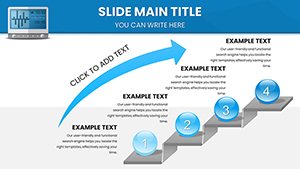
- Frame the Context: Start with an overview infographic summarizing study aims.
- Input Data Layers: Populate charts with metrics, using legends for clarity.
- Highlight Key Findings: Employ highlights to draw eyes to significant trends.
- Discuss Implications: Integrate comparative graphs for evidence-based conclusions.
- Refine for Audience: Adjust visuals for stakeholders, then rehearse delivery.
This structured approach promotes informed discussions, surpassing simplistic slides by incorporating narrative depth from medical storytelling techniques. It builds trust through transparent data handling, aligning with ethical guidelines.
Tips for Integrating into Healthcare Workflows
Embed these into routines by syncing with EHR software for auto-updates. In telehealth, the clean designs ensure legibility on varied devices. Tip: Use subtle animations to unfold data stories, similar to medical conference keynotes, maintaining engagement without distraction. Prioritize accessibility with alt text and contrasts, meeting ADA standards. From bedside consultations to policy briefings, these infographics empower precise communication, driving advancements in care delivery.
As healthcare evolves, so must our tools for sharing knowledge. With the Medical Data Visualization PowerPoint Charts, you're poised to lead with insight. Embrace this resource - download and illuminate your medical narratives now.
Frequently Asked Questions
How editable are the medical charts?
Completely customizable, including data, colors, and layouts to match your specific healthcare datasets and requirements.
Compatible with Google Slides?
Yes, .pptx format ensures smooth functionality in Google Slides for collaborative medical reviews.
Best for what types of medical data?
Suited for patient stats, trial results, and epidemiological patterns, with flexibility for various analyses.
Supports evidence-based presentations?
Indeed, designed to highlight trends and outcomes clearly, aiding decision-making in clinical settings.
Advantages over standard PowerPoint?
Offers specialized medical illustrations and precise layouts for professional, accurate visualizations.
Any privacy considerations?
Templates are secure; always anonymize data per HIPAA when sharing.