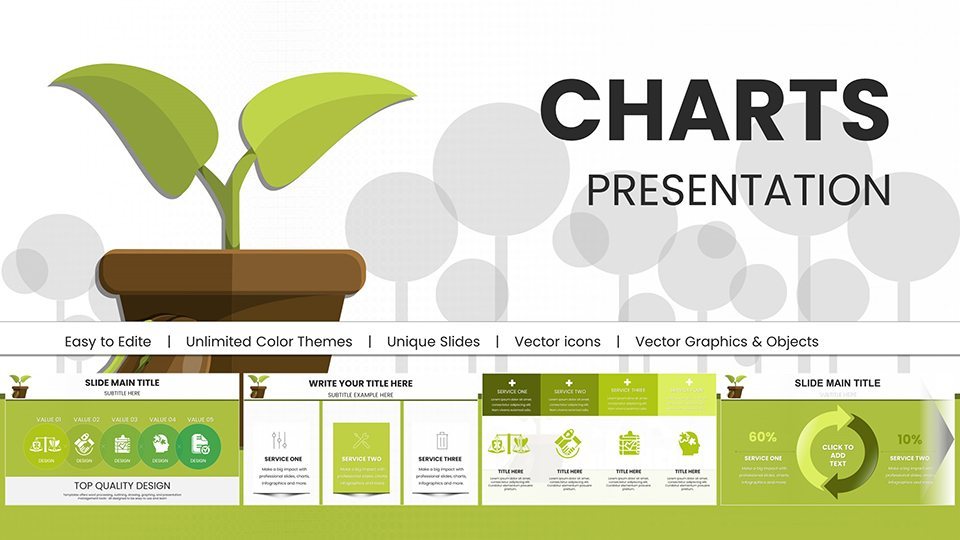
Building a Greener Tomorrow: Eco-Friendly Growth with Sustainable Future PowerPoint Charts


Type: PowerPoint Charts template
Category: Illustrations
Sources Available: .pptx
Product ID: PC00967
Template incl.: 59 editable slides
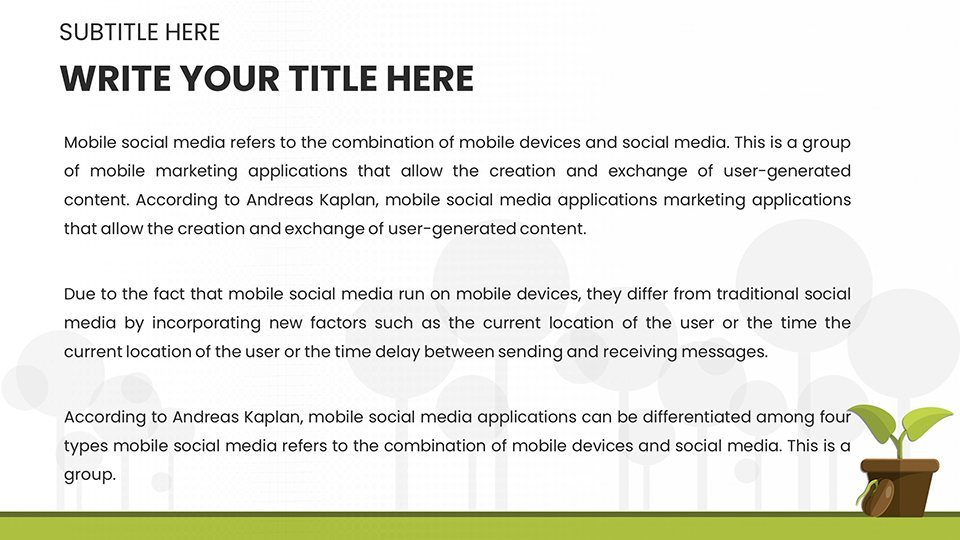
Envision a world where every presentation plants the seed for positive environmental change. Our Sustainable Future PowerPoint charts template empowers you to do just that, offering a robust suite of 59 editable slides brimming with infographics that highlight eco-friendly practices and long-term sustainability strategies. Tailored for environmental advocates rallying communities, business leaders integrating green initiatives into corporate plans, and educators teaching the next generation about responsible resource management, this template turns abstract concepts like carbon footprints and renewable transitions into compelling visual stories. Say goodbye to dull data dumps; instead, use vibrant graphs to showcase progress toward net-zero goals, drawing from real benchmarks like those set by the Paris Agreement. With easy customization, you can adapt these slides to fit your narrative, whether it's a seminar on circular economies or a boardroom pitch for sustainable investments, ensuring your audience leaves motivated to act.
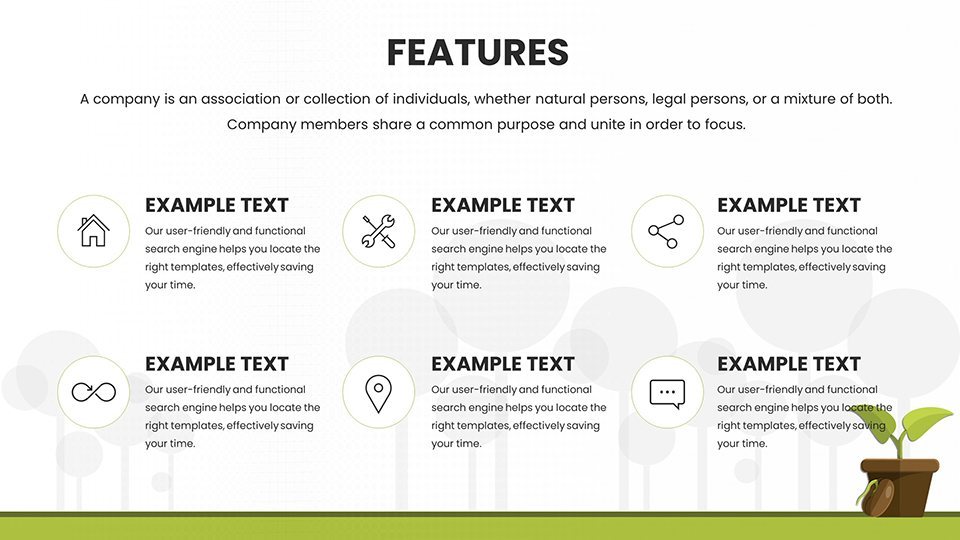
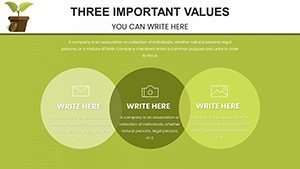
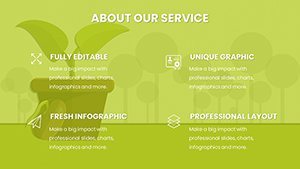
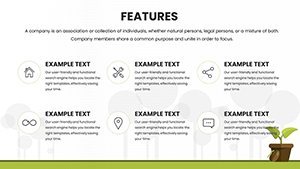
Essential Features for Impactful Sustainability Narratives
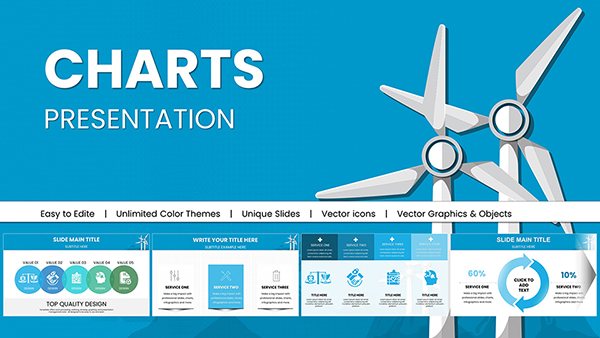
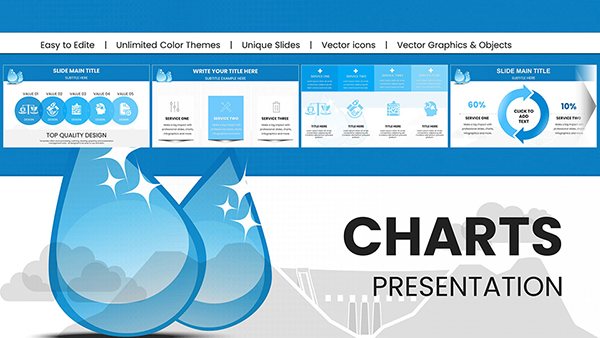
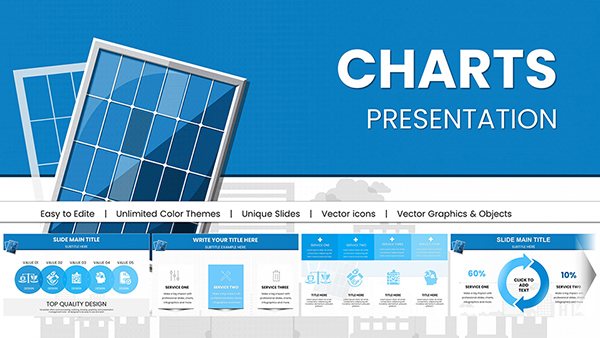
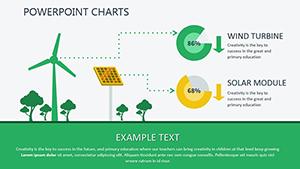
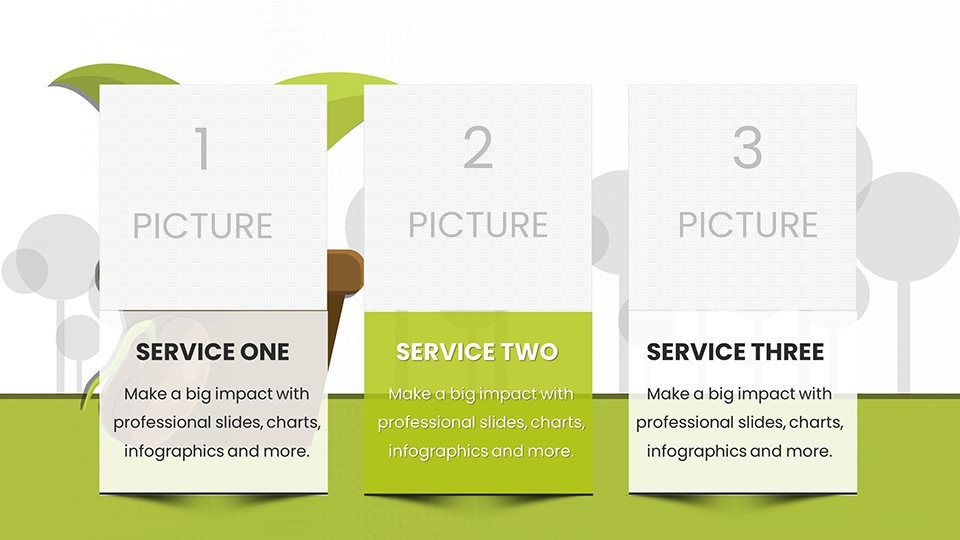
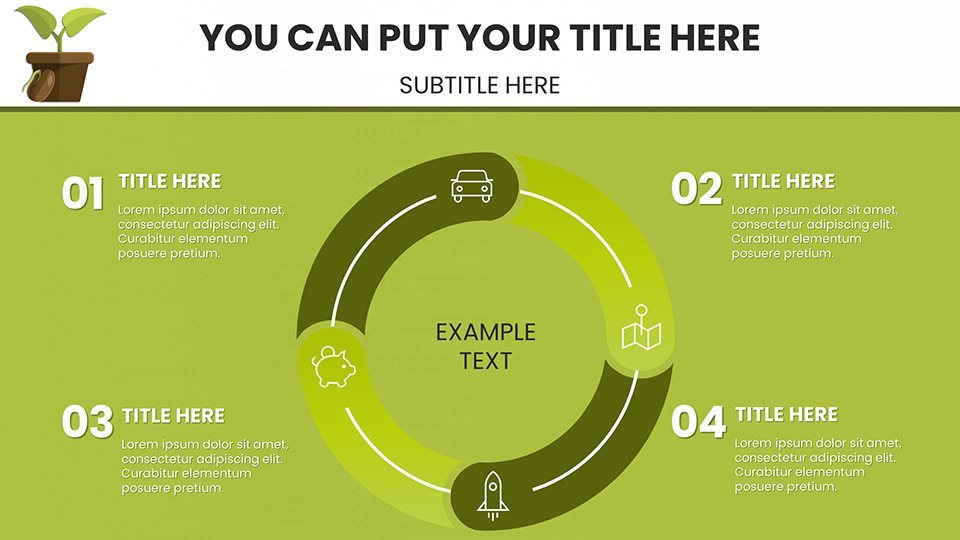
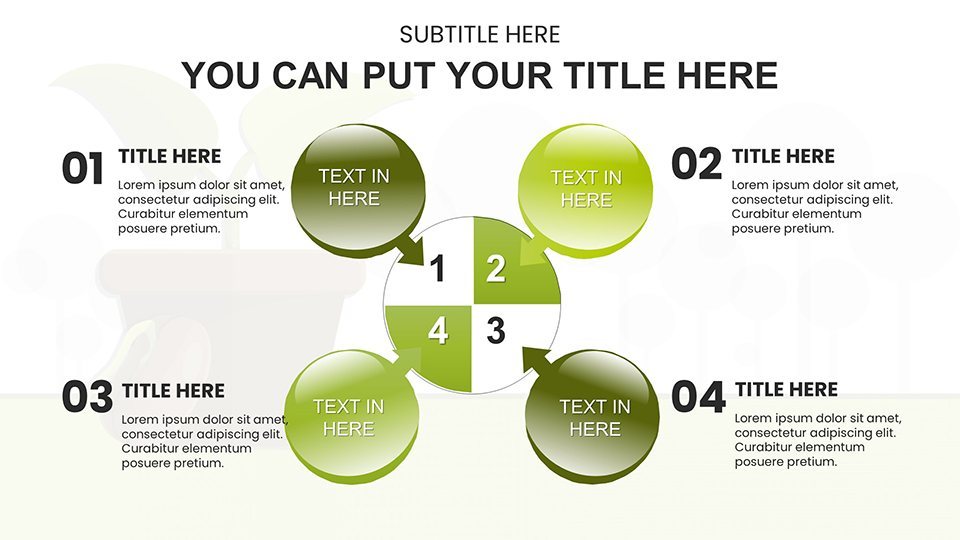
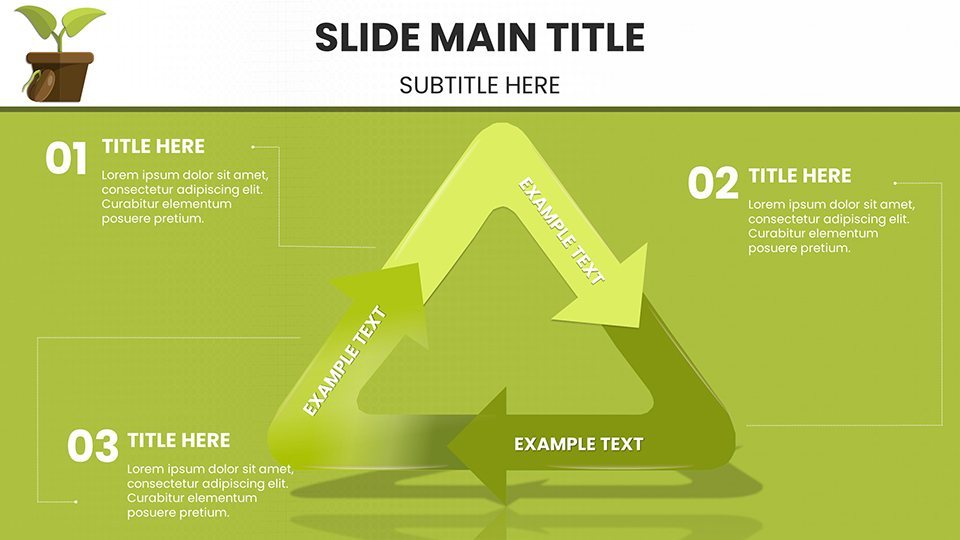
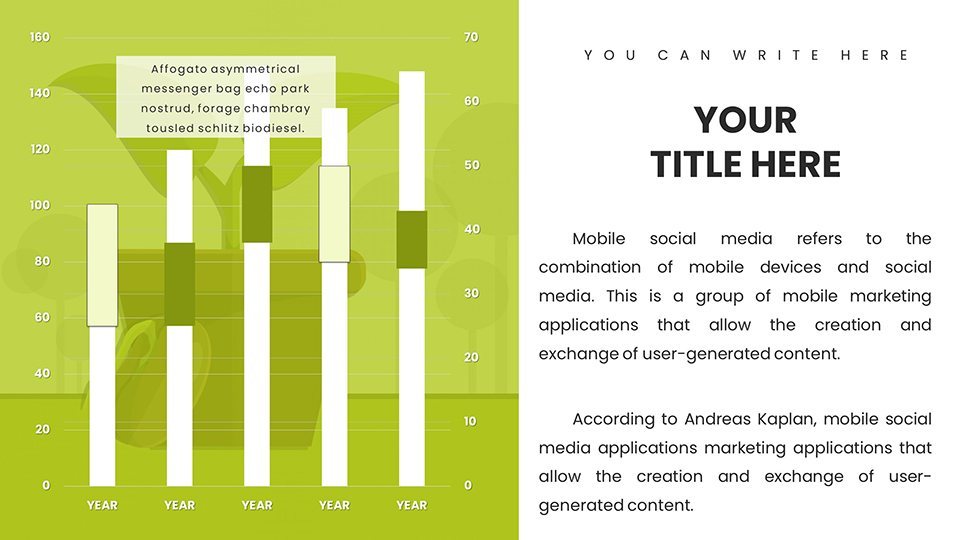
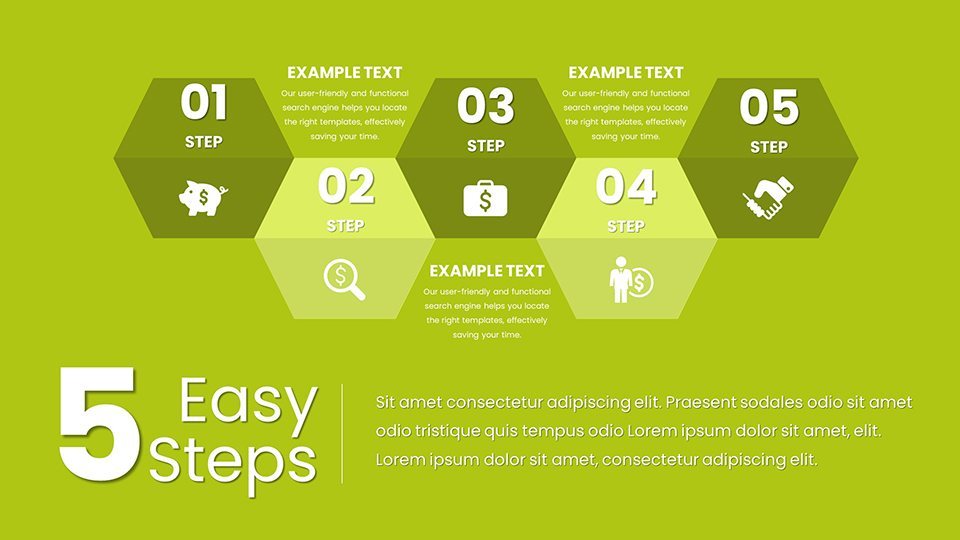
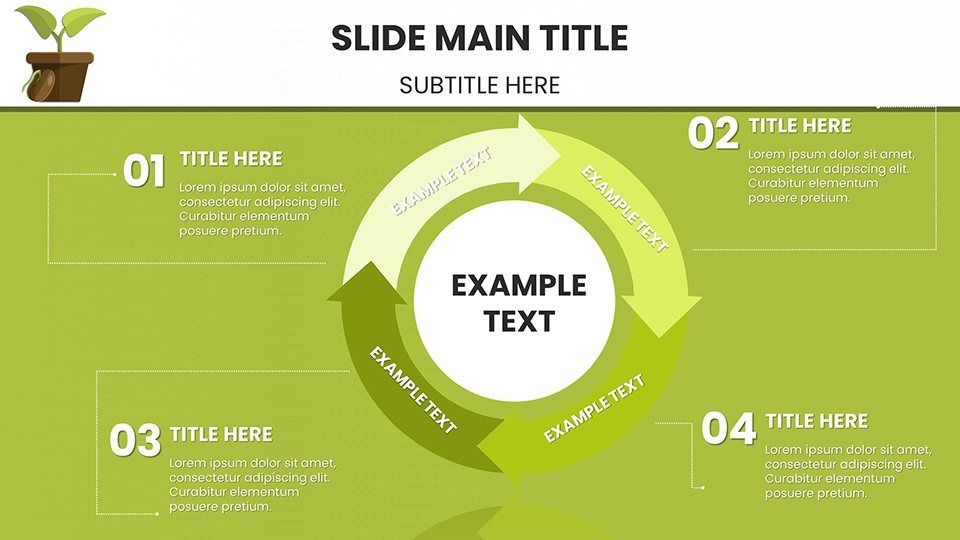
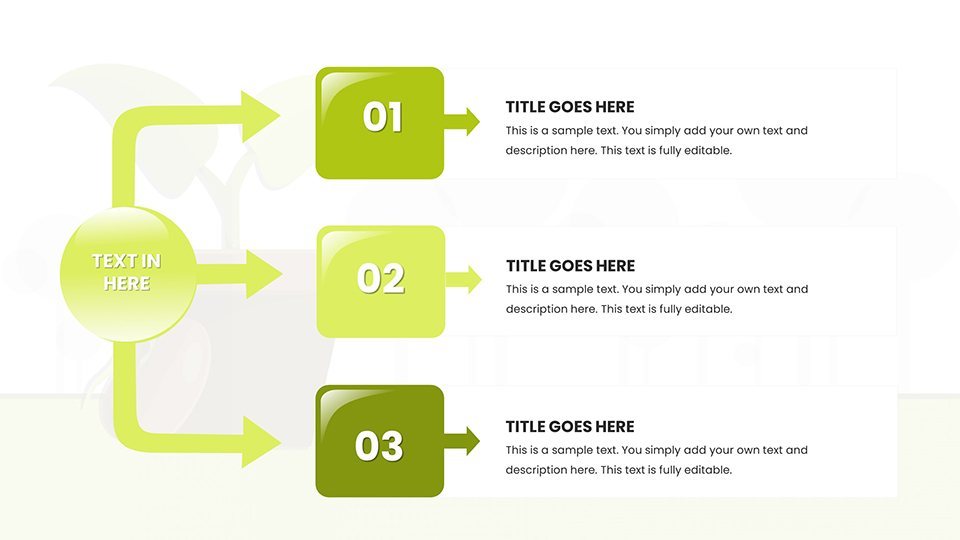
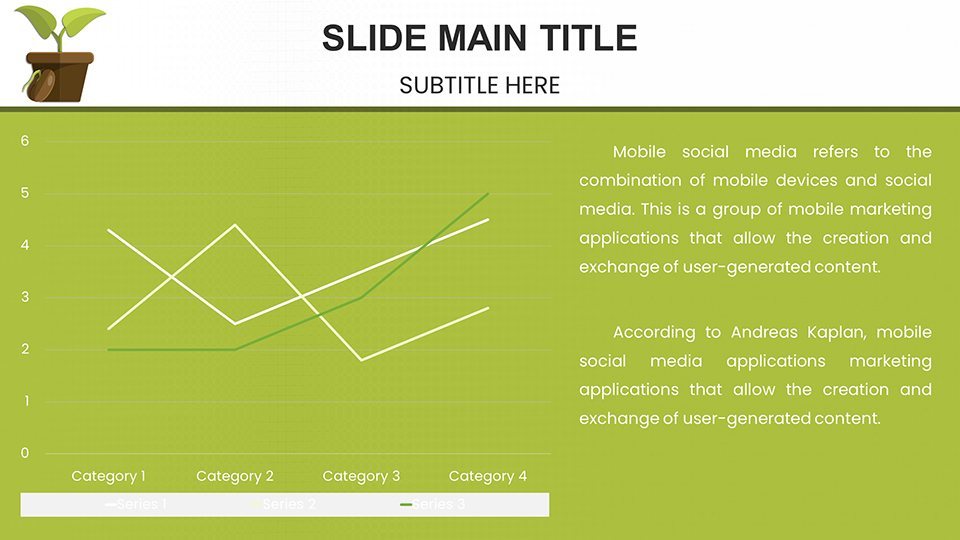
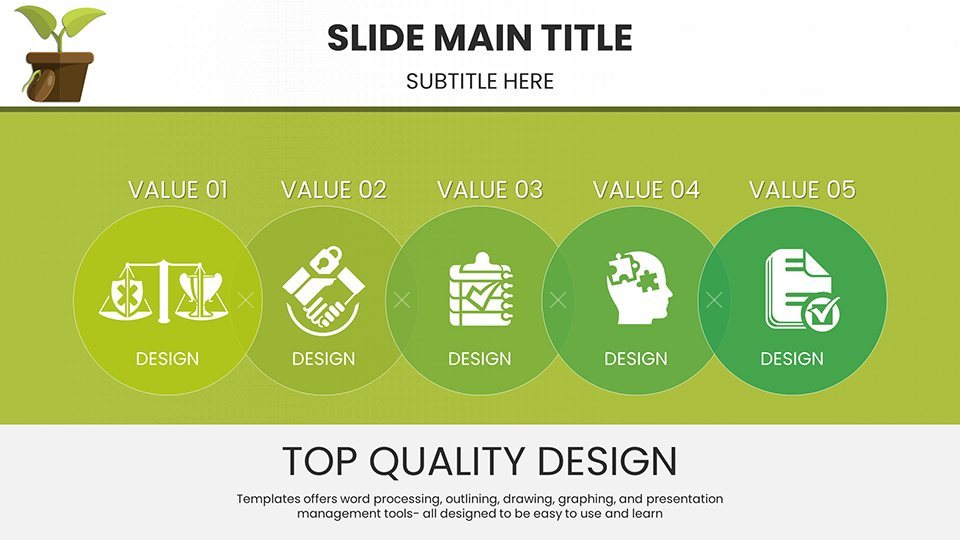
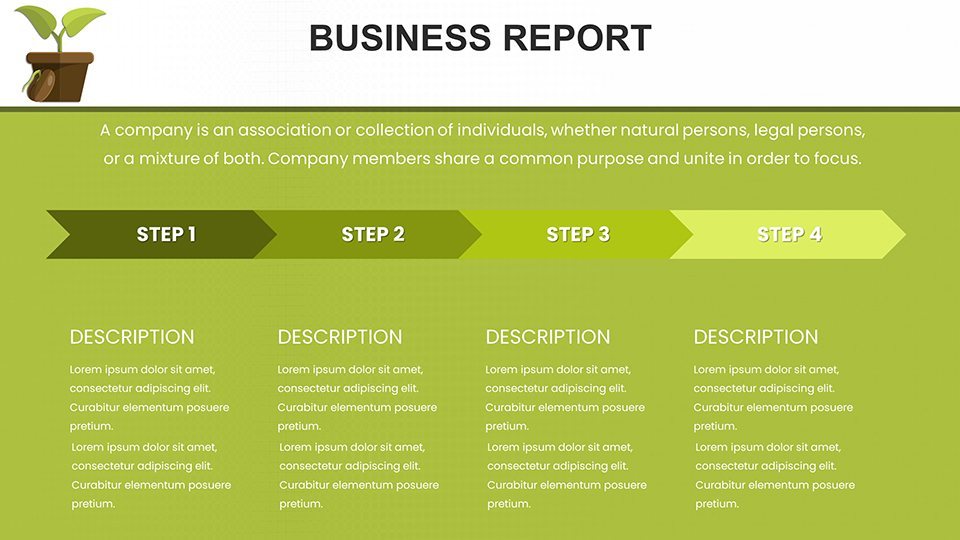
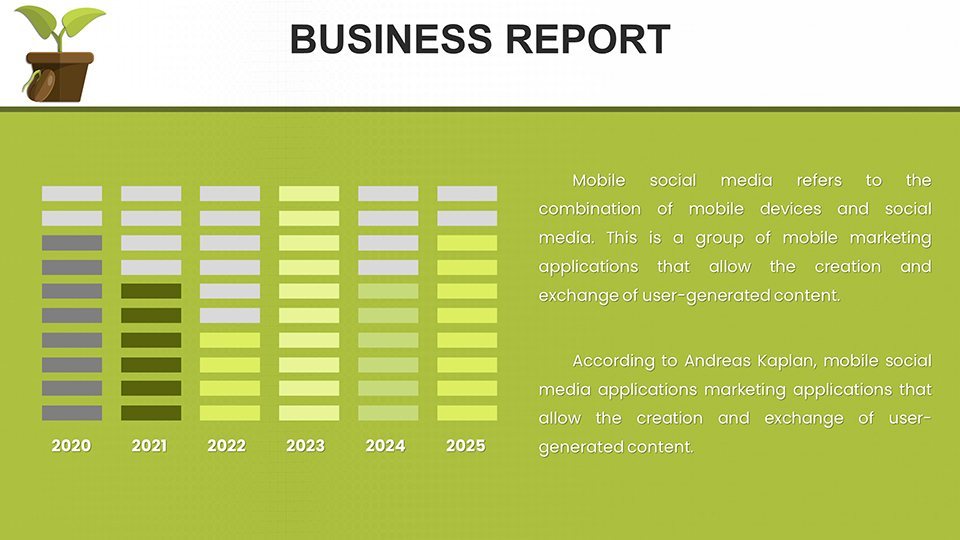
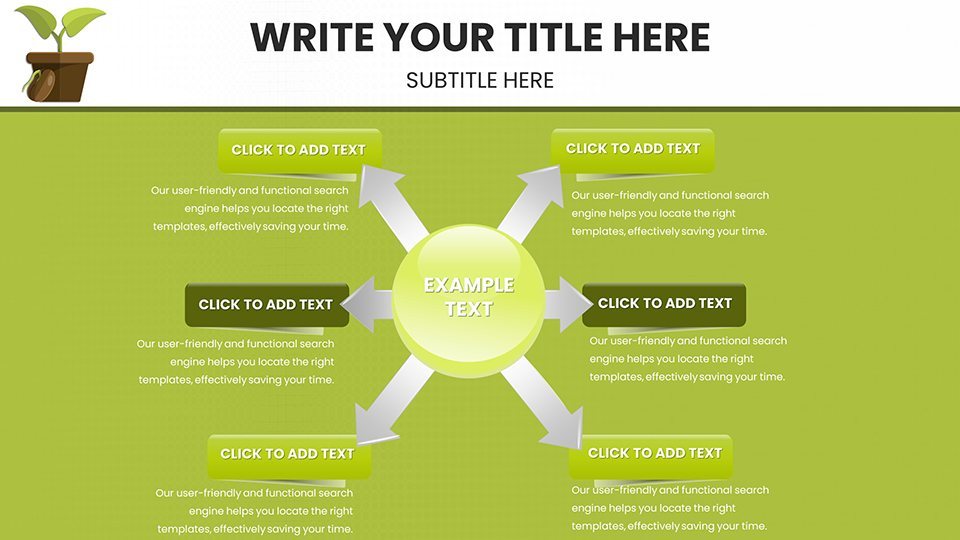
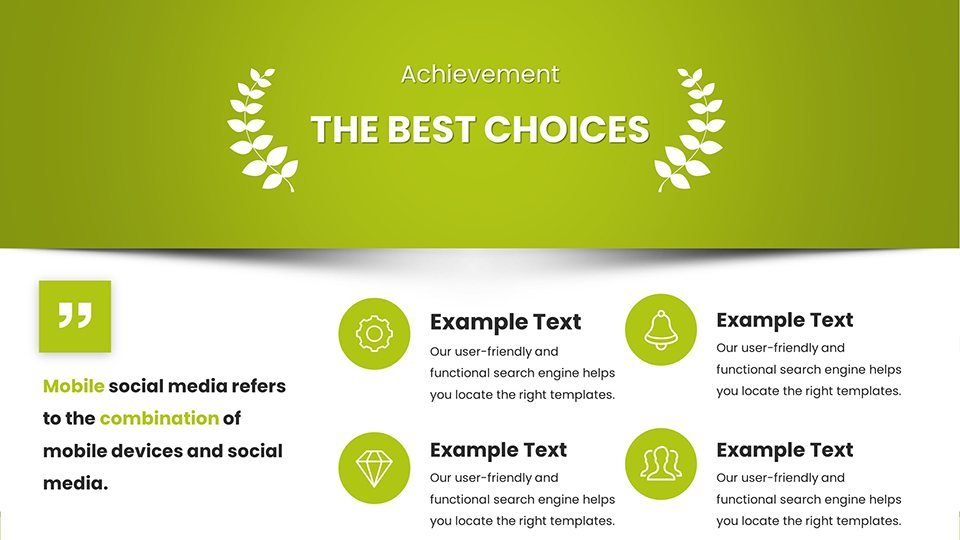
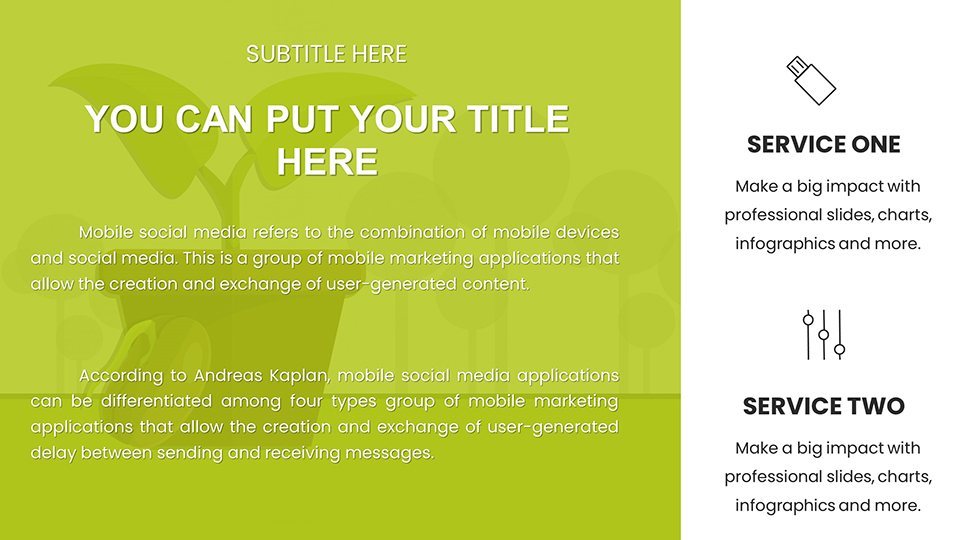
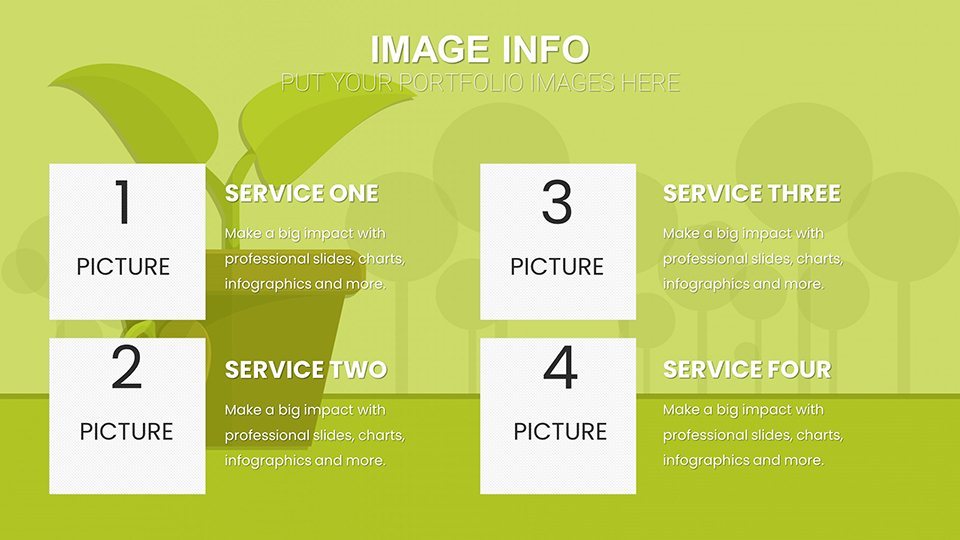
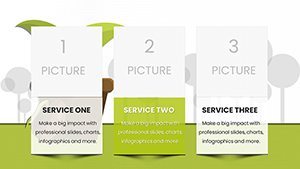
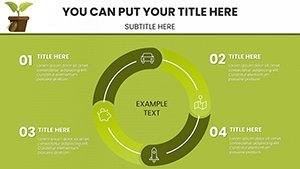
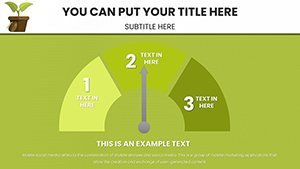
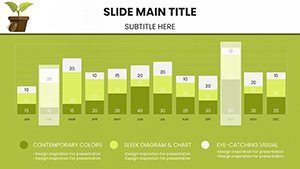
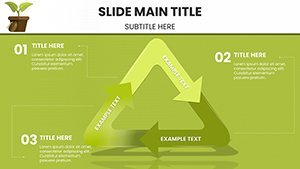
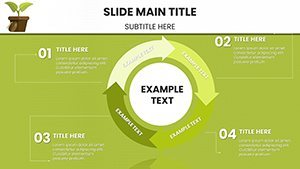
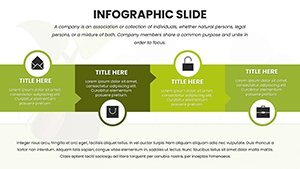
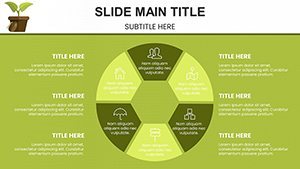
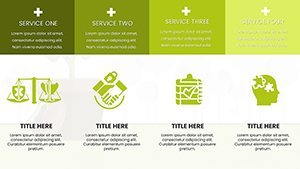
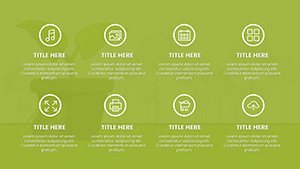
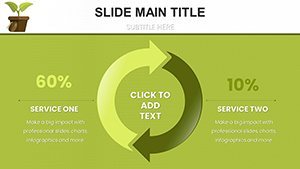
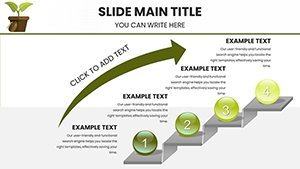
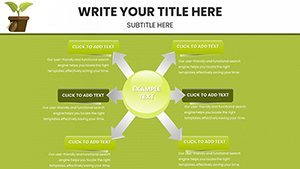
What sets this template apart is its focus on actionable, visually engaging elements. Infographics include tree-like growth diagrams symbolizing economic expansion without environmental harm, cycle charts for waste reduction processes, and bar comparisons of traditional vs. green energy sources. These are designed with sustainability in mind - using eco-inspired color palettes like forest greens and ocean blues to subconsciously reinforce your message.
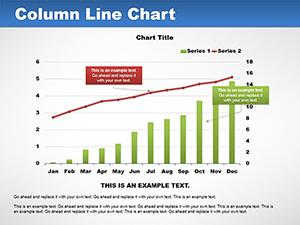
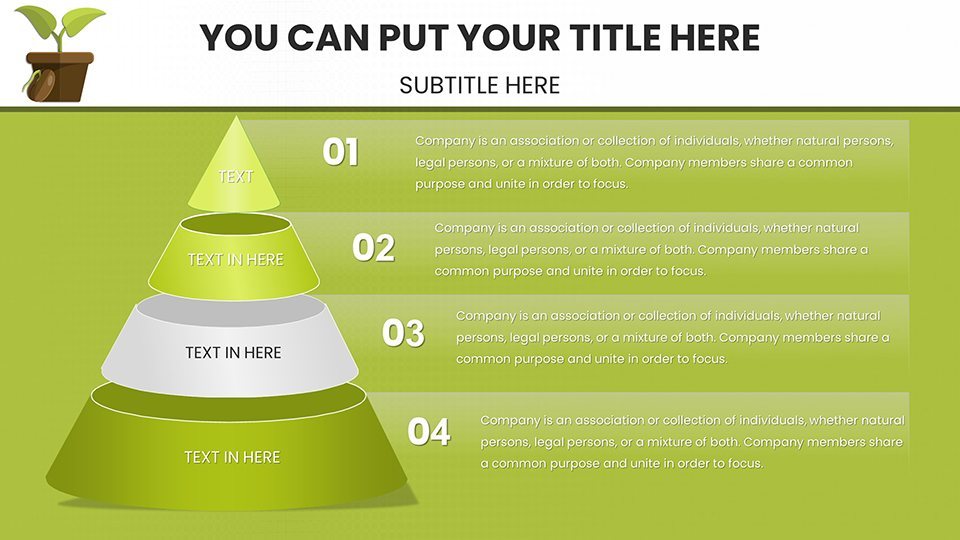
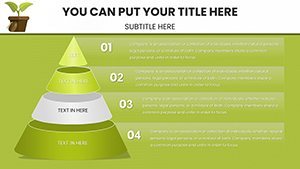
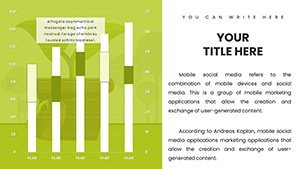
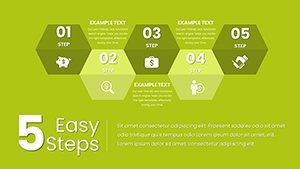
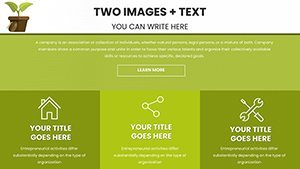
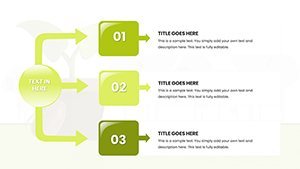
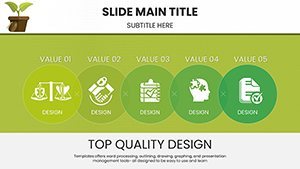
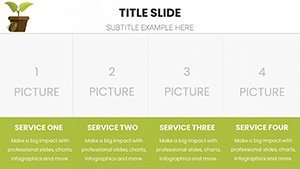
- Data-Driven Visuals: Input your metrics into editable charts, such as pyramid structures showing sustainability hierarchies from individual actions to global policies.
- Versatile Customization: Modify layouts to include case studies, like Unilever's sustainable sourcing that reduced water usage by 50% as per their 2023 report.
- Seamless Integration: Compatible with PowerPoint's latest features, including morph transitions for smooth idea flows.
- Broad Topic Coverage: From biodiversity preservation to urban green spaces, cover it all with pre-designed slides that align with ISO 14001 environmental standards.
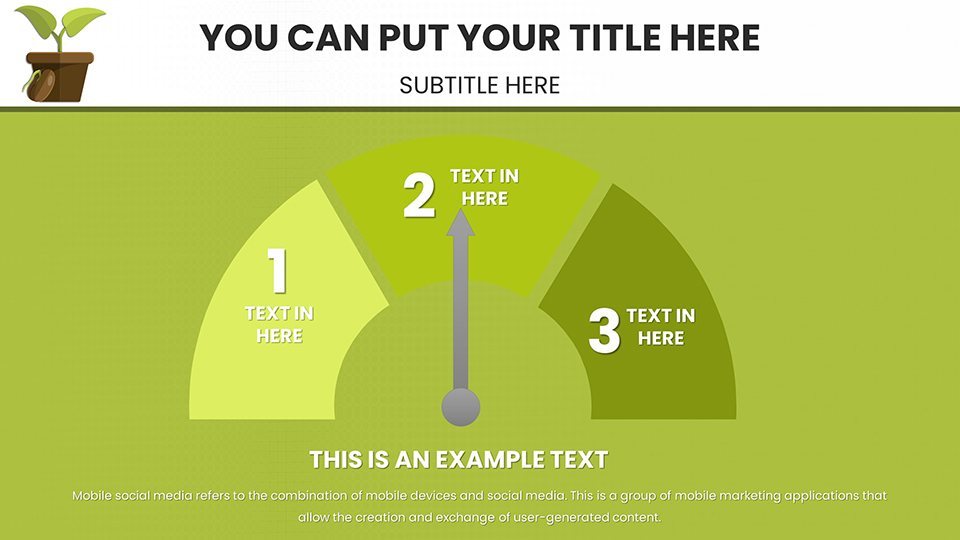
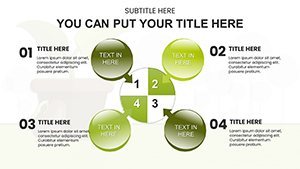
These features solve key challenges, like making dense reports digestible. For consultants, funnel charts can illustrate client journeys toward sustainability certification, boosting engagement rates.
In-Depth Slide Exploration: Crafting Your Eco-Story
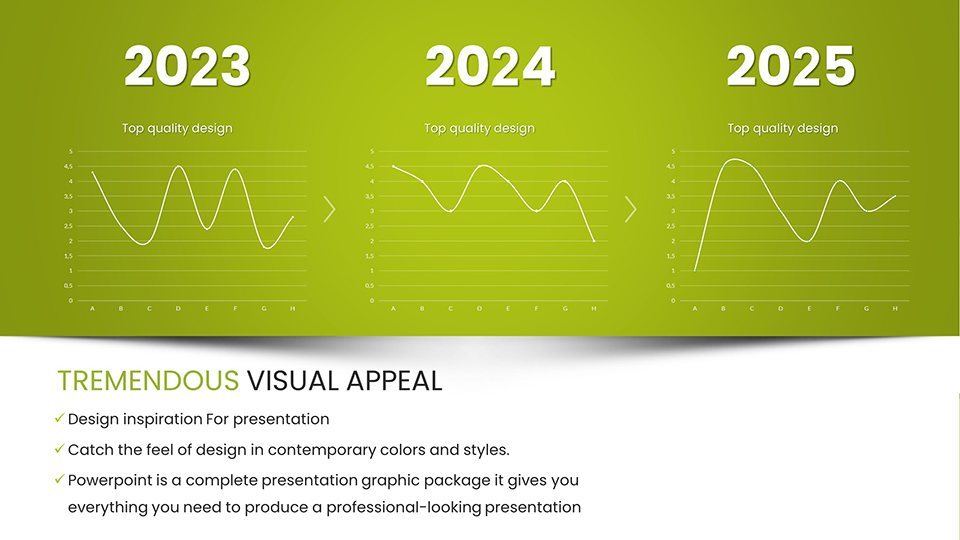
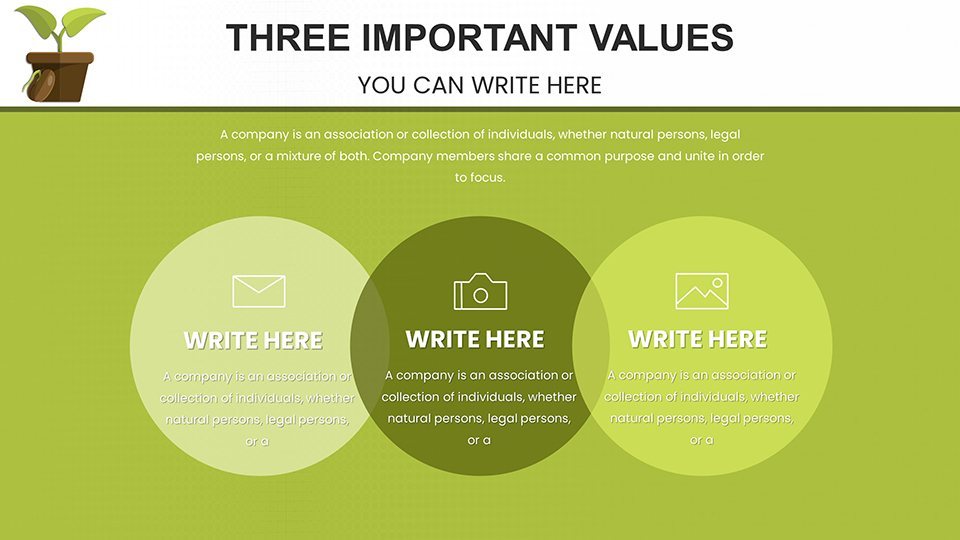
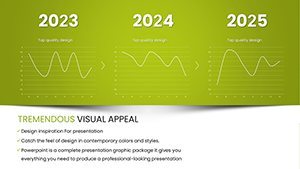
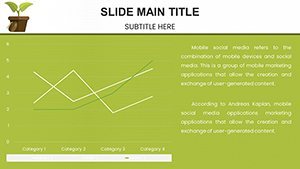
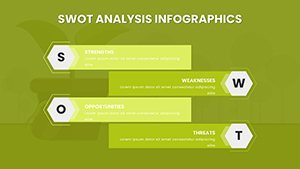
Begin with Slide #5, a dashboard overview of global sustainability indicators, editable to feature KPIs like renewable energy adoption rates from IRENA data. Progress to Slide #15, where Venn diagrams overlap economic, social, and environmental pillars, perfect for explaining triple bottom line concepts. In the core section, slides 20-35 delve into specifics: heat maps for deforestation trends, line graphs tracking emission reductions post-Kyoto Protocol, and sankey diagrams for energy flows in smart cities.
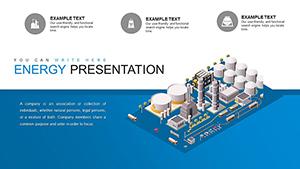
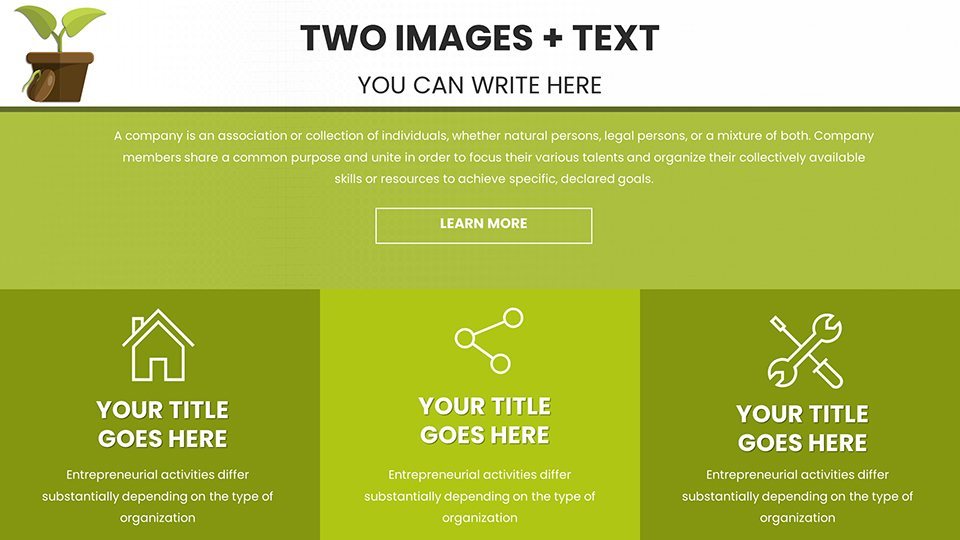
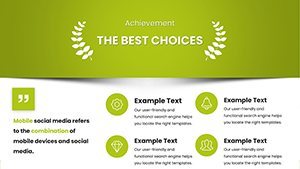
For advanced users, slides 40-50 offer scenario planning tools, like decision trees for policy impacts - think branching paths for carbon tax implementations. Conclude with motivational slides featuring icons of wind turbines and solar farms, paired with CTAs urging immediate steps toward sustainability.
Practical Use Cases: Driving Real Change
In corporate environments, use this for ESG reporting, as seen in companies like Patagonia, where visual aids helped secure stakeholder buy-in for 100% renewable operations. Educators might adapt it for curricula aligned with Next Generation Science Standards, using bubble charts to show population growth's environmental strain. Non-profits can pitch grants with Gantt charts outlining project timelines for rewilding efforts, similar to those by The Nature Conservancy.
Pro Tips to Amplify Your Green Message
Enhance effectiveness with these insights: Use contrasting colors for before-and-after sustainability scenarios to highlight transformations. Embed hyperlinks to resources like EPA guidelines for deeper dives. Test presentations for mobile compatibility, ensuring remote audiences stay engaged.
- Align visuals with audience values: For businesses, emphasize ROI; for activists, focus on ethical imperatives.
- Incorporate multimedia: Add video clips of successful green projects via embedded links.
- Measure impact: Follow up with surveys to refine future slides based on feedback.
Such strategies can turn passive listeners into active participants in sustainability efforts.
Superior to Standard Tools: Why This Template Wins
Unlike generic PowerPoint charts, ours are thematically unified, preventing mismatched designs that dilute your message. With 59 slides, it's a comprehensive toolkit, far exceeding free options' limitations, and fully optimized for collaboration in shared drives.
Trust in its quality - download now and lead the charge toward a sustainable future with confidence.
Frequently Asked Questions
How customizable are the sustainability infographics?
All charts are 100% editable, enabling you to update data, colors, and layouts to suit your specific needs.
Is this template suitable for non-profits?
Yes, it's ideal for grant proposals and awareness campaigns, with visuals that emphasize impact.
Does it support data from external sources?
Absolutely, easily import CSV files or manually enter data from reports like those from the UN.
What software is required?
Compatible with Microsoft PowerPoint; no additional software needed.
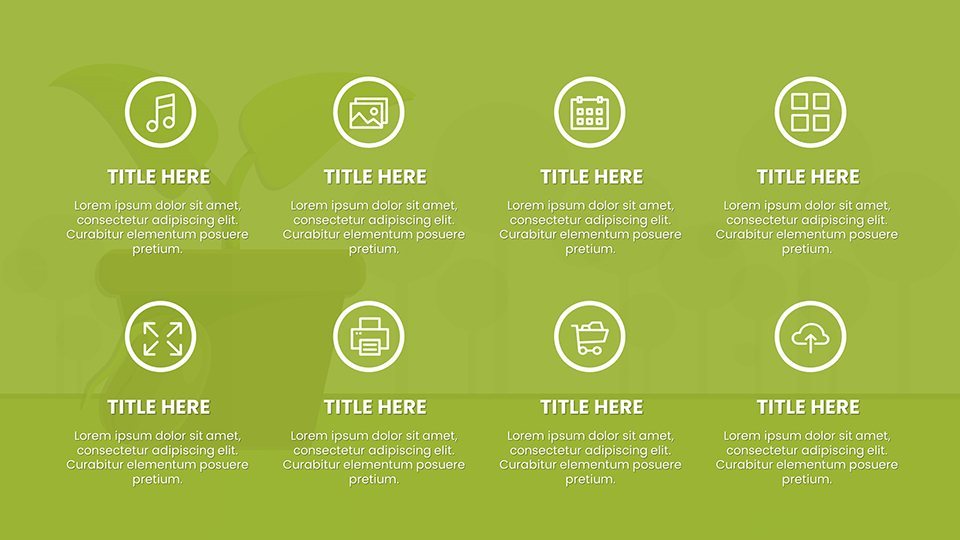
Are there eco-themed icons included?
Yes, a library of green icons enhances the sustainability focus.
Can I add my branding?
Certainly, integrate logos and color schemes effortlessly.