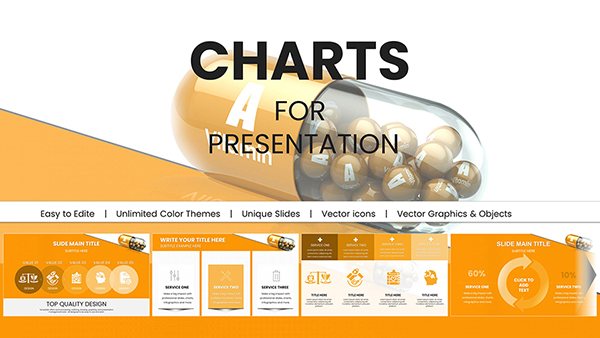
Spleen and Blood Cell PowerPoint Charts: Hematology Mastery


Type: PowerPoint Charts template
Category: Medicine - Pharma
Sources Available: .pptx
Product ID: PC00962
Template incl.: 59 editable slides
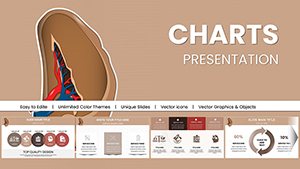
In the realm of hematology and immunology, where the spleen's role in blood filtration and immune response is pivotal, effective visualization is key to knowledge transfer. Our Spleen and Blood Cell PowerPoint Templates are crafted for healthcare specialists, researchers, and educators aiming to dissect complex topics like erythrocyte production or splenic sequestration with finesse. Featuring 59 editable slides, this set equips you to create presentations that are not only informative but transformative.
Envision illustrating the spleen's architecture in a grand rounds session, using layered diagrams to show red pulp versus white pulp functions, or charting blood cell lifecycles in a lecture. Anchored in guidelines from the American Society of Hematology (ASH), these visuals promote accurate depictions that enhance trustworthiness. It's a resource that bridges theory and practice, helping audiences connect dots in conditions like anemia or lymphoma.
Distinguishing from vanilla slides, our template uses specialized palettes - crimsons for blood cells, grays for splenic tissues - to aid quick recognition. Institutions using analogous tools have noted improved comprehension, as per feedback from medical journals emphasizing visual aids in learning.
Essential Features for In-Depth Hematological Depictions
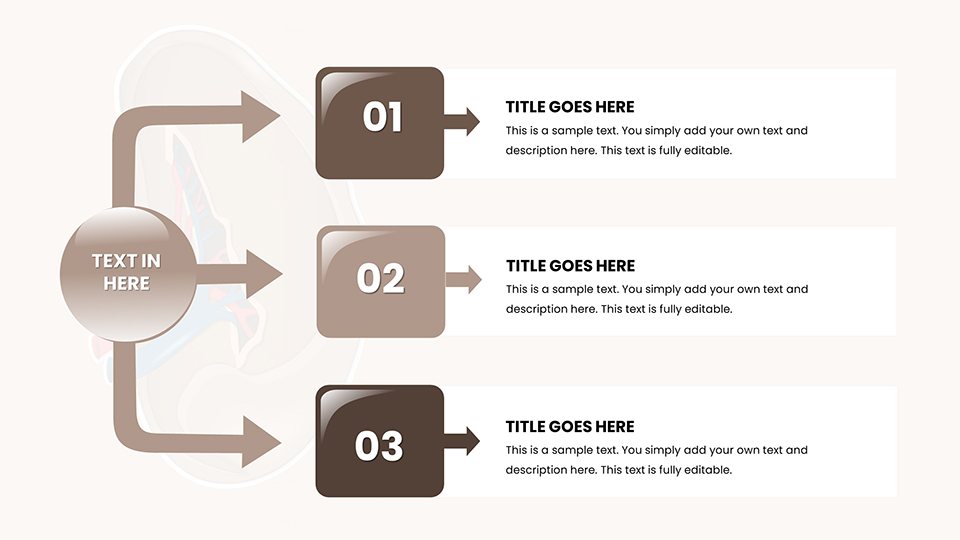
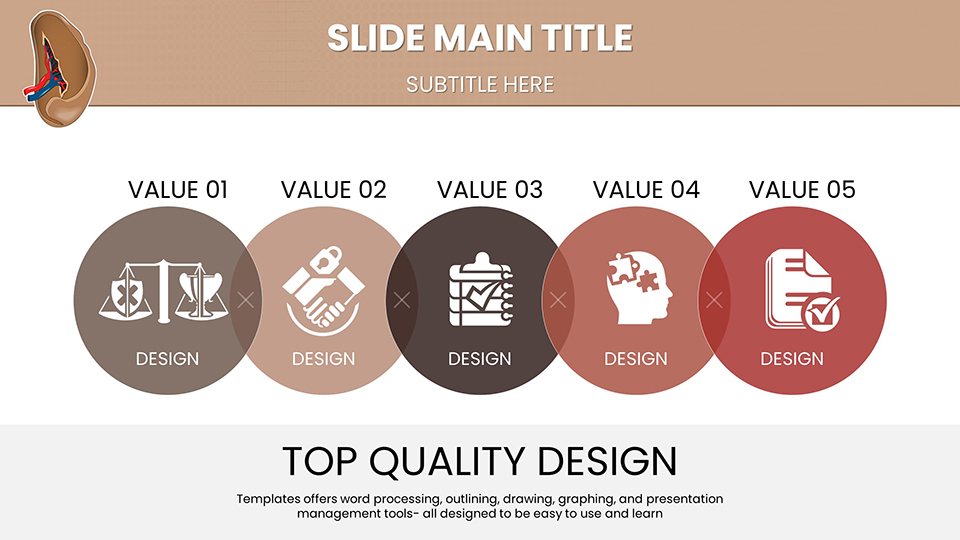
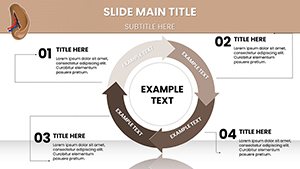
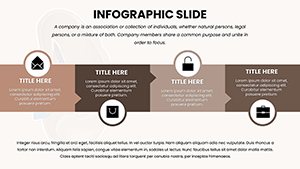
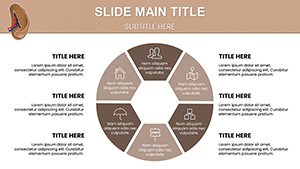
This template's strength lies in its specialized features. Across 59 slides, find Venn diagrams for overlapping immune functions, scatter plots for cell count variations, and microscopic views of leukocytes in action.
Editability is paramount: Modify scales for platelet aggregation data, embed flow cytometry results, or animate splenic blood flow to mimic physiological processes. Full Google Slides support enables real-time collaboration in labs. LSI terms like "hematopoiesis charts" are woven in for organic relevance.
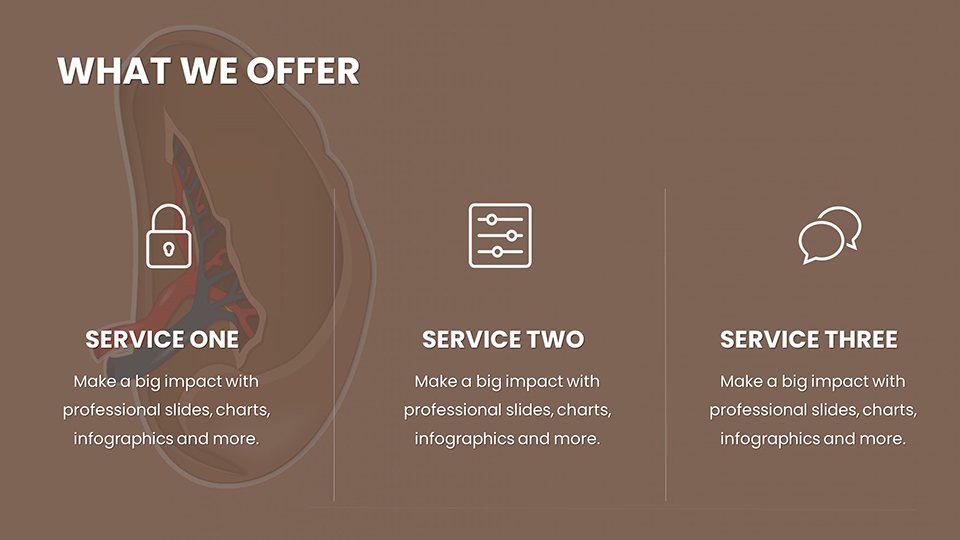
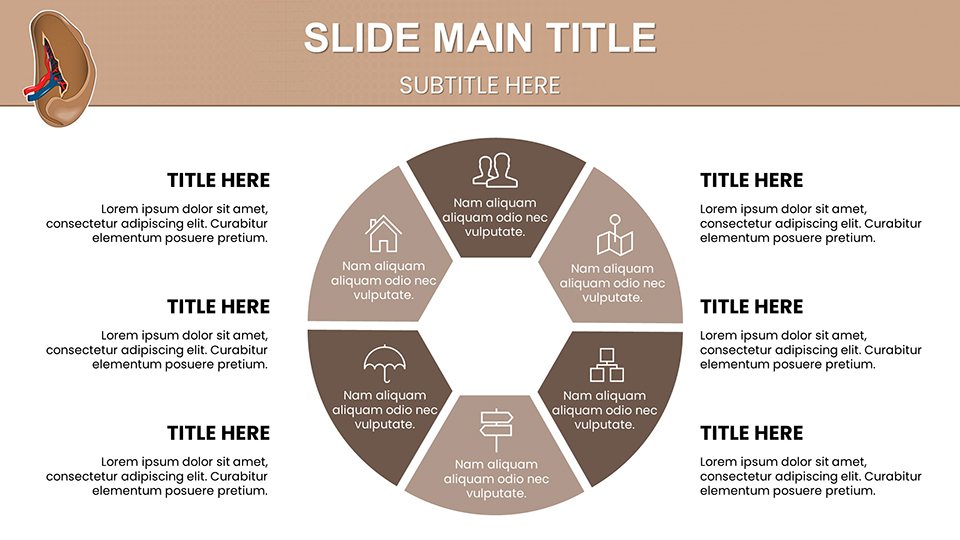
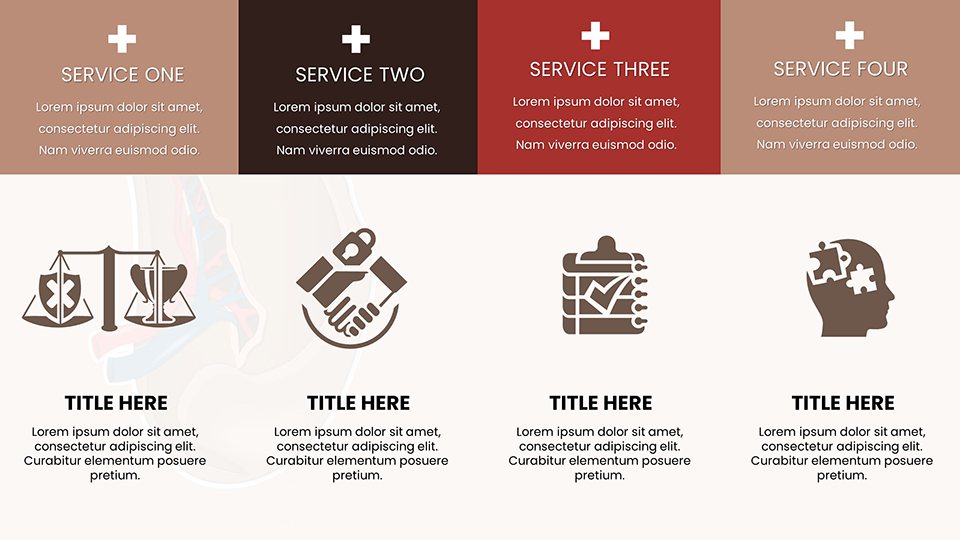
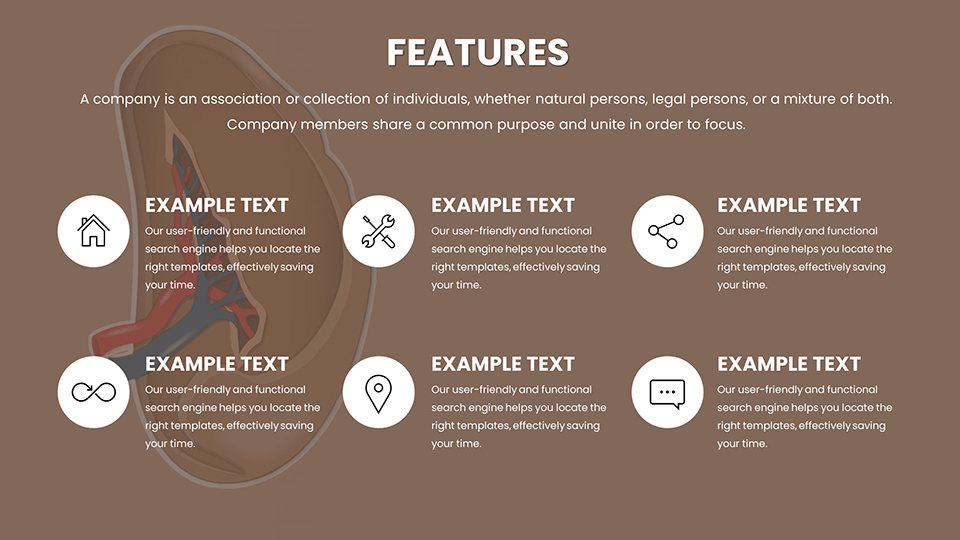
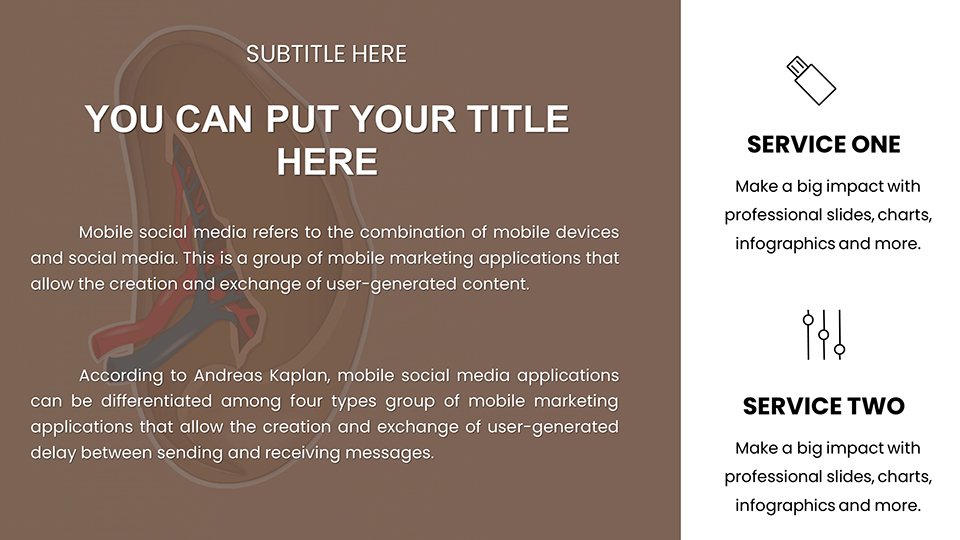
- Anatomical Accuracy: Precise spleen cross-sections aligned with histological standards.
- Cell-Specific Graphics: Icons for RBCs, WBCs, and platelets with labeling options.
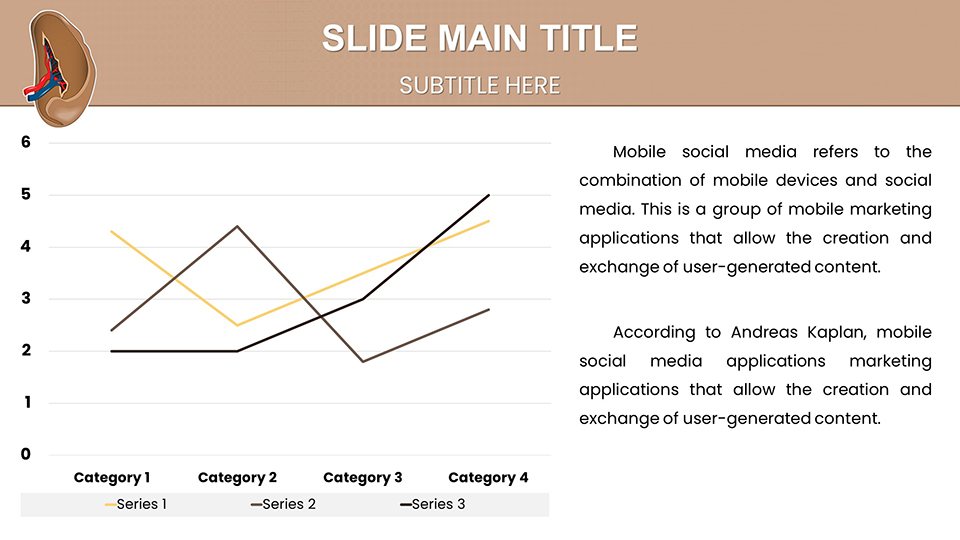
- Analytical Tools: Line graphs tracking hemoglobin levels over time.
- Modular Design: Mix-and-match sections for custom builds.
Such elements underscore expertise, making your presentations authoritative references in the field.
Practical Deployments in Clinical and Research Settings
Apply this template dynamically: Oncologists can use it to map spleen involvement in leukemias, with pie charts showing cell type distributions from biopsy data. In academia, break down extramedullary hematopoiesis for advanced students.
For pharma trials, visualize drug effects on blood cell counts, citing FDA trial protocols for credibility. At conferences, employ timelines of spleen evolution in pathology to engage peers.
- Select a foundation slide, e.g., blood cell overview.
- Input specifics, like differential counts from lab reports.
- Refine visuals: Color-code for disease states.
- Add dynamics: Animate cell migration paths.
- Present securely, knowing content is spot-on.
A hematology clinic case: Enhanced patient education on splenectomy risks via these charts led to better informed consent rates.
Advanced Strategies for Compelling Delivery
Maximize with pro advice: Open with a query, "How does the spleen safeguard our blood?" then reveal via charts. Keep text minimal, letting visuals dominate. In hybrid formats, ensure high-def for remote viewers.
Add credibility with citations from sources like Blood journal. These tactics, refined through clinical experience, turn data into dialogues.
Superiority in Specialized Medical Templates
Outpacing basics, it includes rare elements like splenic artery branching diagrams. At $18, it's value-packed with perpetual access. Cloud compatibility suits global teams.
Our designs, informed by hematologists, ensure relevance beyond generics, focusing on spleen-blood interplay.
Empower your hematology discourse - secure this template and advance understanding.
Frequently Asked Questions
What level of editability do the blood cell charts offer?
Total flexibility: Adjust every aspect from shapes to data integrations.
Is it suitable for Mac users?
Yes, works flawlessly on PowerPoint for Mac and Google Slides.
Are there pre-built animations?
Indeed, for illustrating processes like phagocytosis.
Can I incorporate videos?
Yes, embed clips into slides for multimedia enhancement.
What's the license scope?
Broad, covering educational and professional uses without restrictions.