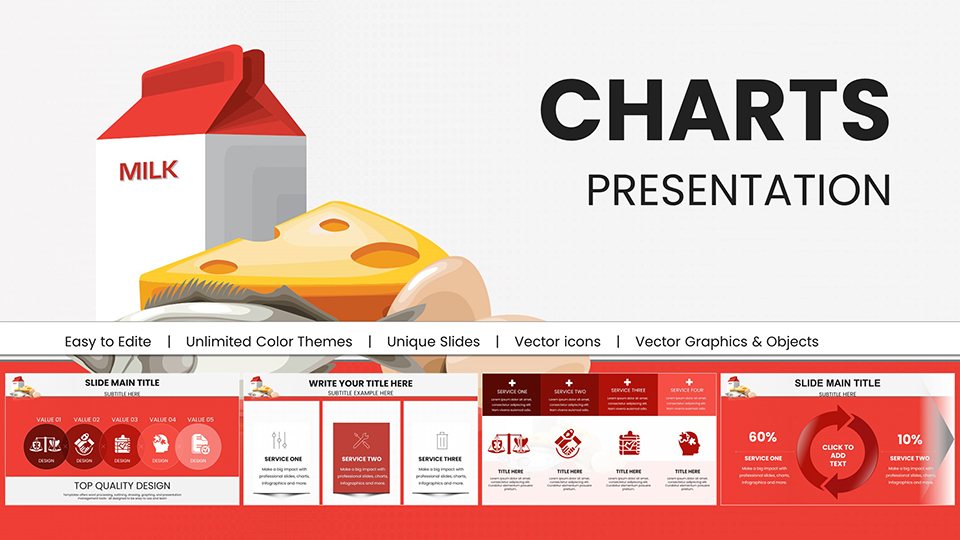
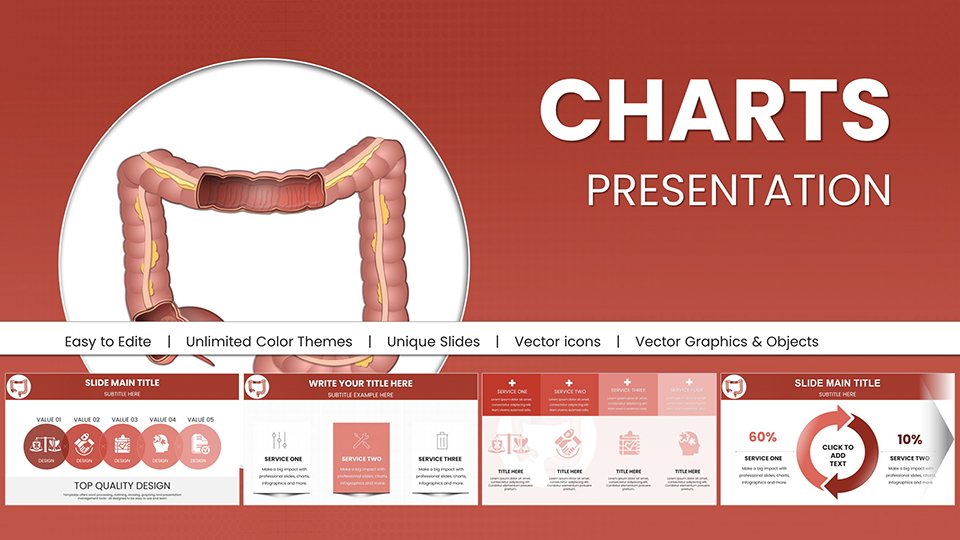
Large Intestine PowerPoint Charts: Digestive Depth Unveiled


Type: PowerPoint Charts template
Category: Medicine - Pharma
Sources Available: .pptx
Product ID: PC00961
Template incl.: 59 editable slides
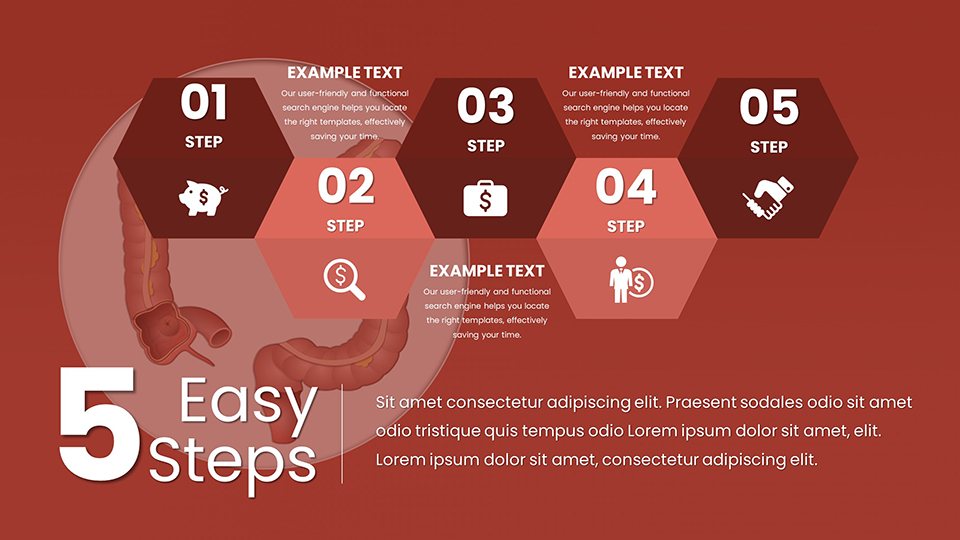
Navigating the twists and turns of digestive health requires tools that simplify the complex without sacrificing detail. Our Large Intestine PowerPoint Charts template is ideal for gastroenterologists, nutritionists, and health educators seeking to spotlight colon absorption, microbiota roles, and bowel disorders. With 59 editable slides, it provides a canvas for turning gut science into accessible stories.
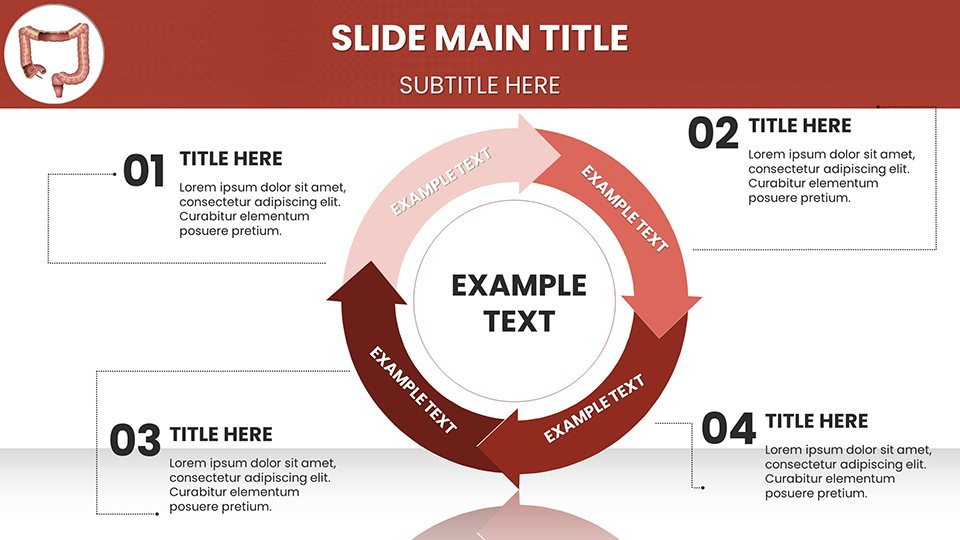
Visualize mapping the colon's segments in a wellness workshop, using flow charts to depict water reabsorption, or analyzing microbiome data in research briefs. Aligned with insights from the American Gastroenterological Association (AGA), these charts ensure scientific integrity, fostering trust in your delivery.
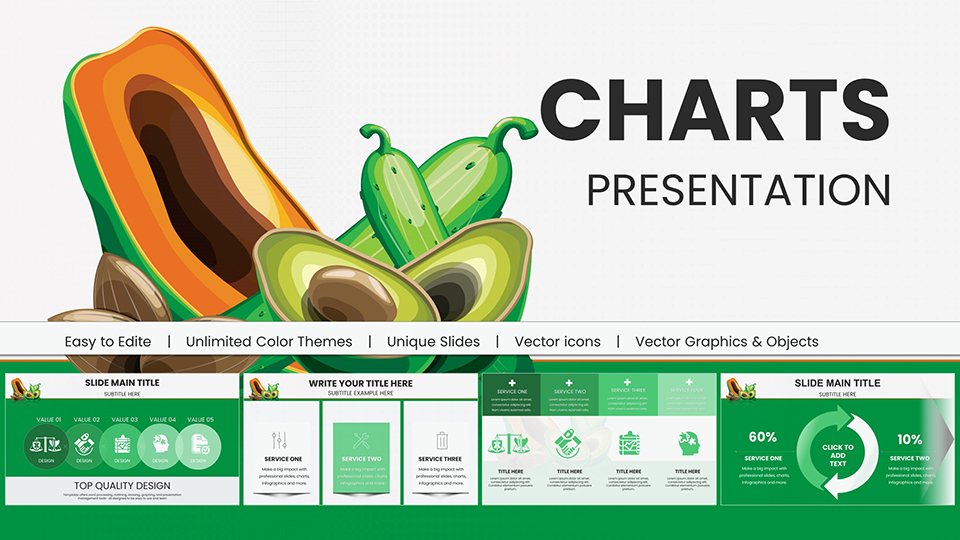
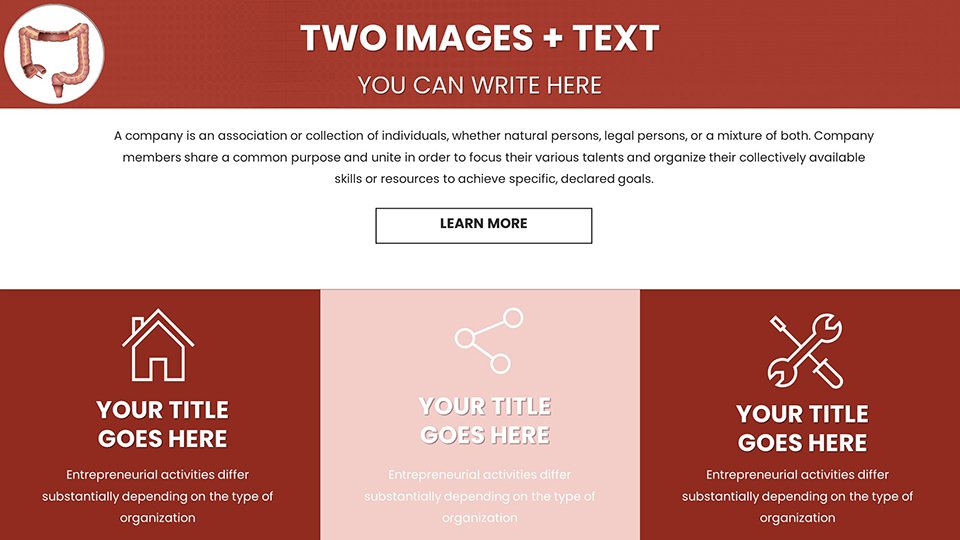
Beyond standard slides, it employs earthy tones - browns and greens - for thematic resonance, aiding memory retention as noted in educational psychology studies.
Feature Highlights for Gut-Focused Narratives
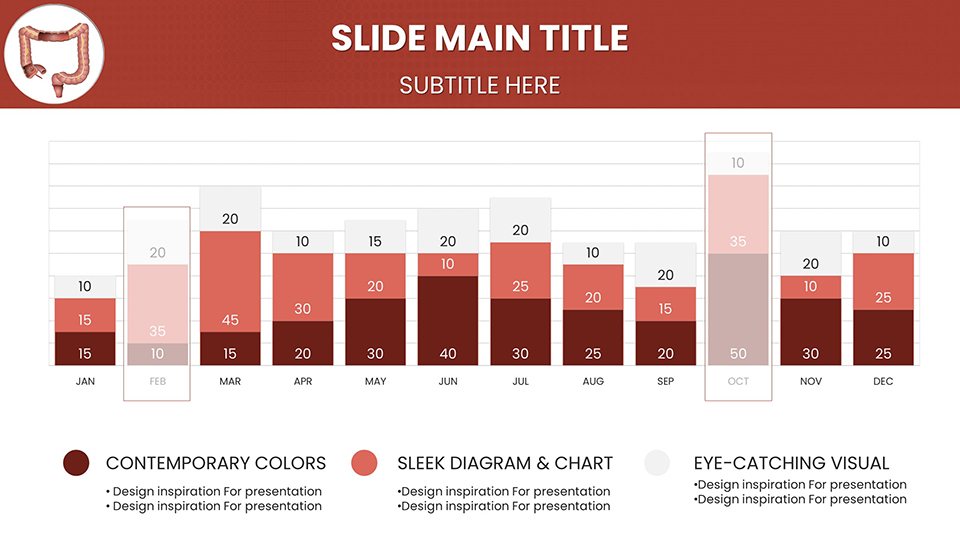
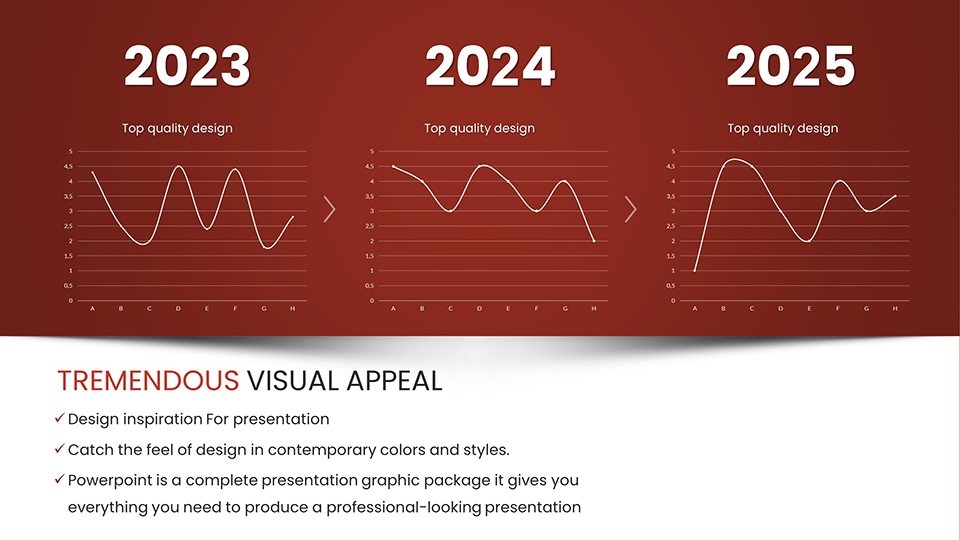
Explore features tailored to digestive themes: Slides range from anatomical overviews of the cecum to radar charts comparing fiber impacts on transit times.
Customization is intuitive: Scale elements for emphasis on polyps, link to external datasets from gut health apps, or animate peristalsis waves. Google Slides compatibility supports dietitian collaborations. Naturally includes terms like "colonic infographics."
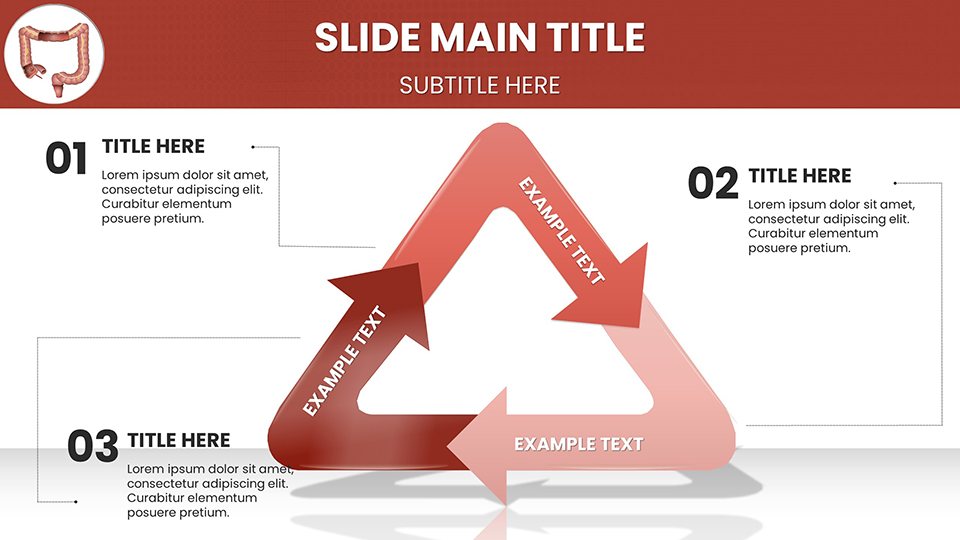
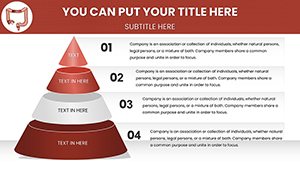
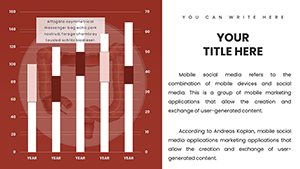
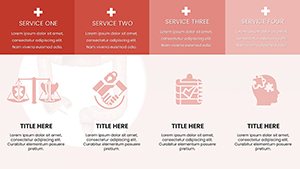
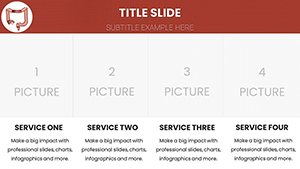
- Segmented Views: Detailed breakdowns of ascending, transverse, descending colon.
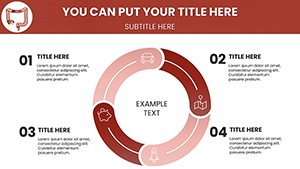
- Microbiome Maps: Visuals for bacterial diversity distributions.
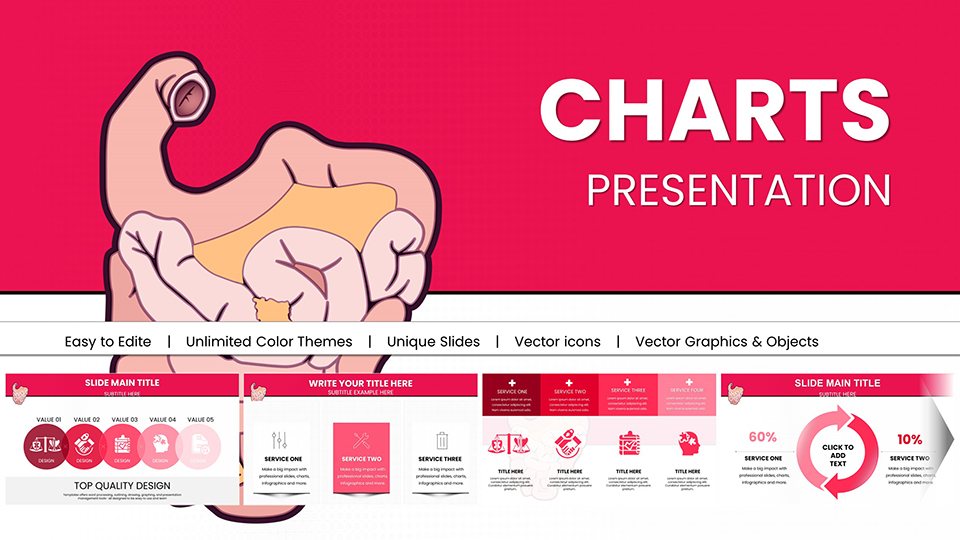
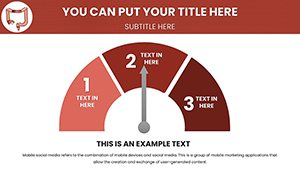
- Pathology Plots: Graphs for IBS symptom tracking.
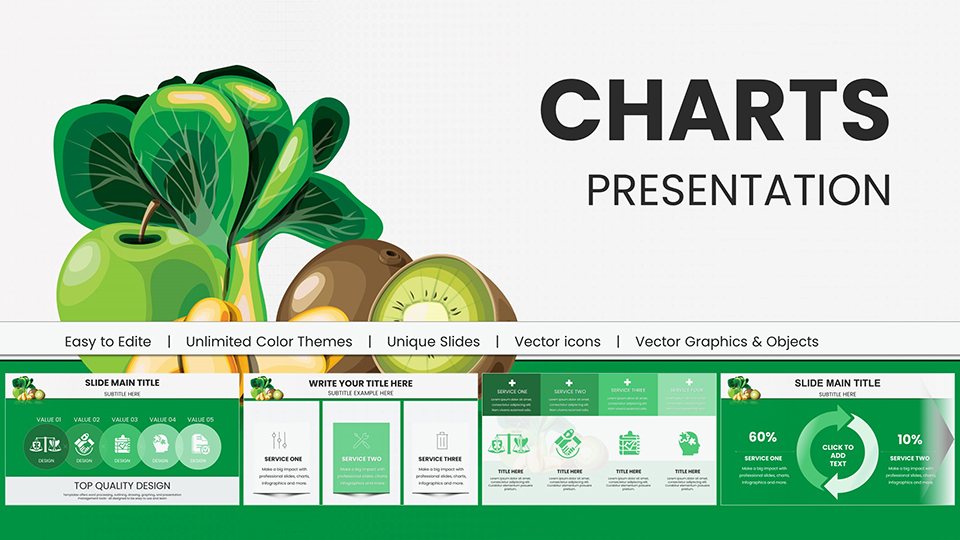
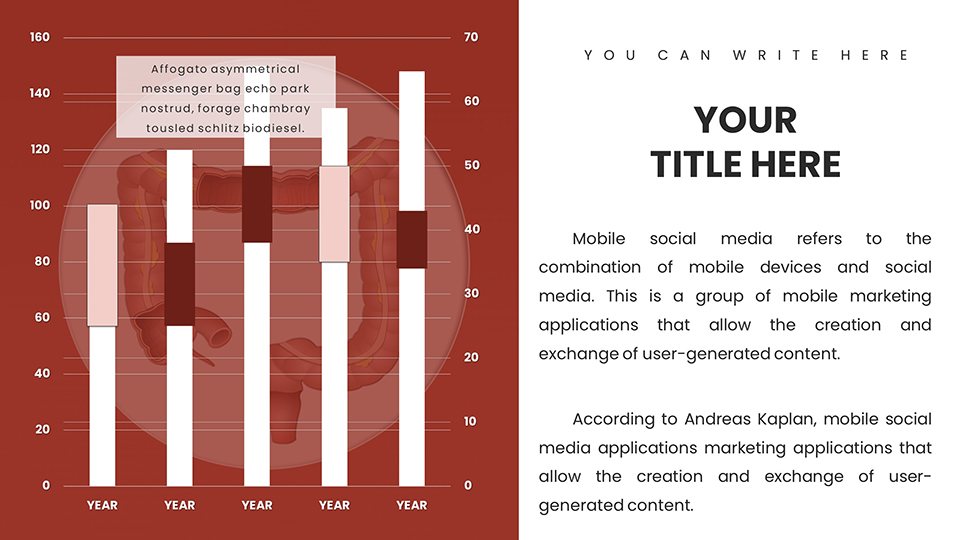
- Nutritional Ties: Charts linking diet to intestinal health.
These empower authoritative content creation.
Implementation in Health and Wellness Contexts
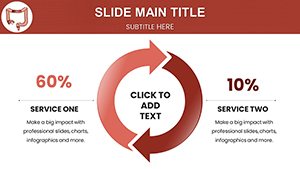
Deploy for diverse needs: Nutritionists can illustrate probiotic benefits with before-after visuals; surgeons prep for colonoscopies via procedural timelines.
In public health campaigns, use demographics charts from CDC data to address colorectal cancer risks.
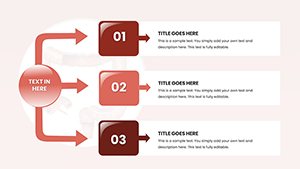
- Pick a core slide, like intestine layout.
- Add data, e.g., absorption rates.
- Personalize: Adjust for audience level.
- Enhance with motions for dynamic flow.
- Share effectively in sessions.
A clinic's success story: Improved patient adherence to screening via these engaging charts.
Tips to Amplify Digestive Discussions
Begin with relatable analogies, like the intestine as a nutrient highway, then dive into visuals. Balance text and images for digestibility. For online formats, optimize for mobile viewing.
Cite sources like Gut journal for solidity. These refine your approach to gut education.
Edge Over Generic Digestive Tools
Unique in focus on large intestine specifics, like haustra formations, at $18 with updates. Cloud-ready for teams.
Vetted by GI experts for precision beyond basics.
Digest the difference - acquire this template for healthier insights.
Frequently Asked Questions
How flexible are the intestine diagrams?
Highly, allowing full modifications to fit your narrative.
Compatible with keynote?
Exportable, though optimized for PowerPoint/Google Slides.
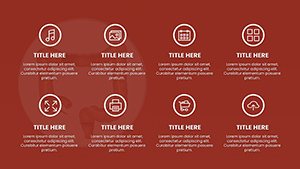
Included gut health icons?
Yes, over 40 for quick additions.
Support for large audiences?
High-res for projections.
Refund policy?
Satisfaction guaranteed with easy returns.
Educational discounts?
Available for institutions - contact us.