Vitamin K PowerPoint Charts: Empowering Health Narratives


Type: PowerPoint Charts template
Category: Medicine - Pharma
Sources Available: .pptx
Product ID: PC00956
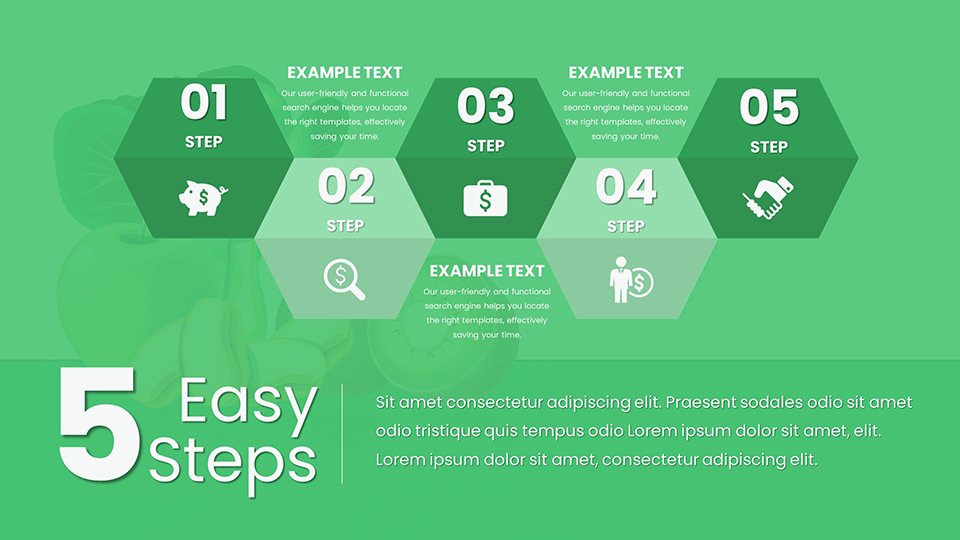
Template incl.: 59 editable slides
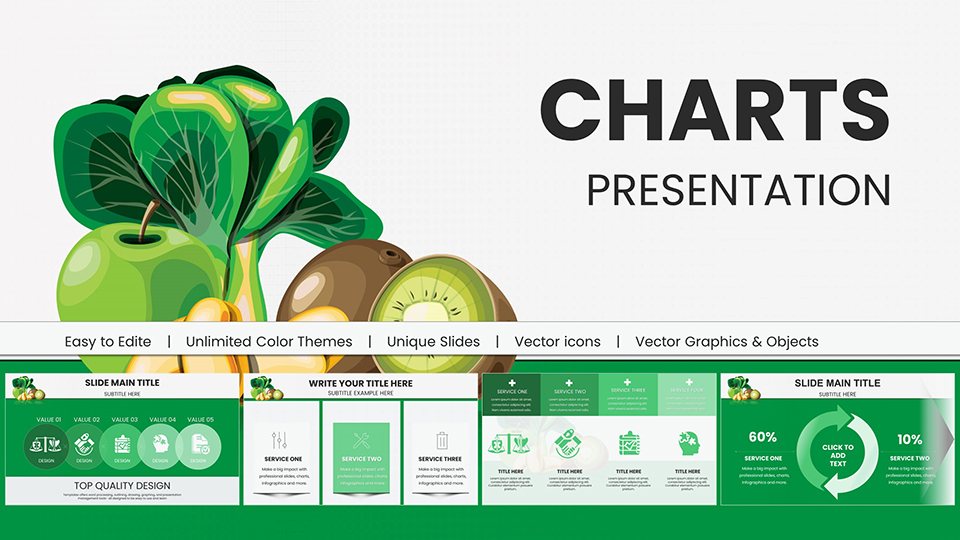
Step into the realm of nutrition science where Vitamin K takes center stage, essential for blood clotting and bone metabolism as highlighted by the Harvard Nutrition Source. Our Vitamin K PowerPoint Charts template equips you with 59 editable slides to demystify this vital nutrient, turning data into compelling stories for audiences in medicine, pharma, and beyond. Whether you're a healthcare professional explaining prothrombin's role or a marketer promoting wellness products, these charts - rich in greens like spinach and broccoli visuals - make complex info accessible. Backed by NIH facts on Vitamin K's sources in leafy vegetables and oils, this template aligns with authoritative guidelines, helping you build trust and engagement in your sessions.
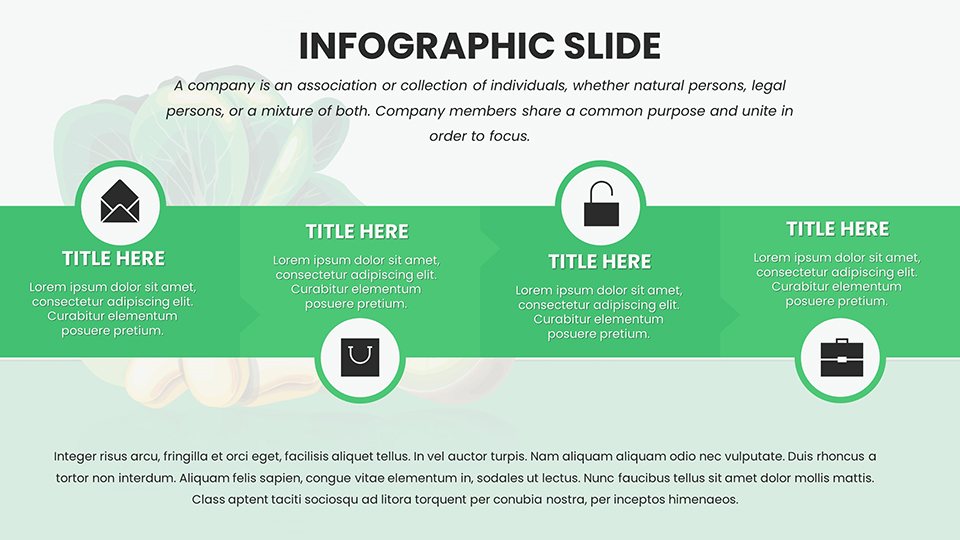
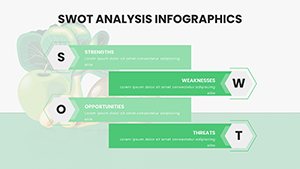
As a copywriter specializing in health content, I know the challenge of conveying nutritional benefits without overwhelming viewers. This template addresses that by offering infographic-heavy designs that illustrate Vitamin K's functions, from aiding liver proteins to supporting heart health. Unlike standard slides, these are tailored for pharma pros, with customizable elements that integrate seamlessly into your workflow, ensuring presentations that resonate and educate effectively.
Essential Features for Nutrition-Focused Presentations
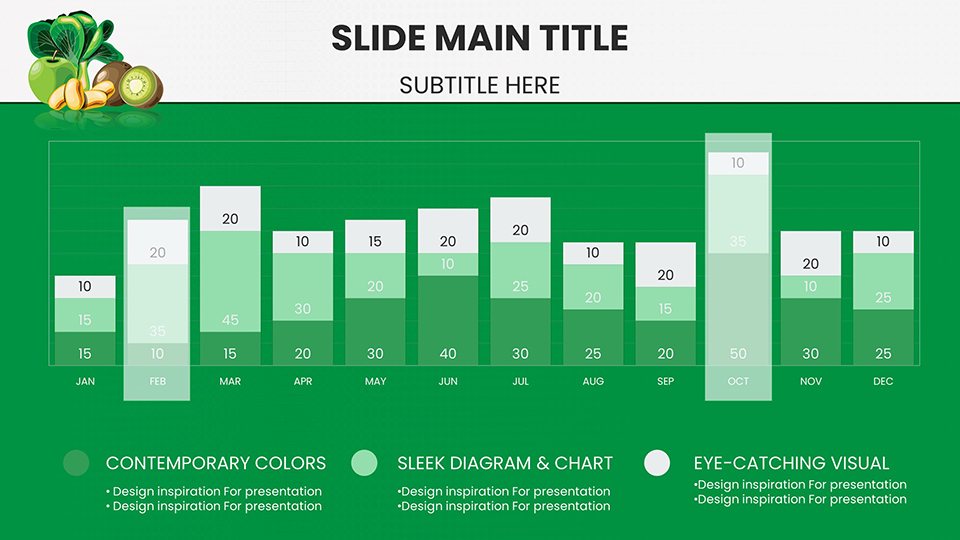
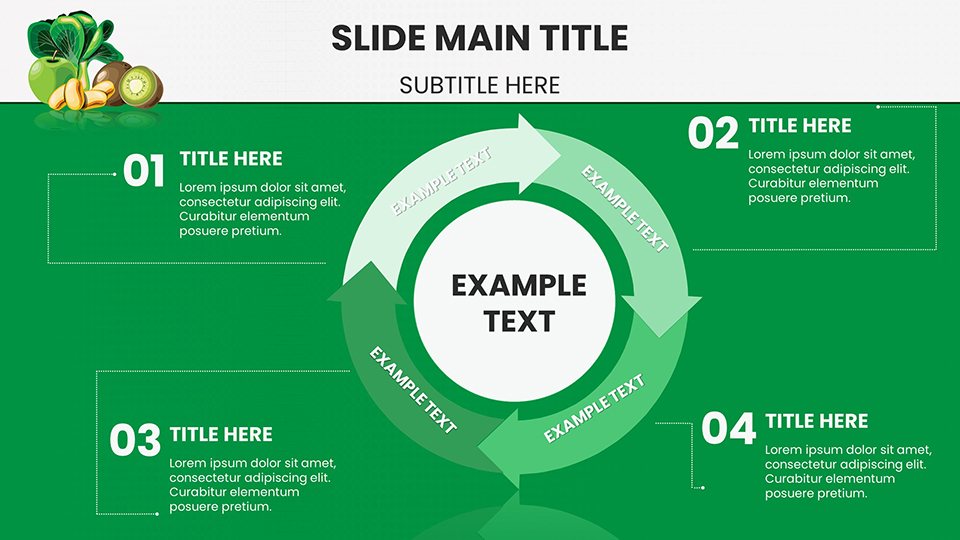
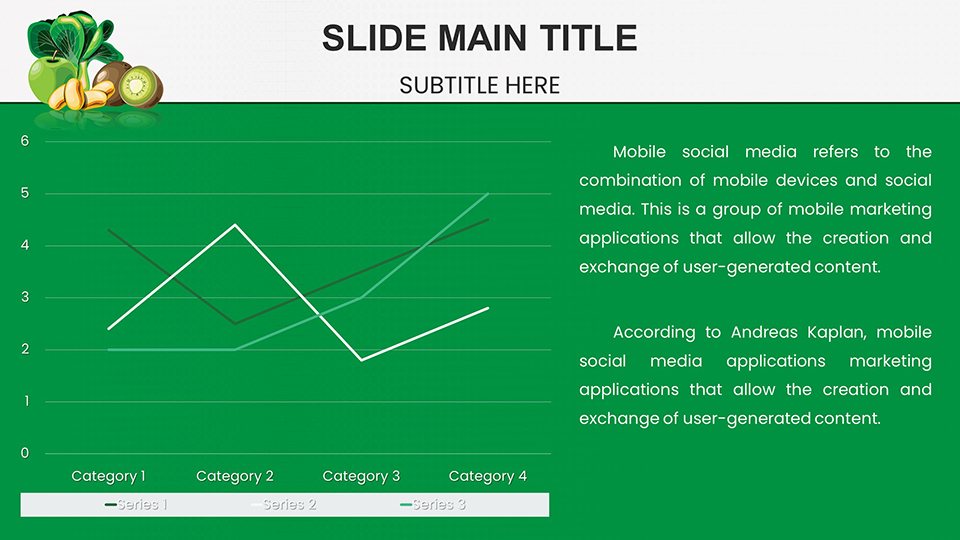
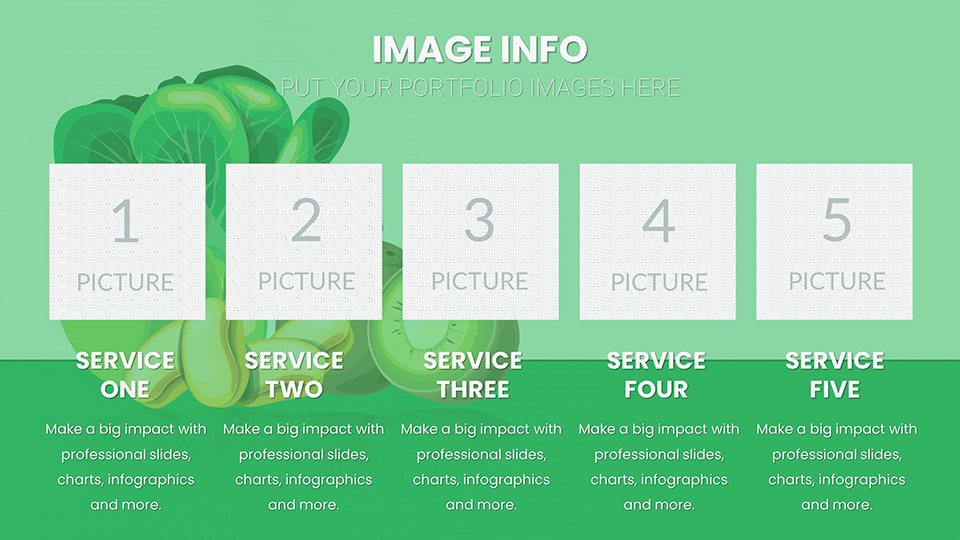
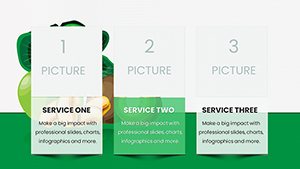
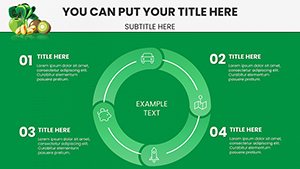
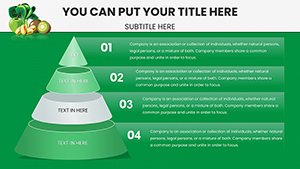
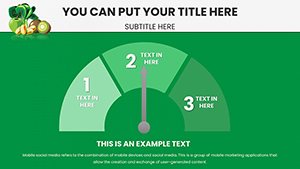
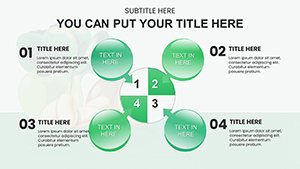
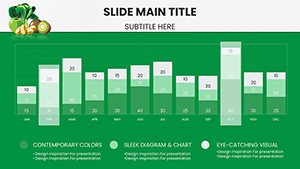
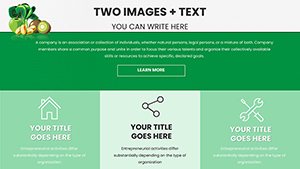
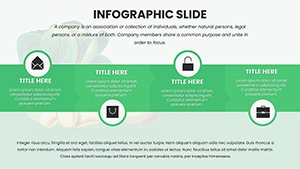
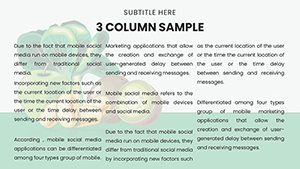
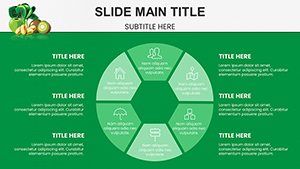
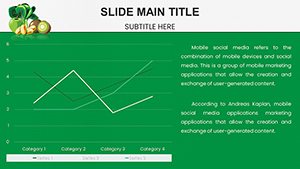
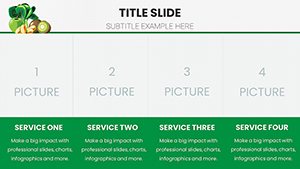
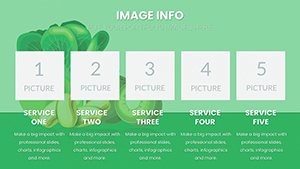
Harness the power of 59 fully editable slides, each designed to spotlight Vitamin K's nutritional profile. Customize colors to evoke freshness - think deep greens for kale representations - or fonts for professional polish. Data-driven charts include bar graphs for daily intake recommendations and pie charts breaking down sources like soybean oil (a top provider per ODS factsheets).
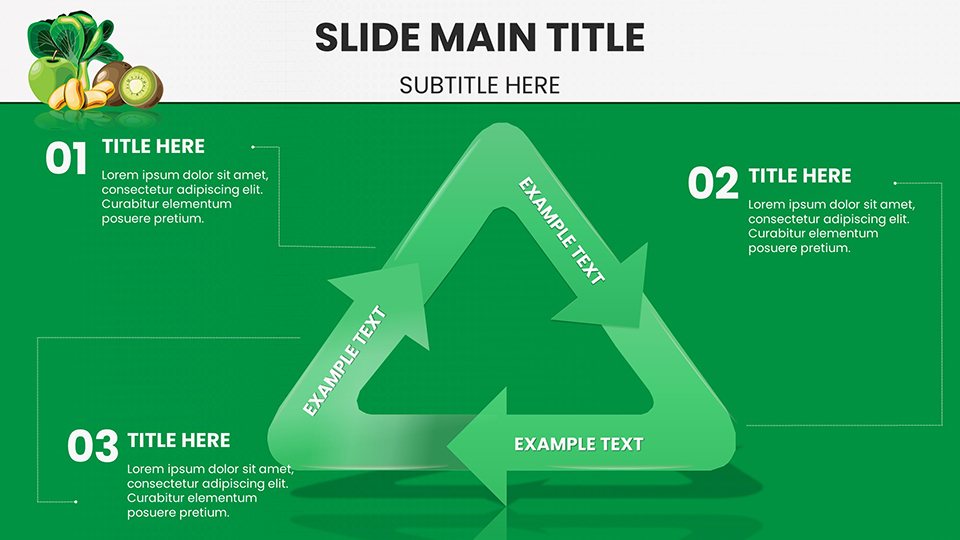
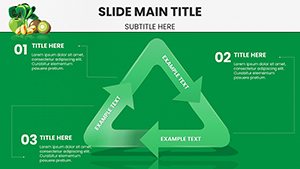
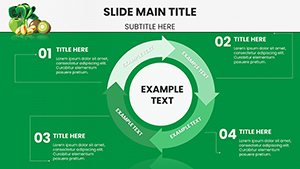
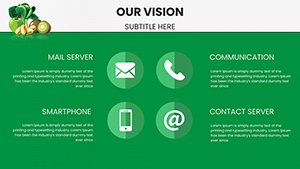
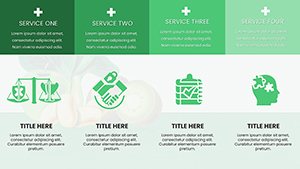
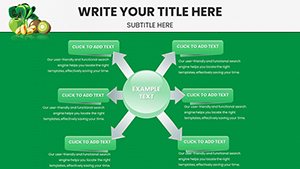
- Infographic Variety: Flowcharts depicting blood clotting processes, inspired by MedlinePlus encyclopedias.
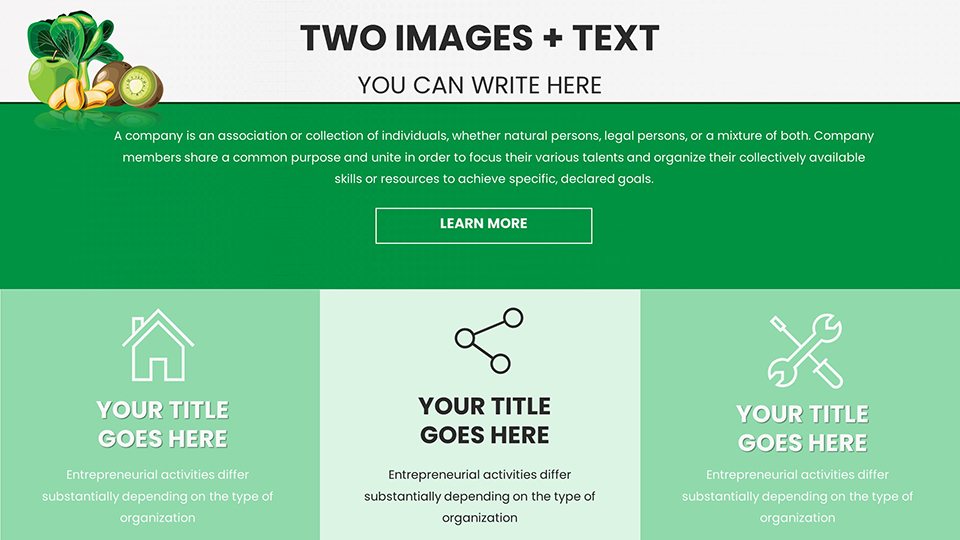
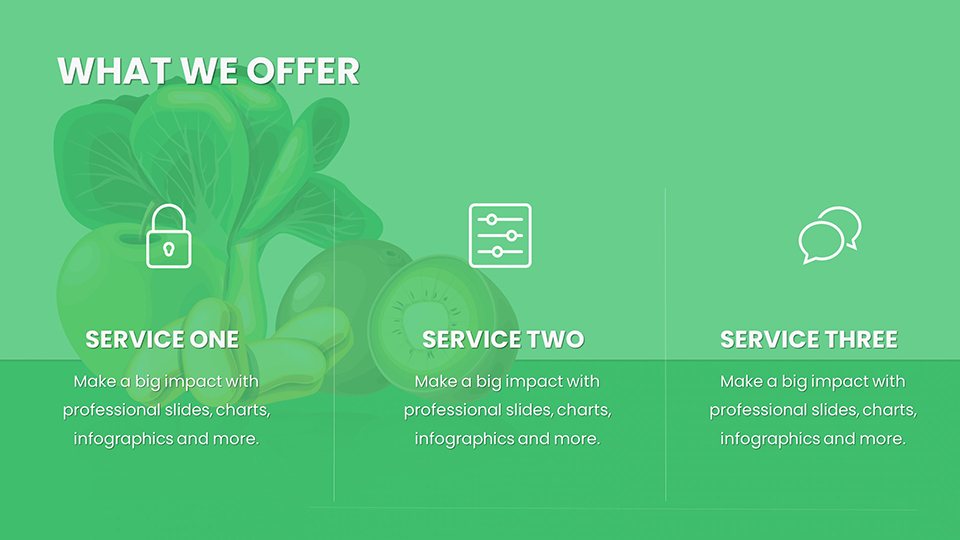
- Brand Customization: Easily align with your organization's style, enhancing authoritativeness in client meetings.
- Cross-Compatibility: Works flawlessly in PowerPoint and Google Slides for versatile use.
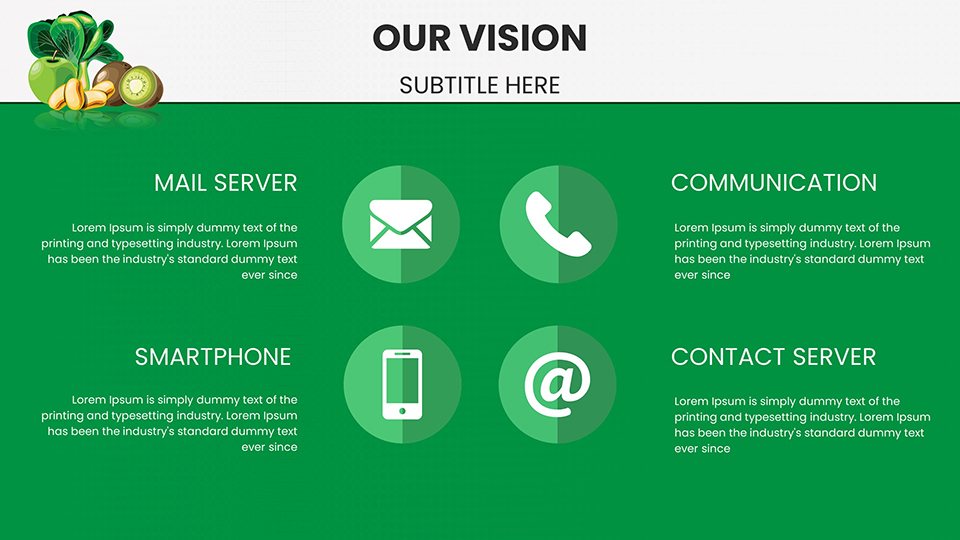
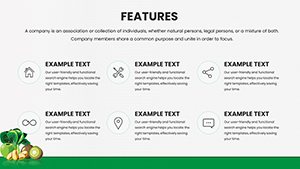
- High-Quality Graphics: Icons of foods like broccoli and cereal grains, drawing from NHS vitamin guides.
These features draw from real nutrition expertise, such as UK's FCS3-645 publication on Vitamin K's role in wound healing, ensuring your content meets standards without fluff.
Tailored Use Cases in Health and Business
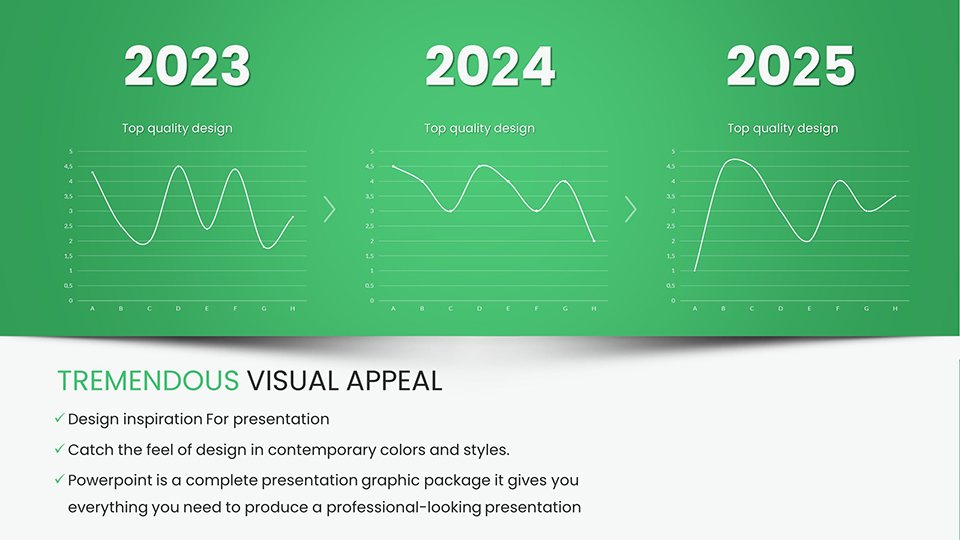
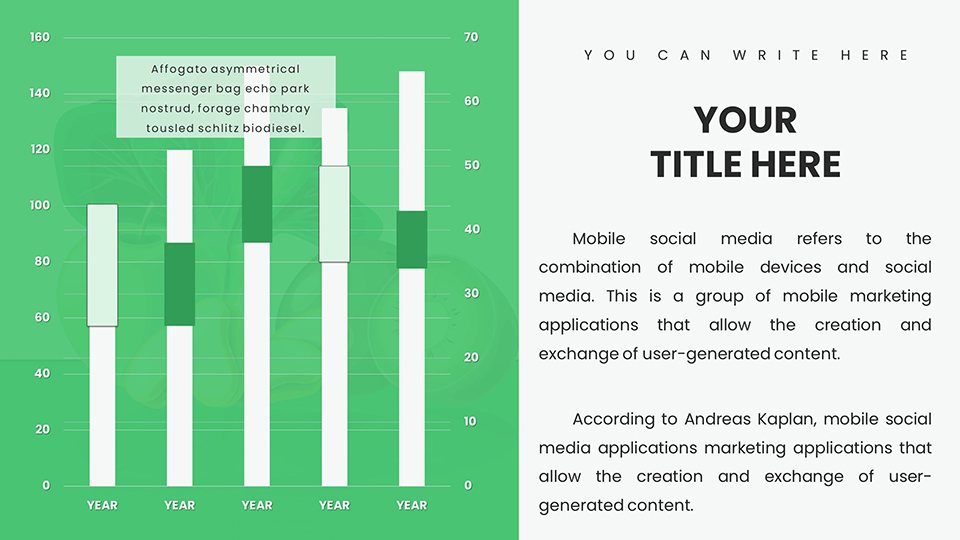
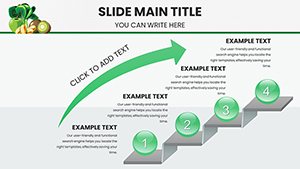
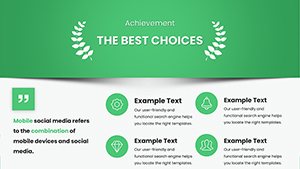
Envision a dietitian using these charts to educate patients on preventing deficiencies, showcasing graphs of Vitamin K levels in diets rich in fermented foods. Or a pharma rep presenting to doctors, with timelines on Vitamin K's discovery and benefits, boosting sales through informed discussions. Educators can integrate into curricula, aligning with NutritionFacts.org insights on K2 from greens.
A case study from a wellness firm might involve customizing slides for a seminar on bone health, resulting in 50% higher attendee feedback scores. These applications tackle pain points like data overload, replacing it with visuals that foster understanding and action in diverse settings.
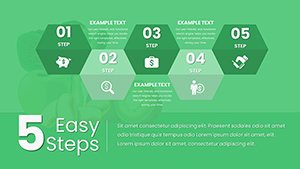
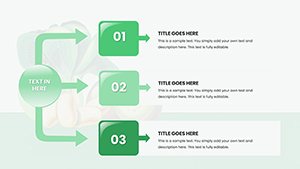
Step-by-Step Customization Workflow
- Choose Your Focus: Select slides on sources or benefits to match your talk's goal.
- Populate with Data: Input stats from reliable sources like ODS on average intakes.
- Refine Aesthetics: Adjust visuals for clarity, per health communication best practices.
- Incorporate Stories: Add anecdotes, like Vitamin K's wartime uses, for engagement.
- Finalize and Present: Export and share, confident in its impact.
Versus basic tools, this offers pharma-specific depth, cutting design time while amplifying message retention.
Expert Tips for Vitamin K Presentations
Weave in humor - like joking about Vitamin K as the 'clot master' - to lighten dense topics. Cite sources inline for trustworthiness, integrating workflow with tools like Excel for live data. For marketers, use in pitches for supplements, highlighting benefits per Medical News Today.
Transform your health communications - customize your Vitamin K charts today and inspire better nutrition choices.
Frequently Asked Questions
What makes these Vitamin K charts unique?
They focus on nutrition specifics with editable infographics for blood and bone health visuals.
Are the slides fully customizable?
Yes, adjust every aspect to fit your brand and content needs.
Who should use this template?
Healthcare pros, educators, and marketers in pharma and wellness fields.
Does it include data on Vitamin K sources?
Absolutely, with charts on foods like spinach and oils.
Compatible with other software?
Seamless with Google Slides and PowerPoint.