Foods Rich in Vitamin E: PowerPoint Charts for Health Pros


Type: PowerPoint Charts template
Category: Medicine - Pharma, Illustrations
Sources Available: .pptx
Product ID: PC00955
Template incl.: 59 editable slides
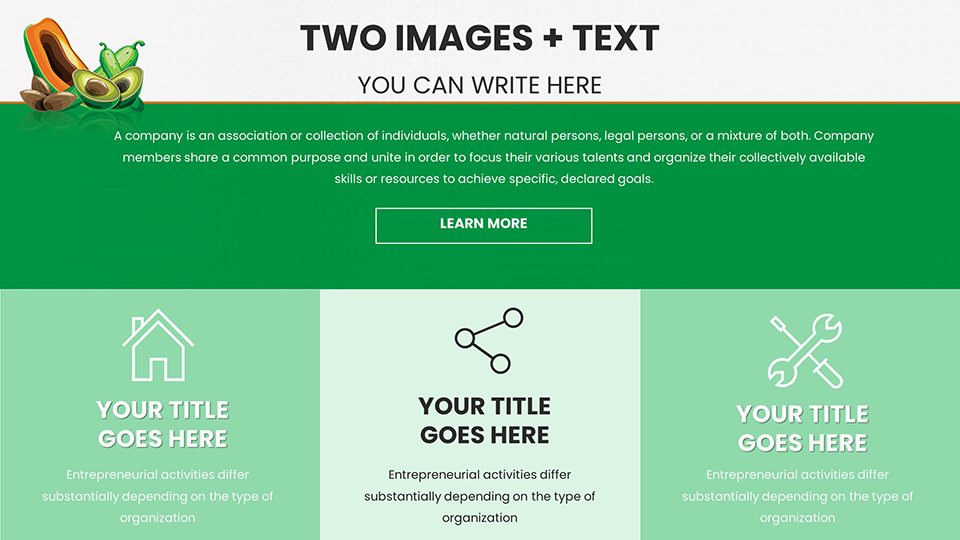
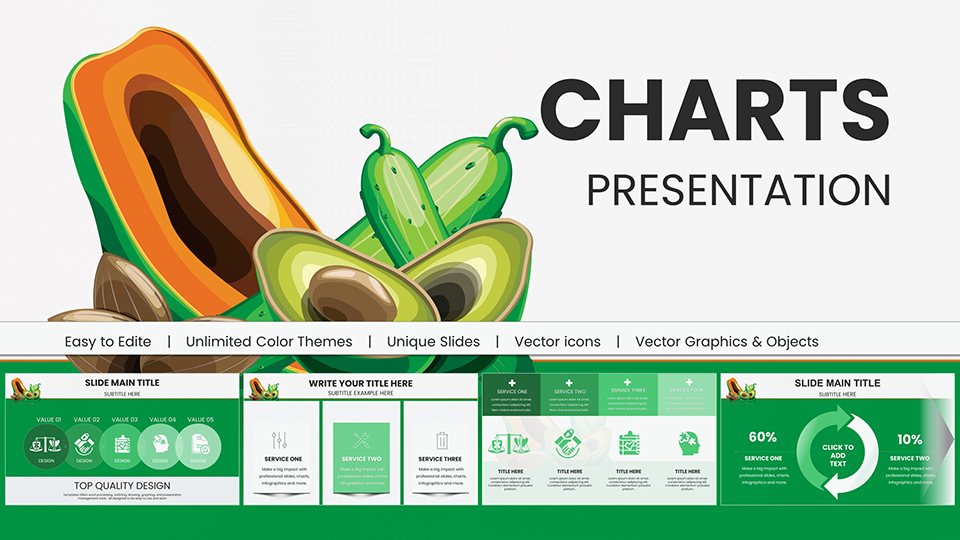
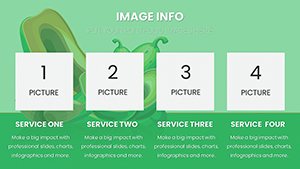
Delve into the antioxidant powerhouse that is Vitamin E, crucial for immune health and skin vitality as per the Cleveland Clinic's guidelines. Our Foods Vitamin E PowerPoint Charts template offers 59 editable slides to showcase sources like sunflower seeds and avocados, making nutrition education vivid and actionable. Tailored for educators demystifying diets, marketers promoting supplements, researchers sharing findings, and business execs in wellness, this template integrates facts from Healthline's list of 30+ Vitamin E foods, ensuring your presentations are both authoritative and inspiring.
In a world where visual aids enhance retention - per WebMD's emphasis on plant-based antioxidants - this template turns nutritional data into eye-catching narratives, solving the hassle of from-scratch designs while aligning with through real-source integrations.
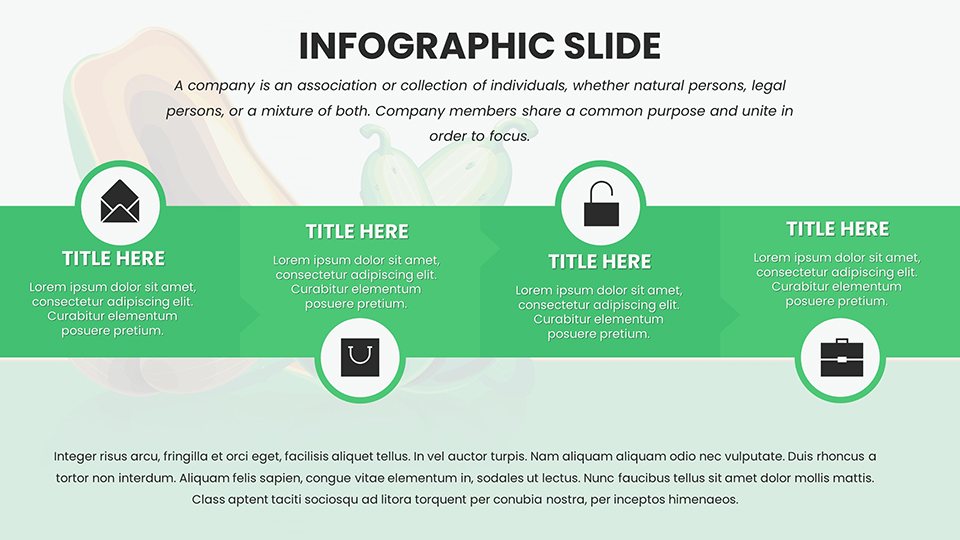
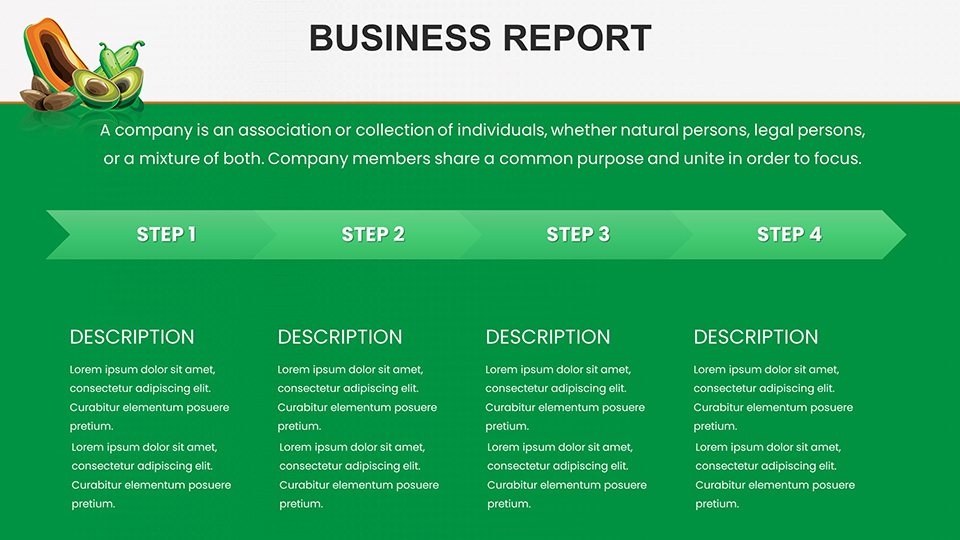
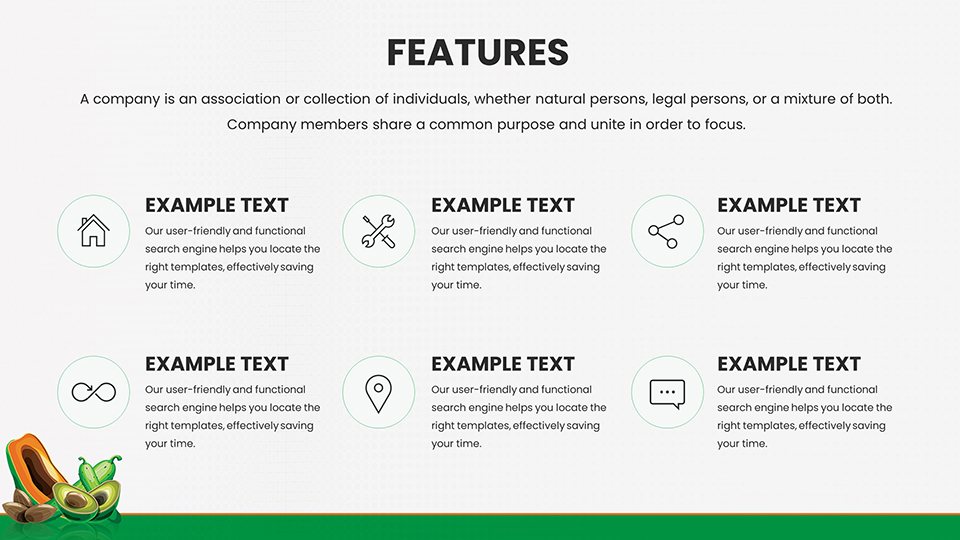
Standout Features for Dynamic Nutrition Visuals
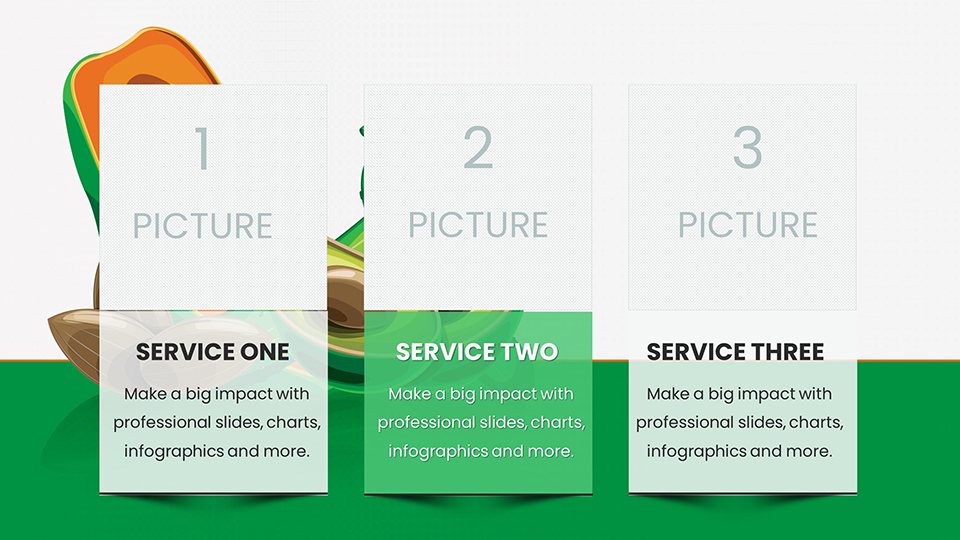
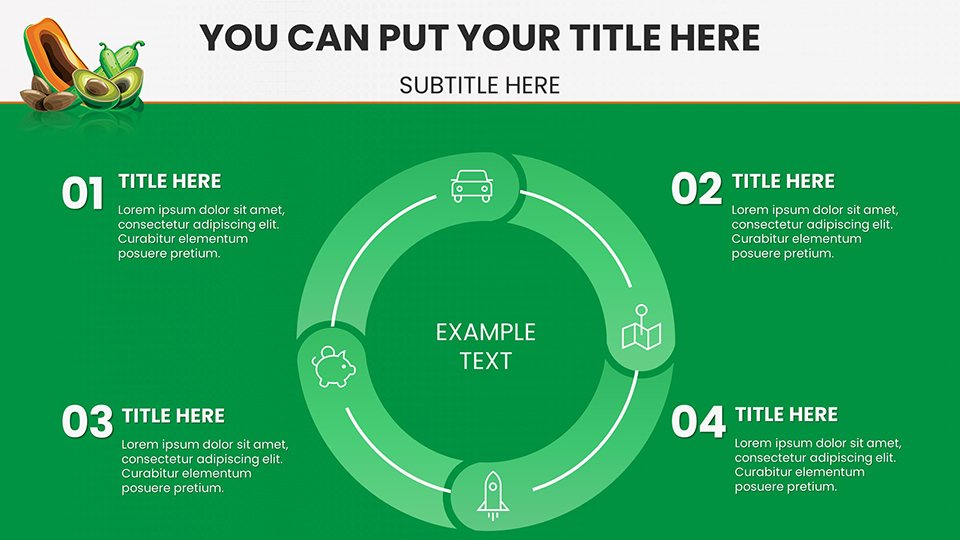
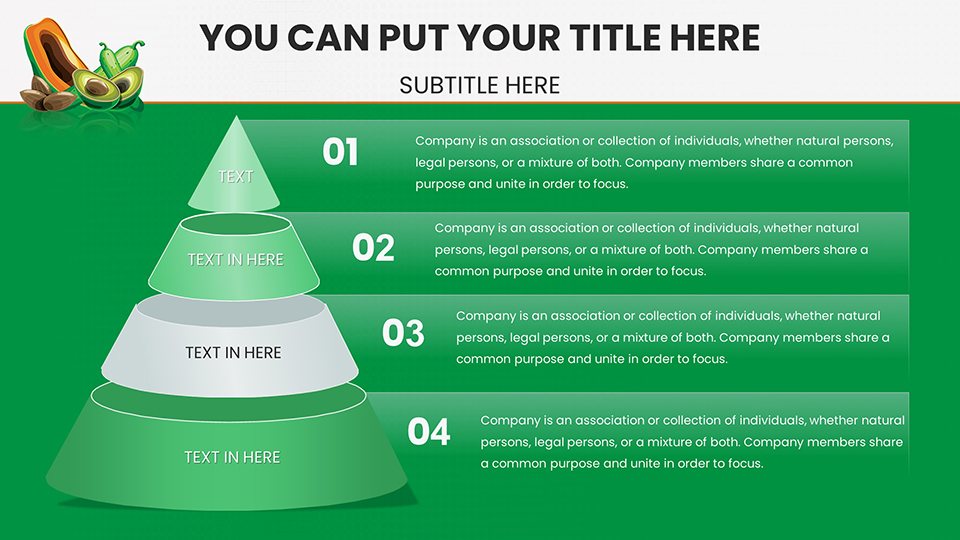
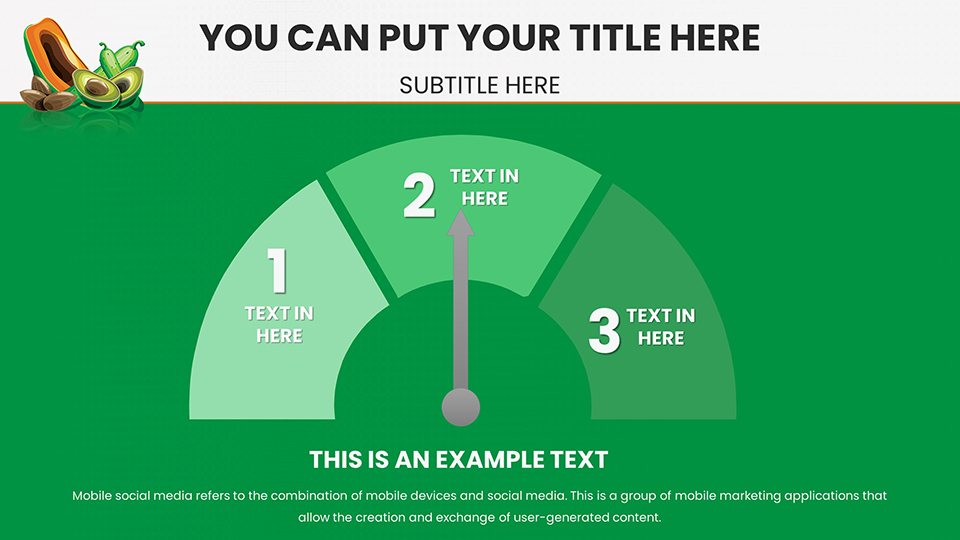
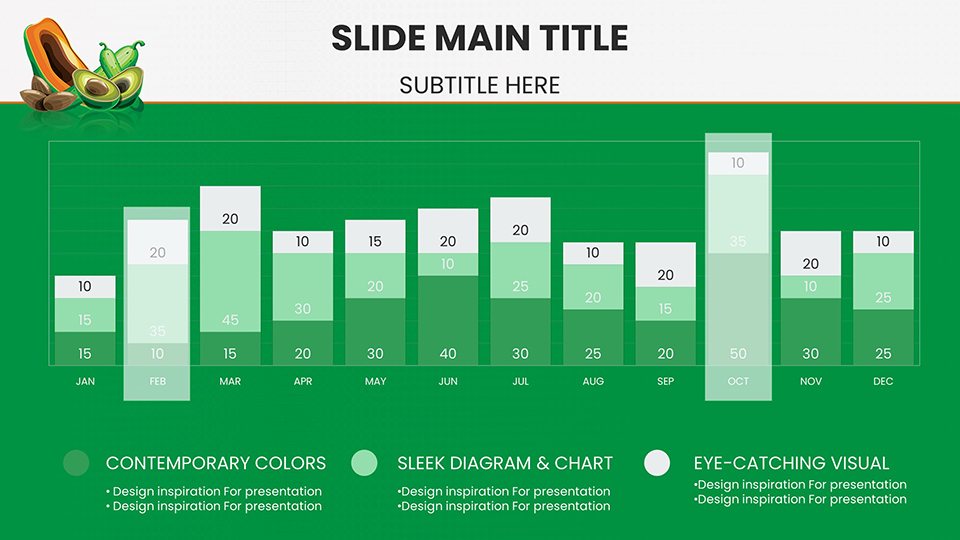
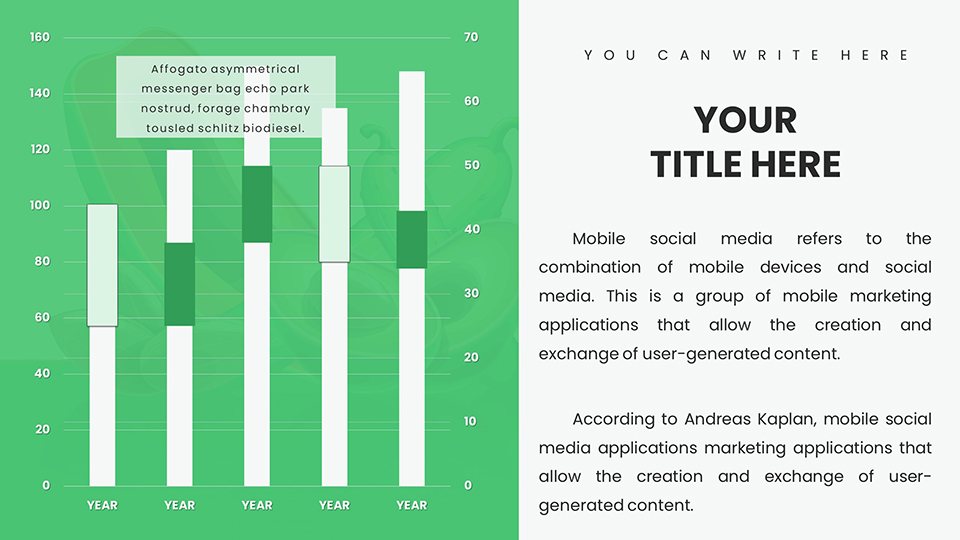
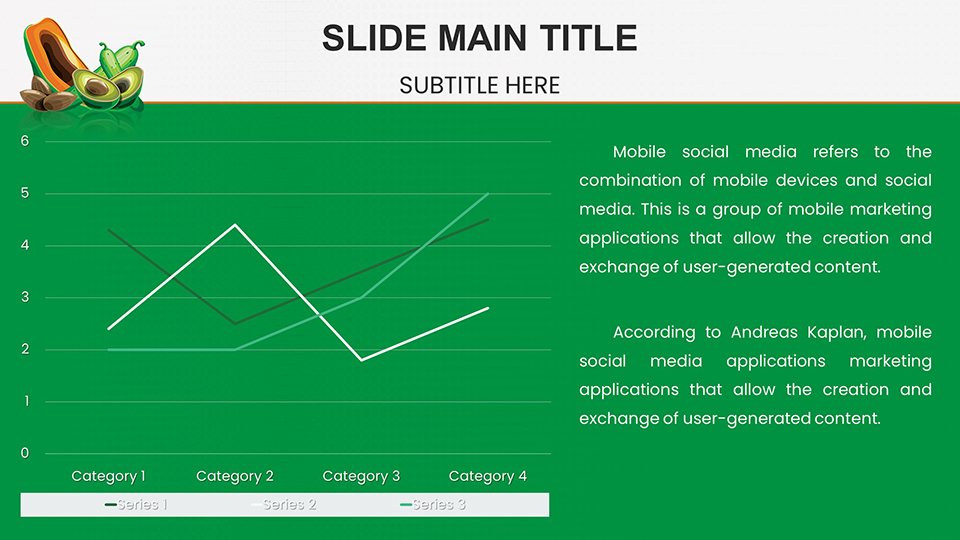
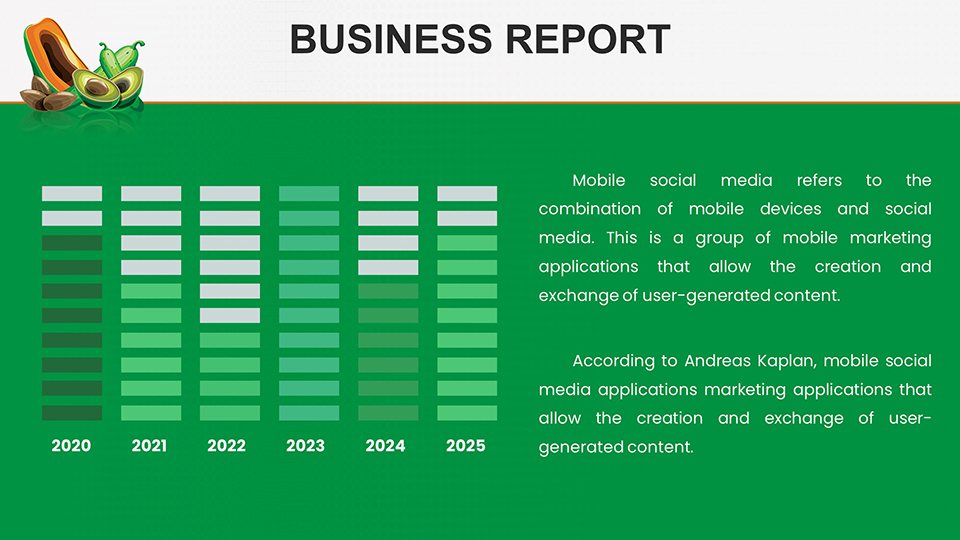
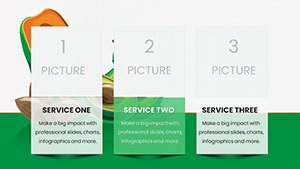
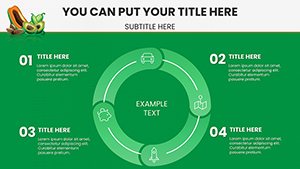
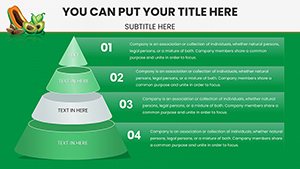
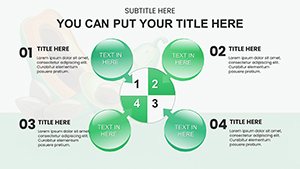
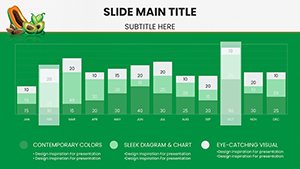
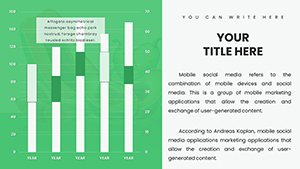
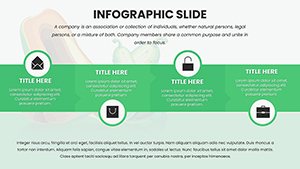
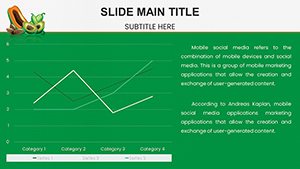
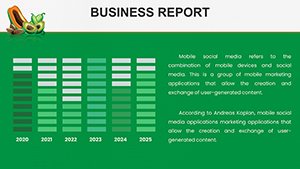
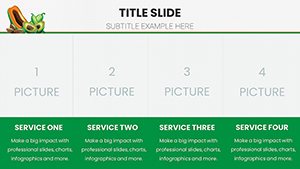
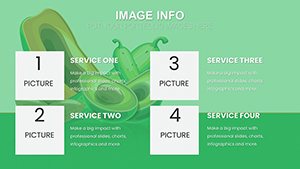
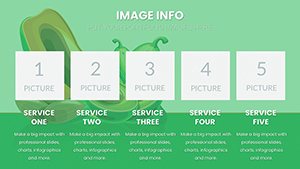
Explore 59 slides brimming with customization: Alter vibrant colors to represent fresh produce or tweak layouts for seminar flows. Charts include scatter plots for absorption rates and column graphs for content in nuts like almonds (a top source per Mayo Clinic).
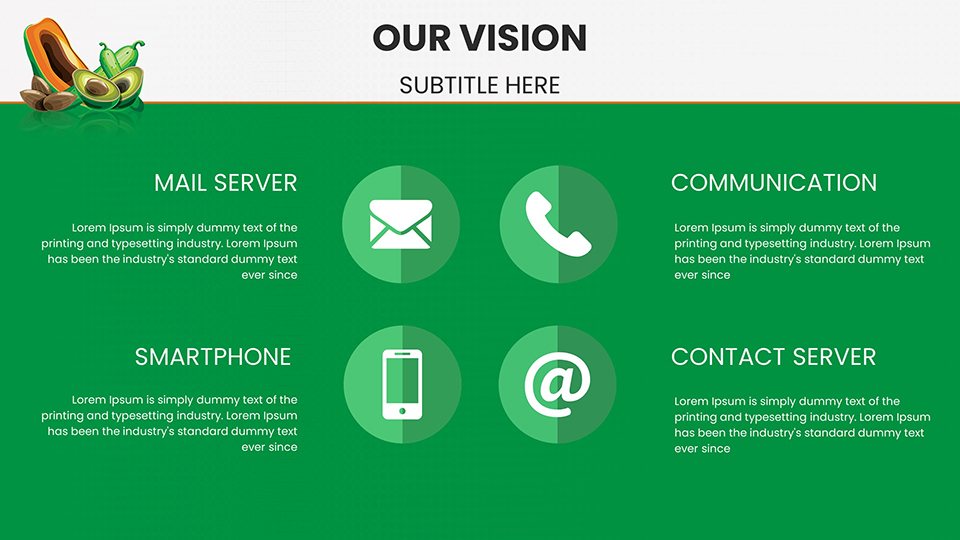
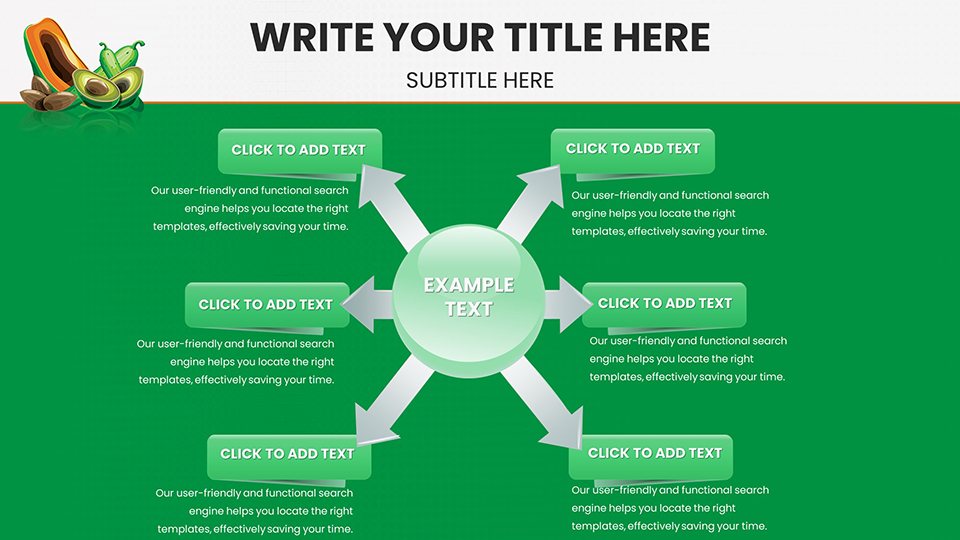
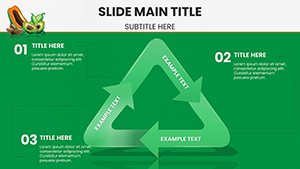
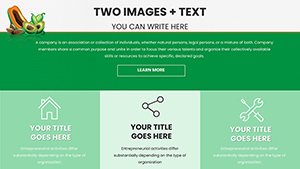
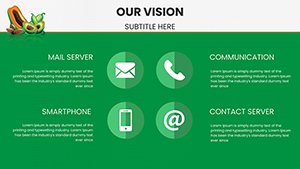
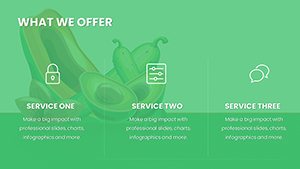
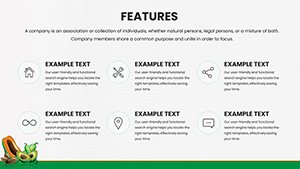
- Graphic-Rich Designs: Icons of oils and greens, echoing NHS sources like rapeseed oil.
- Flexible Editing: Match your branding effortlessly for professional coherence.
- Platform Versatility: Compatible with PPTX and Google Slides for broad accessibility.
- Data Integration: Prepped for stats from Nutrition Source on wheat germ oil's potency.
Grounded in expertise from Medical News Today's top 10 foods, these features elevate your content's trustworthiness.
Practical Applications Across Industries
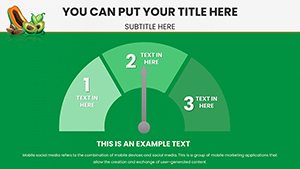
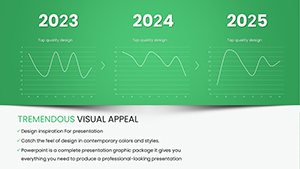
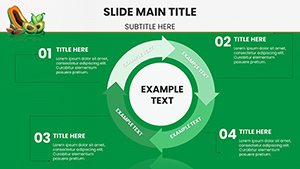
Visualize a marketer launching a campaign on Vitamin E's skin benefits, using pie charts to break down daily needs. Or an educator teaching about deficiency risks with timelines of health impacts, boosting student engagement per healthdirect insights.
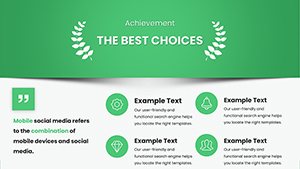
A researcher might present at conferences with bar charts on vegetable oils, citing ODS for accuracy, leading to collaborative opportunities. Case in point: A diet brand used similar visuals for a webinar, seeing 40% more sign-ups.
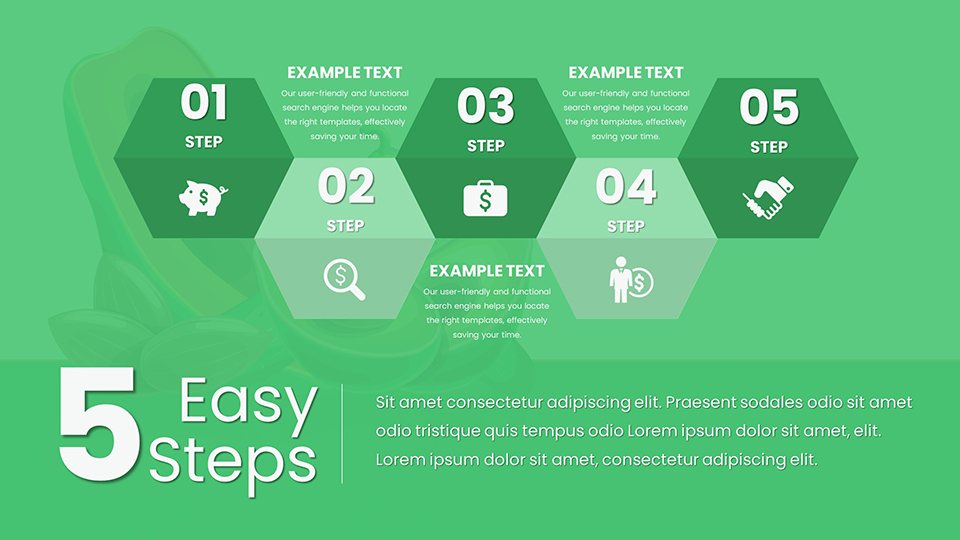
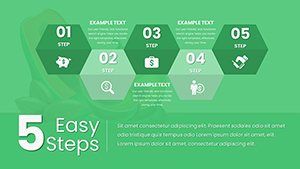
Guide to Building Your Vitamin E Presentation
- Define Objectives: Focus on benefits like vision health or sources like spinach.
- Add Content: Insert data from reliable lists, e.g., peanuts' E levels.
- Enhance Visuals: Use colors for appeal, ensuring mobile-friendly designs.
- Refine Narrative: Incorporate tips from Medpark Hospital on natural sources.
- Deliver Confidently: Rehearse for seamless impact.
This surpasses basic PowerPoint with nutrition-specific depth, streamlining creation.
Pro Tips for Engaging Health Talks
Add whimsy - like noting avocados as 'nature's butter' - to humanize facts. Link to sources for credibility, integrating with tools for interactive elements. For researchers, use in grants to illustrate benefits clearly.
Revolutionize your nutrition storytelling - grab these Vitamin E charts and nourish minds now.
Frequently Asked Questions
How detailed are the Vitamin E food charts?
They cover sources and benefits with editable graphs for precise data visualization.
Can I customize for branding?
Yes, full control over colors, fonts, and layouts.
Ideal for which audiences?
Educators, marketers, and health researchers.
Does it address health benefits?
Yes, including immunity and skin health per expert sources.
Software compatibility?
PowerPoint and Google Slides ready.