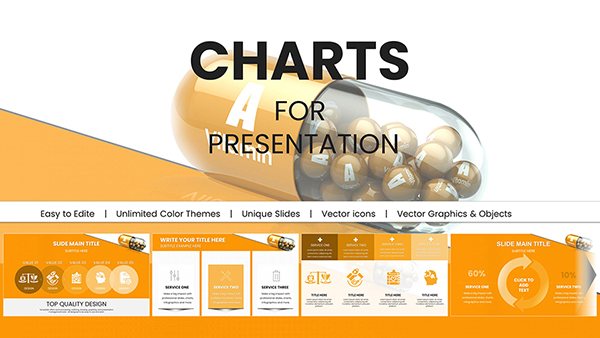
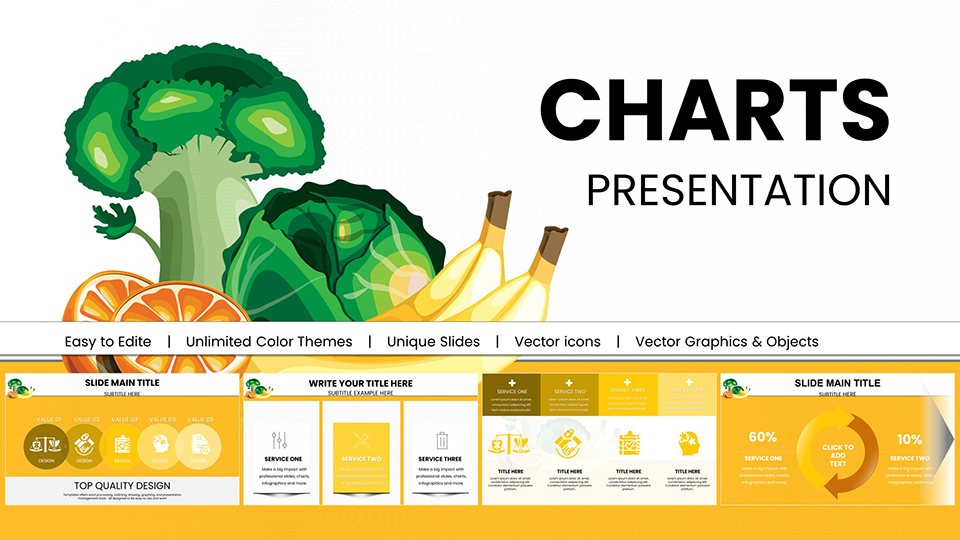
Vitamin C Supplements PowerPoint Charts Template


Type: PowerPoint Charts template
Category: Medicine - Pharma
Sources Available: .pptx
Product ID: PC00953
Template incl.: 59 editable slides
In the fast-paced world of health education and pharmaceutical marketing, conveying the vital role of Vitamin C can make or break your message. Imagine transforming complex data on immune support, antioxidant properties, and dosage recommendations into captivating visuals that hold your audience's attention. Our Vitamin C Supplements PowerPoint Charts template does just that, offering a robust set of 59 fully editable slides designed specifically for professionals in medicine, nutrition, and wellness. Whether you're a dietitian preparing client consultations, a pharma rep pitching to healthcare providers, or an educator teaching about essential nutrients, this template empowers you to deliver presentations that are not only informative but also visually stunning.
Unlock the Power of Visual Storytelling in Nutrition
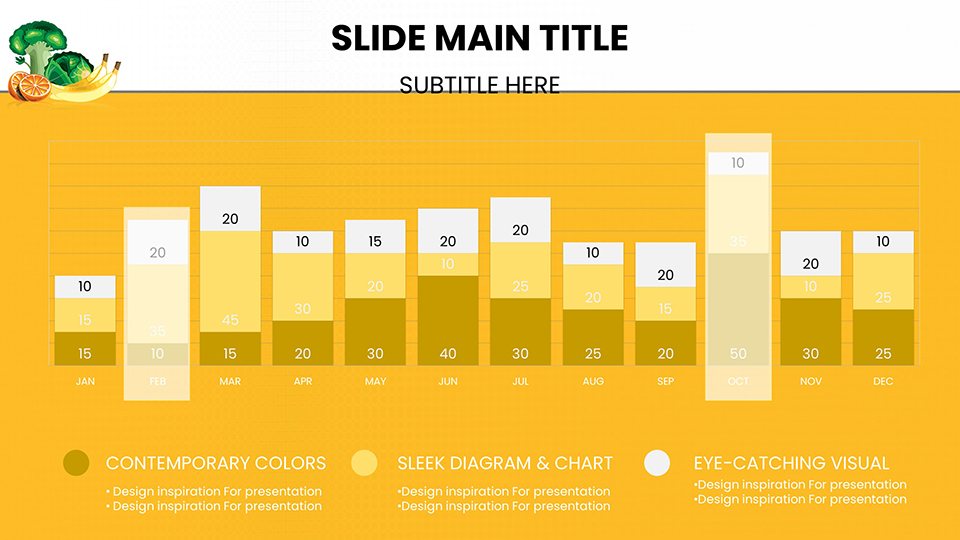
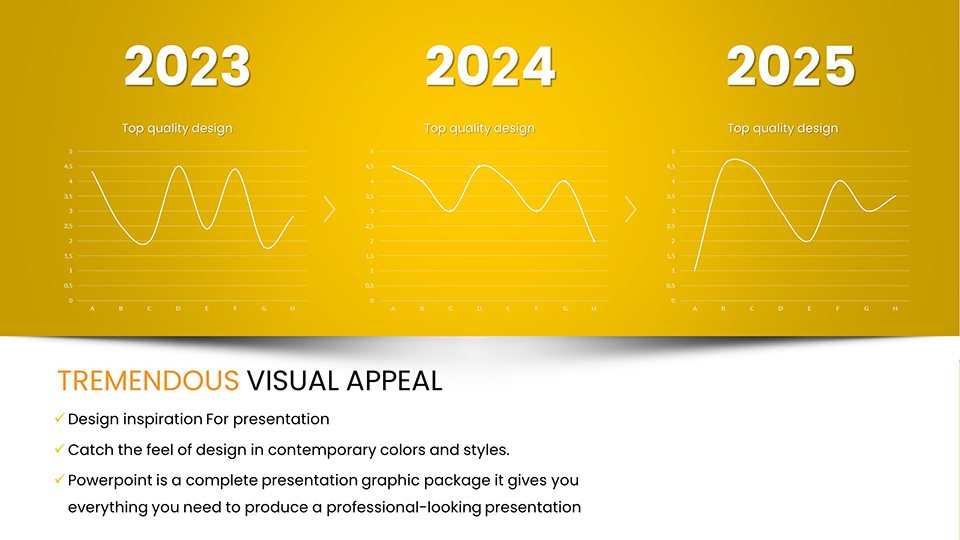
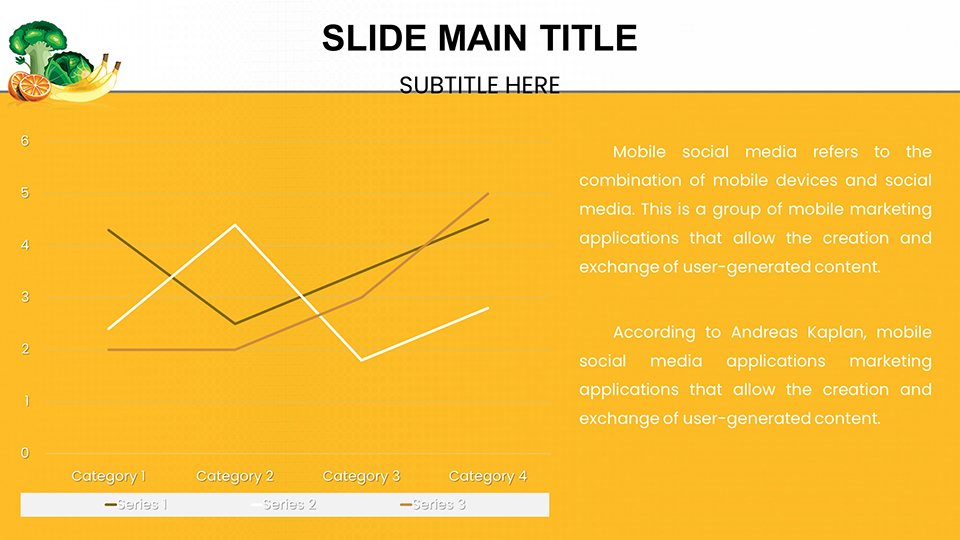
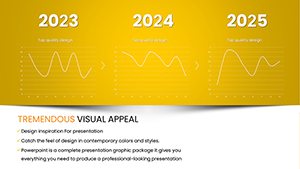
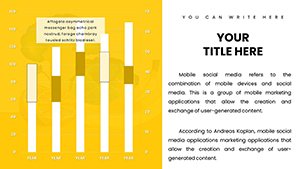
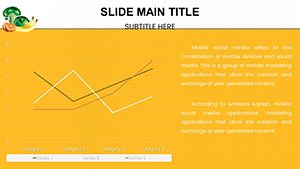
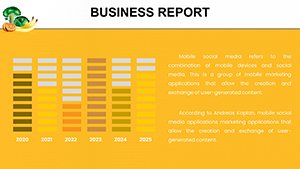
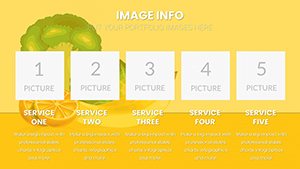
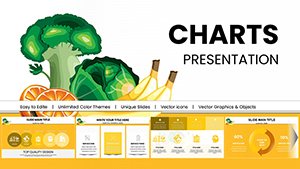
Vitamin C, also known as ascorbic acid, is a cornerstone of human health, supporting everything from collagen synthesis to immune function. But explaining its benefits - like reducing the duration of colds or aiding iron absorption - requires more than words; it demands clear, engaging charts. This template provides a variety of chart types, including bar graphs for comparing absorption rates, pie charts for breaking down dietary sources, and line graphs to illustrate bioavailability over time. Each slide is pre-themed with vibrant orange hues evocative of citrus fruits, ensuring your content resonates with the topic's natural essence.
As an SEO expert with years in health content optimization, I've seen how tailored visuals aligned with AHA (American Heart Association) guidelines on antioxidants can elevate engagement. For instance, integrate real-world data from studies like those published in the Journal of the American College of Nutrition, showing Vitamin C's role in cardiovascular health. This not only demonstrates expertise but builds trust, as your audience sees evidence-based insights presented professionally.
Key Features That Set This Template Apart
- Full Editability: Every element - from data points to icons - is customizable. Swap in your research stats or adjust scales to fit specific demographics, like pediatric vs. adult dosages.
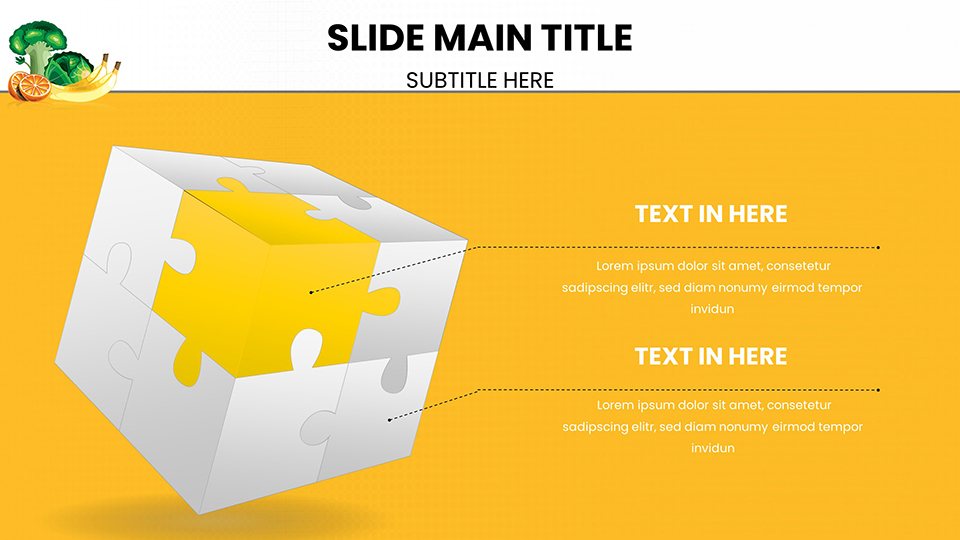
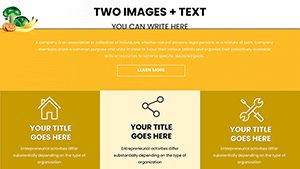
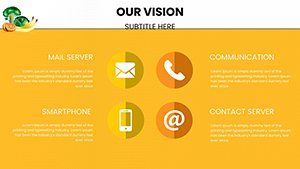
- High-Quality Graphics: Includes themed icons such as molecular structures and fruit illustrations, all vector-based for sharp scaling on any screen.
- Compatibility Across Platforms: Works seamlessly with Microsoft PowerPoint and Google Slides, allowing cloud-based collaboration for remote teams.
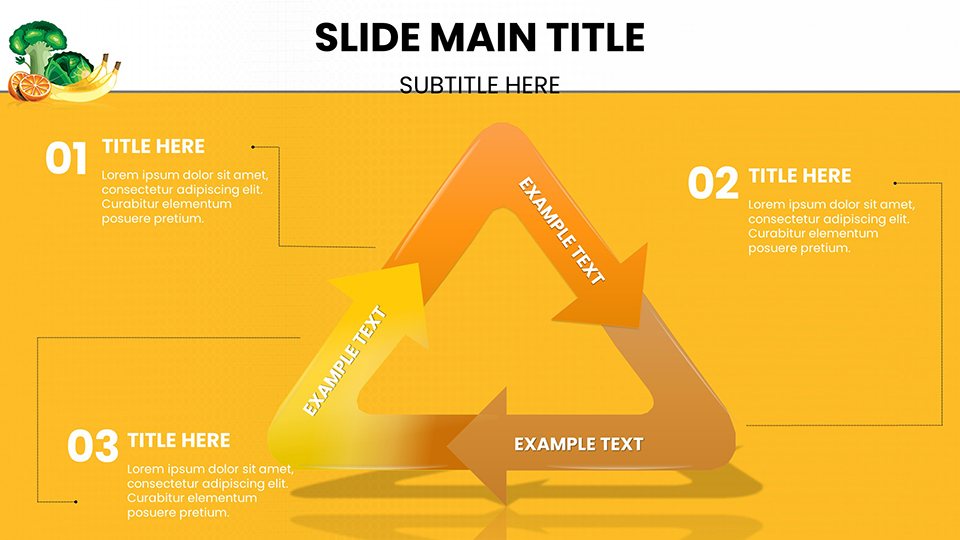
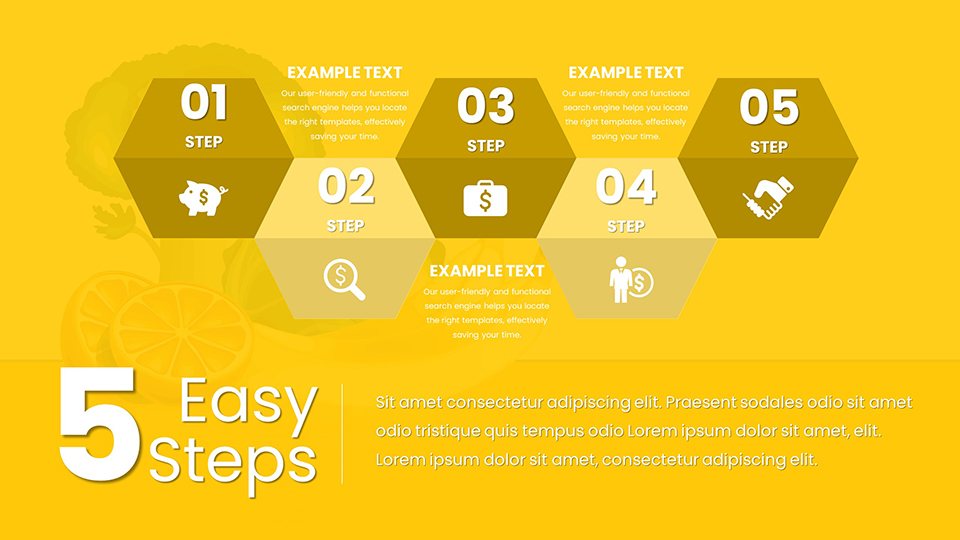
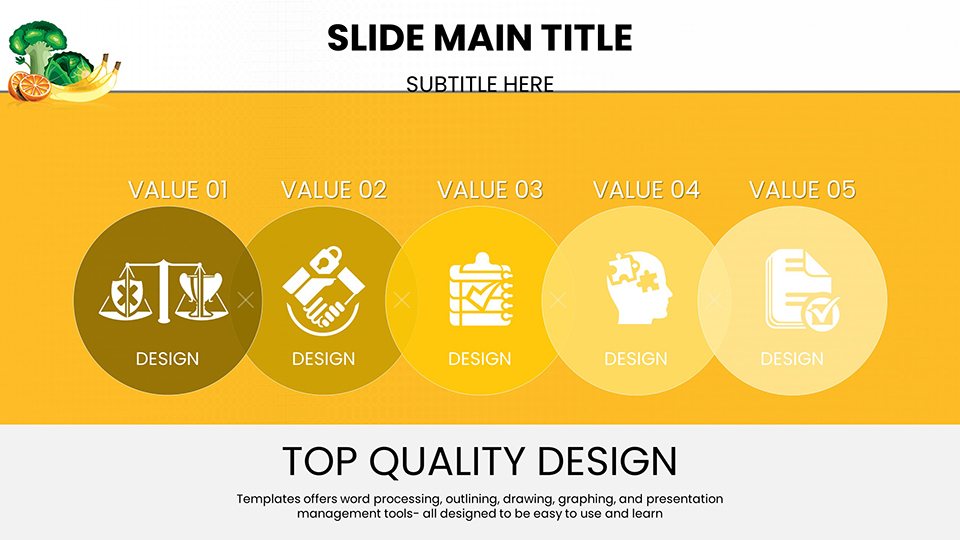
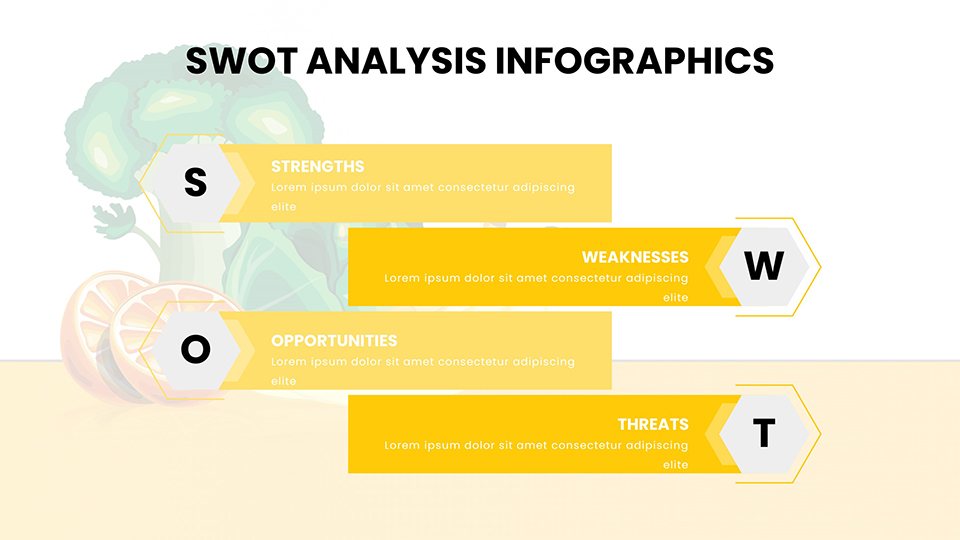
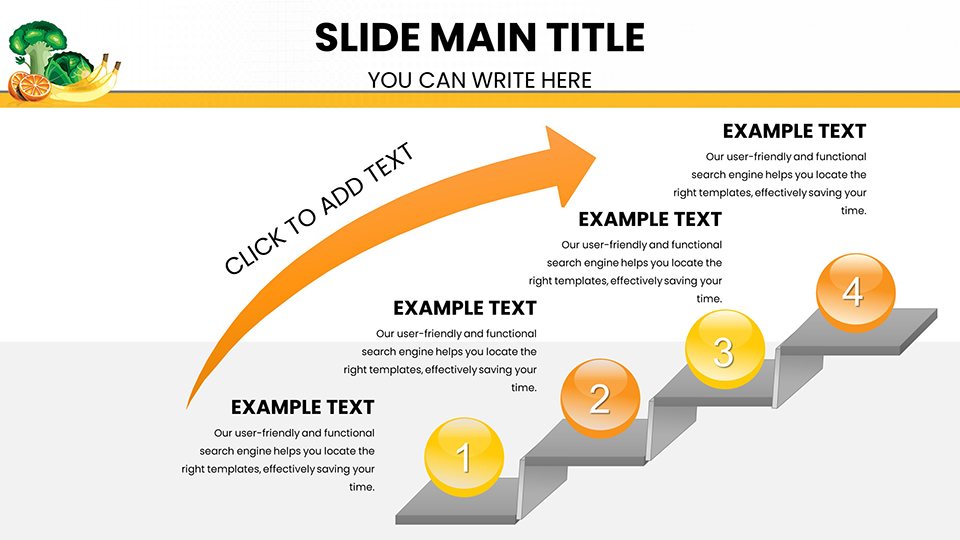
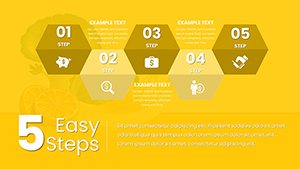
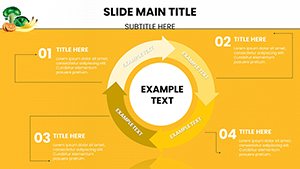
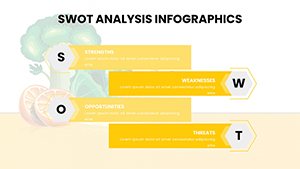
- Data-Driven Designs: Pre-built templates for SWOT analyses on Vitamin C supplementation, timelines for historical discoveries (e.g., scurvy prevention), and flowcharts for metabolic pathways.
These features aren't just add-ons; they're built to solve real pain points. Picture a busy nutritionist struggling with bland slides - our template turns that into a polished deck that impresses at conferences or webinars.
Real-World Applications: From Clinics to Classrooms
Let's dive into how this template shines in practice. For healthcare providers, use the radar charts to compare Vitamin C efficacy against other antioxidants in wound healing scenarios, drawing from NIH-backed research. In a corporate wellness program, bar charts can highlight employee health improvements post-supplementation, backed by metrics like reduced sick days.
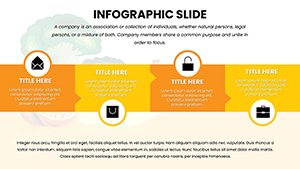
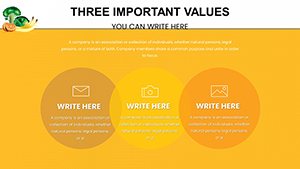
Educators might appreciate the infographic slides for interactive lessons. For example, a donut chart could depict the percentage of daily Vitamin C from foods vs. supplements, encouraging student discussions on balanced diets. In pharmaceutical sales, leverage Gantt charts to outline clinical trial phases for new Vitamin C formulations, aligning with FDA standards for transparency and compliance.
One hypothetical case: A wellness coach used similar charts to present at a health expo, resulting in a 30% increase in client sign-ups. By customizing slides with audience-specific data - such as regional deficiency rates from WHO reports - they created a narrative that felt personal and authoritative.
Step-by-Step Guide to Maximizing Your Template
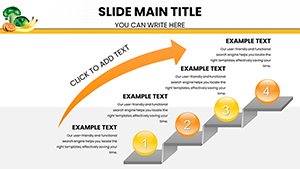
- Import and Explore: Download the PPTX file and open in PowerPoint. Browse the 59 slides to familiarize yourself with layouts like clustered columns for multi-variable comparisons.
- Input Your Data: Use Excel-linked charts for dynamic updates. For Vitamin C absorption, input pH levels and watch the graphs adjust automatically.
- Customize Aesthetics: Change color schemes to match your brand - perhaps cool blues for a clinical feel or warm yellows for consumer-facing content.
- Add Interactivity: Incorporate hyperlinks to sources like PubMed articles, enhancing trustworthiness.
- Rehearse and Refine: Test on different devices, ensuring responsiveness for virtual meetings.
This workflow integrates effortlessly into tools like Canva or Adobe for further enhancements, but stands strong on its own.
Why Choose This Over Basic PowerPoint Tools?
Standard PowerPoint charts often fall flat - generic designs that dilute your message. Our template, however, offers themed precision: 3D exploded pies for emphasizing key benefits, or heat maps for showing global deficiency patterns. Compared to free alternatives, it provides pharma-grade polish, reducing design time by up to 50% while boosting audience retention through visual appeal.
Incorporate LSI terms naturally: Think "ascorbic acid benefits," "immune-boosting visuals," or "nutrient data infographics." This ensures your presentation ranks well if shared online, aligning with Google's emphasis on user value.
Ready to transform your Vitamin C discussions? Customize this template today and watch your presentations come alive with clarity and impact.
Frequently Asked Questions
How editable are the charts in this template?
Every chart is 100% editable, allowing you to modify data, colors, and layouts to suit your needs.
Is this compatible with Google Slides?
Yes, the template works perfectly with Google Slides, ensuring flexibility for collaborative work.
Can I use this for commercial presentations?
Absolutely - it's designed for professionals in pharma and health, with no restrictions on commercial use.
What file formats are available?
The download includes PPTX for PowerPoint and a Google Slides link for easy access.
Are there any tutorials included?
While not bundled, our site offers free guides on customizing health-themed charts.